Engenharia Civil
Hydrodynamic dispersion of sodium by equilibrium and non-equilibrium methods through undisturbed sandy soil columns from the Adamantina Formation
Hydrodynamic dispersion of sodium by equilibrium and non-equilibrium methods through undisturbed sandy soil columns from the Adamantina Formation
Acta Scientiarum. Technology, vol. 41, 2019
Universidade Estadual de Maringá
Received: 14 February 2017
Accepted: 27 November 2017
Abstract: Column tests using undisturbed samples of residual sandy soil from the Adamantina Formation (K) were performed to determine the sodium hydrodynamic coefficient by equilibrium and non-equilibrium methods. Analyzing the porosity and soil characteristics, as well as the breakthrough curves, it was possible to note a typical non-equilibrium transport behavior, related to the soil dual-porosity, particularly at early and late time behavior in the breakthrough curve tails. The experimental data were best fitted to the non-equilibrium method than to the equilibrium one, and the sum of the square errors was up to five-fold lower. The conceptual model analysis of the methods led to observations on the limitations of each method and a careful analysis of the obtained values, which are also related to the soil characteristics.
Keywords: dual-porosity, soil physical characteristics, conceptual model.
Introduction
The hydrodynamic dispersion coefficient (Dh) is one of the most important solute transport parameters, and its correct quantification is essential to accurately estimate groundwater contamination and, therefore, analyze, assess and manage the possible risks related to contaminated sites. Typically, the experimental Dh is obtained inversely, by fitting the analytical solution of the differential equation of a transport model, and the convection-dispersion equation (CDE), for specified boundary conditions (Lapidus and Amundson, 1952) to the experimental breakthrough curves (BTC). In addition, Dh can be determined directly from column tests, using one of the available methods (Bear, 1961; Ogata & Banks, 1961; Brigham, 1974).
When column tests are performed in soil columns with unpreserved intact structures, these methods work very well (Carmo, Antonino, Netto, & Corrêa, 2010; Magga et al., 2008) since they were developed empirically from tests in homogeneous soils and, often, non-reactive solutes. In these conditions, the equilibrium advective-dispersive transport model can represent the regular behavior of the solute.
However, those models are based on simplifications that may not accurately reflect natural conditions. It is well known that undisturbed soil columns are subject to the presence of macroporosity, dual-porosity, and other heterogeneities. These characteristics may strongly affect solute transport parameter values by creating non-uniform flow fields with widely different velocities, phenomena often referred to as non-equilibrium transport, i.e. when an immobile (related with micropores) and a mobile (related with macropores) liquid phase is present (van Genuchten & Wierenga, 1976; Brusseau & Rao, 1990; Ray, Ellsworth, Valocchi, & Boast, 1997; Schwartz, Juo, & McInnes, 2000; Lamy, Lassabatere, Bechet, & Andrieu, 2009). Usually, for non-equilibrium transport, the CDE is valid in the mobile domain, and diffusion is assumed in the immobile one (van Genuchten and Wierenga, 1976).
Several studies have pointed out that non-equilibrium transport plays an important role in the preferential movement of water and solutes. Thus, non-equilibrium models should be used to more adequately represent transport in heterogeneous media (van Genuchten & Wierenga, 1976; Bibby, 1981; Gerke & Genuchten, 1993; Saxena, Jarvis, & Bergström, 1994; Larsson & Jarvis, 1999a; 1999b; Šimůnek, Jarvis, & van Genuchten, 2003; Lewandowska, Szymkiewicz, & Burzyński, 2004; Jiang, Pang, Buchan, Šimůnek, & Noonan, 2010).
In this context, this study applied equilibrium and non-equilibrium methods to determine the Dhof the sodium ion, comparing both. To achieve this aim, column tests were performed using undisturbed columns of residual sandy soil from the Adamantina Formation (K) in the city of Cabrália Paulista, in the state of São Paulo, Brazil. Five methods that consider equilibrium advective-dispersive transport model and one that considers a non-equilibrium model were used. Our emphasis is on examining the characteristics of each method and the errors resulting from the use of a less suitable method for the studied soil, demonstrating the importance of choosing a correct model for determining the Dh, and the complexity of this choice.
Material and methods
This study was carried out through the following basic steps: 1) Soil sampling; 2) Soil physical-chemical characterization; 3) Column tests and porosity analysis; 5) Chemical analysis; and 6) Determination of the hydrodynamic dispersion coefficients. These six steps will be detailed after the basic characteristics of the study area section.
Basic characteristics of the study area
The study area is located in Cabrália Paulista city, in the state of São Paulo, Brazil. The main pedological soil types identified therein are Oxisol, Ultisol, and Latosol. This area is constituted by the residual soil of sandstones from the Adamantina Formation, Bauru Group (K). The area was chosen because its geological materials are spread at about 117,000 km2 in the state of São Paulo (Silva, Kiang, & Caetano-Chang, 2003) and are subdivided into several local aquifer units, which are very important in terms of public water supply.
Soil sampling
Disturbed samples were collected from the study area to characterize soil mineralogy and physical, chemical and physicochemical properties. Undisturbed soil columns were carefully collected from hand-excavated trenches, using rigid PVC cylinders, for column testing.
Soil physical-chemical characterization
In the laboratory, the disturbed samples were air-dried and sieved through a #10 mesh sieve (2 mm openings). The mineralogical analysis was performed by X-ray diffraction by the powder method in the clay fraction (Azaroff and Buerger, 1953), while the particle size analysis was performed according to the ASTM D422 standard and the density of the solids was determined according to the ASTM D854-10. Subsequently, the following parameters were also determined: pH in H2O and in KCl, Eh and electrical conductivity (EC) (Donagema and Campos, 2011), delta pH (pHKCl – pHH2O) (Mekaru and Uehara, 1972), point of zero charge (PZC) (2pHKCl – pHH2O) (Keng and Uehara, 1974), organic matter content according to the ASTM D2974 – 00 and cation exchange capacity (CEC). A porosity analysis by mercury intrusion was also performed (Washburn, 1921).
Column tests
The PVC cylinders used for collecting the undisturbed soil samples (150 mm long and with 97.2 mm internal diameter) were used as rigid-wall permeameters, in which column tests were conducted. The soil columns were first slowly saturated from the bottom with distilled water in order to remove entrapped air. This saturation was performed by positioning the bottom of the soil columns at the almost same height as the distilled water level. To ensure complete saturation, the distilled water was allowed to overflow 1 cm on the soil surface during two uninterrupted days. After column saturation, the flow was reversed, and the test was performed under a constant hydraulic gradient of 1.5. This hydraulic gradient can be considered high for real conditions but was chosen to reduce the test time.
The steady state condition was achieved when no flux variation was observed with time. Subsequently, the following water flow parameters were obtained from each column: saturated hydraulic conductivity, Ksat; Darcy velocity, q ; flux, Q and average linear velocity, v (Freeze and Cherry, 1979). Total porosity, n, that represents the total of voids (connected and non-connected pores), was measured by considering the ratio of the pore volume to the total volume of each soil column. On the other hand, connected pores are represented by the effective porosity, ne, which is used in the calculation of v. The percentage of pores larger than 10 µm was adopted based on the testing by mercury intrusion porosimetry (Figure 1) (Ahuja et al., 1984) .
The pH and electrical conductivity, both of the input solution and of the percolated effluent solution, were monitored. Percolation occurred in a downward flow. Three columns were percolated with NaCl and the effluents were collected at each pore volume and stored in refrigerated plastic containers. The concentration of the initial solution inleted to columns 1, 2 and 3 were, respectively, 0.050, 0.090 and 0.177 kgm-3. At the end of the tests, the columns were percolated using three pore volumes of distilled water, with a pH ranging from 6.8 to 7.2.
Chemical analysis of the solutions
Na+ concentrations were determined using a MICRONAL B26 flame photometer after appropriate dilution. Based on the relative concentration data (C/Co) versus the respective pore volume percolated with the effluent, the BTC for the Na+ were obtained.
Determination of hydrodynamic dispersion coefficient
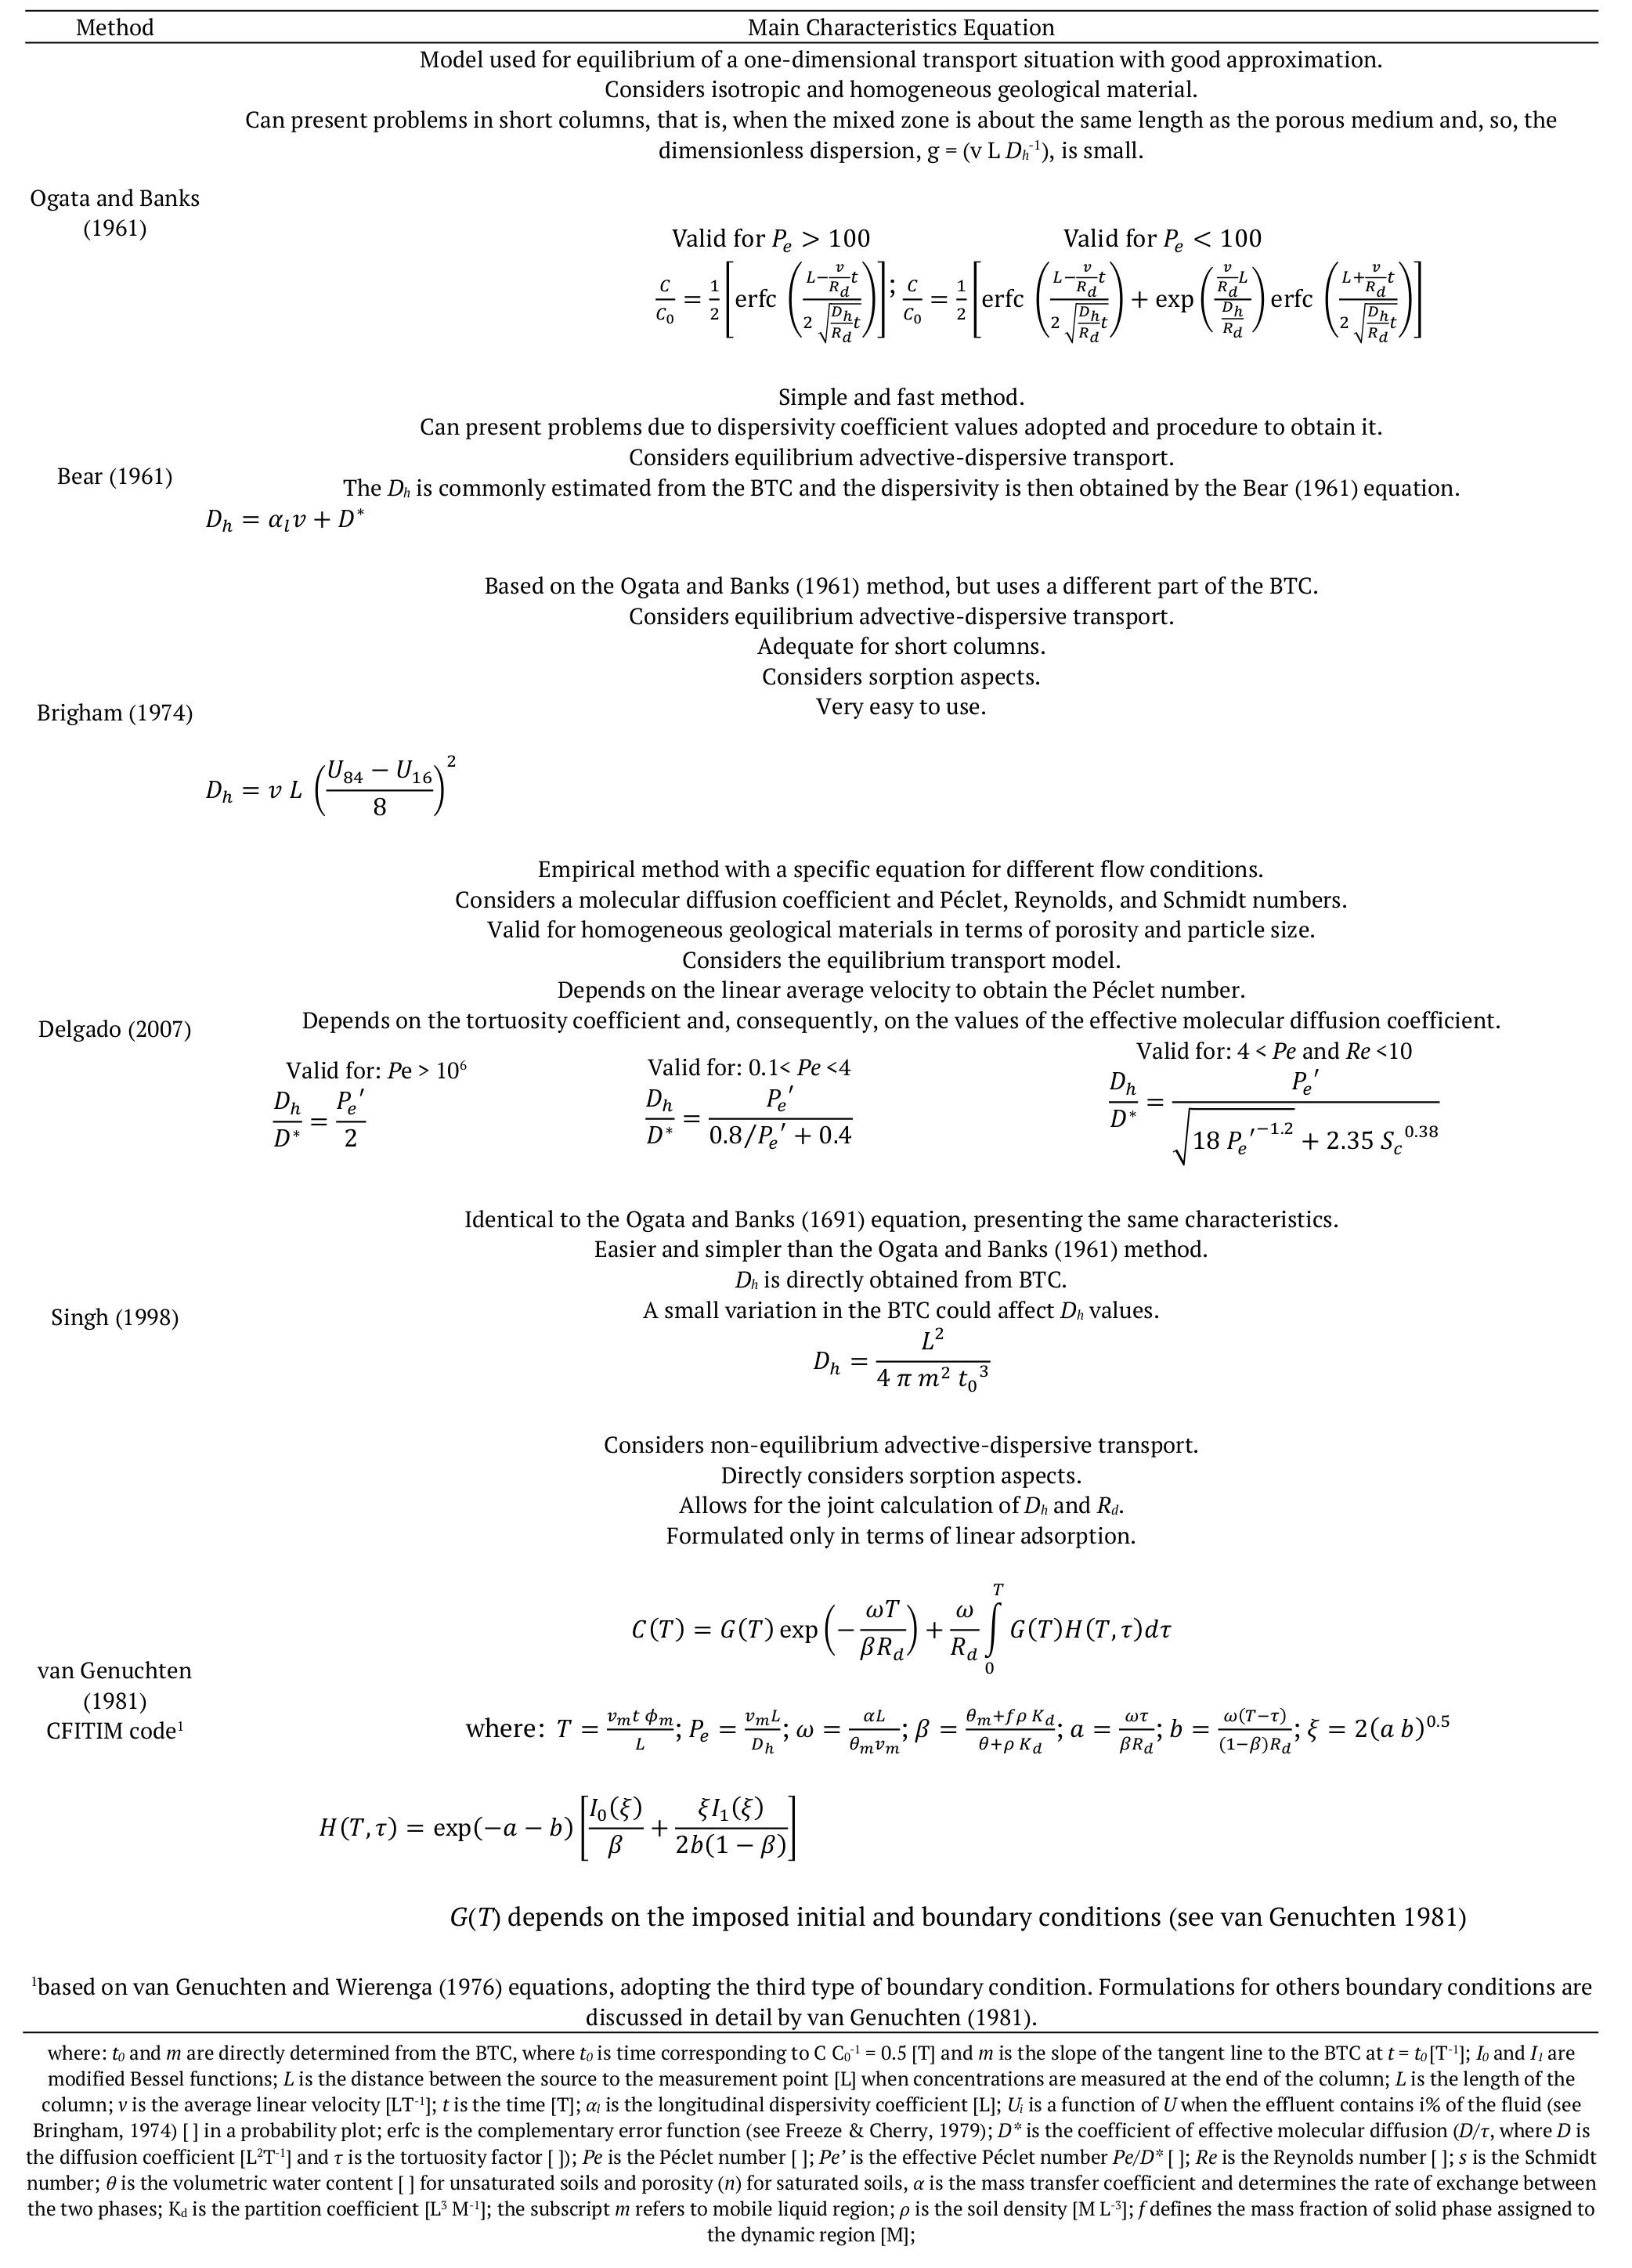
The Dh was determined using equilibrium methods proposed by: 1) Ogata and Banks (1961); 2) Brigham (1974); 3) Singh (1998); 4) Bear (1961); and 5) Delgado (2007). The non-equilibrium method applied was that proposed by van Genuchten (1981) , while the Dh was determined using the CFITIM code for the third type boundary condition (constant flux). This code is part of the Windows-based computer software package Studio of Analytical Models (STANMOD). Table 1 displays the methods and their main characteristics.
Results and discussion
Soil characterization and flow parameters
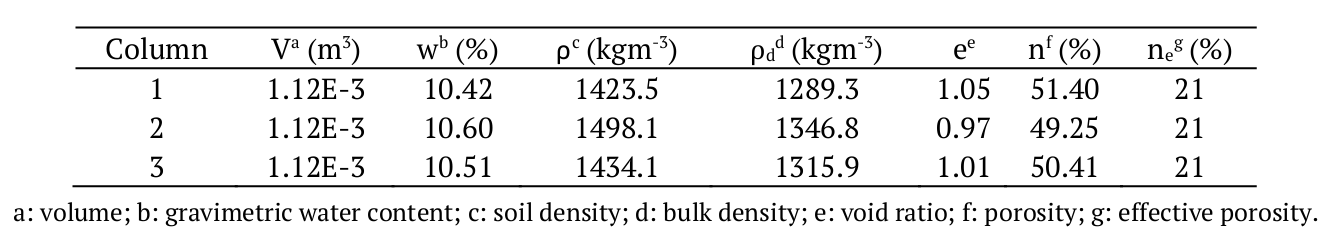
The mineralogy consists of quartz, kaolinite, and gibbsite. Texturally, the soil consists of 79.4 sand, 10.5 clay and 10.1% silt particles (mean values). The specific weight of the solids was consistent with sandy soil values (26.4 kNm-3). Table 2 displays the physical characteristics of each of the undisturbed columns. The columns display physical characteristics and values consistent with the type of soil under investigation. The CEC value (2.903 cmolkg-1) suggests a soil with a low capacity to adsorb cations by electrostatic adsorption. According to the soil salinity classification of the Food and Agriculture Organization of the United Nations (FAO), the electrical conductivity values indicate small amounts of dissolved salts (55.70 mSm-1) and a non-saline soil (Brigham, Reed, & Dew, 1961). The soil has values of 5.23 and 4.20 for the pH in H2O and in KCl, respectively. The soil presented values of 5.23 and 4.20 for pH in H2O and in KCl, respectively. The negative delta pH (-1.03) and PZC lower than the pHH2O (4.18) indicate a predominance of negative charges, which can promote cation adsorption. In addition, the soil contains a small amount of organic matter (1.18%).
The porosimetry results were discussed based on Figure 1 and on the porosimetry analysis report. According to the classification scheme proposed by Koorevaar, Menelik, and Dirksen (1983), in which the diameters of micropores, mesopores, and macropores are, respectively, <30 µm, 30-100 µm and >100 µm, the porosimetry test indicated that the pores consisted of approximately 5 macropores, 50 mesopores, and 45% micropores. Besides that, Figure 1 shows the presence of two primary pore sizes, i.e., diameters of 0.01 to 0.03 µm and 10 to 100 µm, indicating the presence of dual-porosity in the form of two frequency peaks.
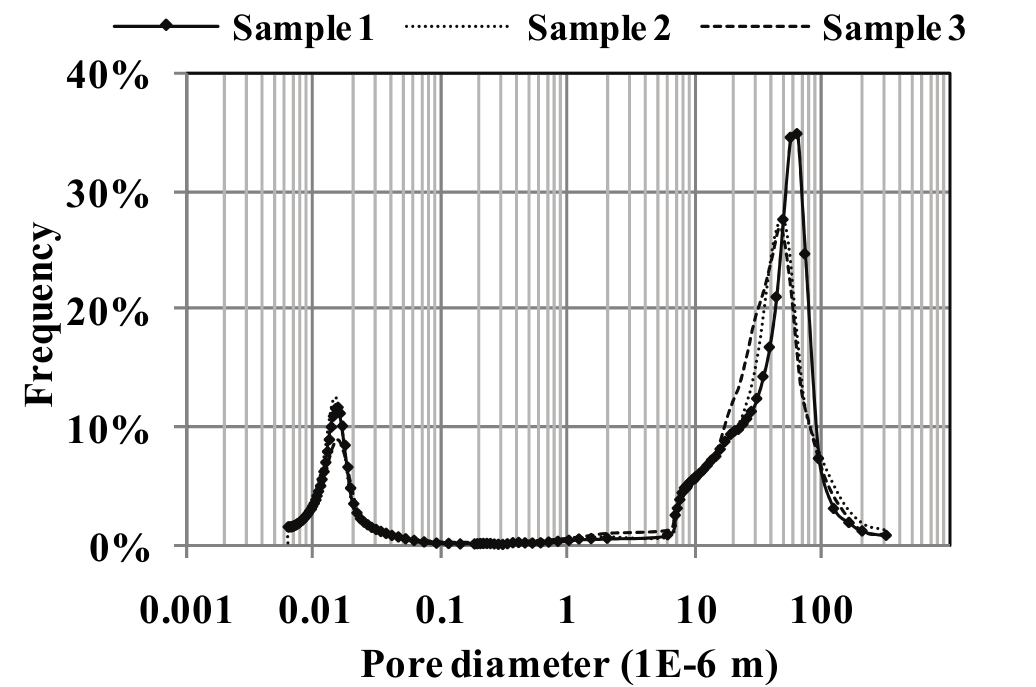
Figure 1.
Porosimetry tests results – pore diameter versus frequency.
A visual analysis indicated that the soil also contains macropores larger than 100 µm that were not identified in the porosimetry analysis, mainly due to the small size of the soil sample analyzed in that analysis, i.e., cylindrical samples of 1 cm in diameter and 2 cm long. These pores range up to 4 mm in diameter and were very important in determining solute transport mechanisms.
The average hydraulic conductivity coefficient is within the range typical of sandy soils (10E‑5 m s-1) (Rezanezhad et al., 2012). The mean linear velocity can be considered high (10E-4 m s-1), most likely due to the presence of preferential pathways (McMahon & Thomas, 1974; Dousset, Thevenot, Pot, & Šimunek, 2007; Delwiche, Lehmann, & Walter, 2014; Silva, van Lier, Correa, Miranda, & Oliveira, 2016).
Analysis of breakthrough curves
Figure 2 displays the breakthrough curves for Na+. The time of duration of the tests was set as the dimensionless number of pore volume (T = vt L-1), allowing comparisons between the columns. The BTC tails show that at the beginning solute speedily left the soil column, followed by a slow transport and tailing. Thus, Na+ concentrations did not reach inflow concentrations in any curve, probably an indication of physical non-equilibrium (Vanderborght, Timmerman, & Feyen, 2000; Dousset et al., 2007; Jarvis, 2007). The observed behaviors can be explained by the presence of dual-porosity in the soil, in which some portions of the solutes can leave the column due to advection and others can be delayed, due to percolation through micropores and non-connected pores, causing the ions to remain in the column throughout the test. This has also been mentioned in other papers (van Genuchten & Wierenga, 1976; Jarvis, 2007; Silva et al., 2016). In addition, according to Gerritse (1996), a non-sigmoidal shape could be due to the presence of heterogeneous adsorption sites in the soil, caused by the small-scale heterogeneity. Finally, the results of the BTC supporting laboratory tests clearly show that the soil samples contain macropores that strongly influences flow and solute transport.
Hydrodynamic dispersion coefficient
Analyzing the porosity and soil characterization, as well as the BTC (Figure 2), a typical non-equilibrium transport behavior is noted, particularly at the early (up to 4 pore volumes – Figure 2) and late (from 8 pore volumes – Figure 2) behavior in the BTC tails. This behavior may be explained by the fact that that the mobile region contains large pores that fill with a solute that left the soil column quickly and appears at an earlier BTC time. Subsequently, a significant tailing occurs at the late time, due to solute diffusion into immobile regions.
This is also demonstrated with the comparison of errors resulting from the fit of the Dh values for sodium obtained with the models proposed by Ogata and Banks (1961) (equilibrium) and van Genuchten (1981) (non-equilibrium). The experimental data were best fitted to the non‑equilibrium method and the sum of the squares errors was up to five times lower, demonstrating the suitability of the non-equilibrium method for the studied soil. Subsequently, the Dhwas calculated using all method described in the materials and methods section. Table 3 displays the parameters obtained for each method. The average results of equilibrium methods were compared with those obtained with the non-equilibrium method. The latter method was the most adequate for representing the data, due to the aforementioned analysis. The differences were analyzed based on the study of conceptual models of each method. These results are displayed in Figure 3.
Higher errors were obtained through Ogata and Banks’s method (1961), probably due to the fact that the fit of the experimental data using this method is truncated at the zero-initial time, thus assuming that the relative concentration at this time is also zero, or very low and that it increases very slowly. Moreover, the BTC adopted in this method has a sigmoid shape and the inflection point occurs at a relative concentration equal to 0.5, a behavior that was not observed. In addition, this method was developed exclusively for homogeneous soils, which is not the case herein.

Figure 2.
Na+ breakthrough curves.
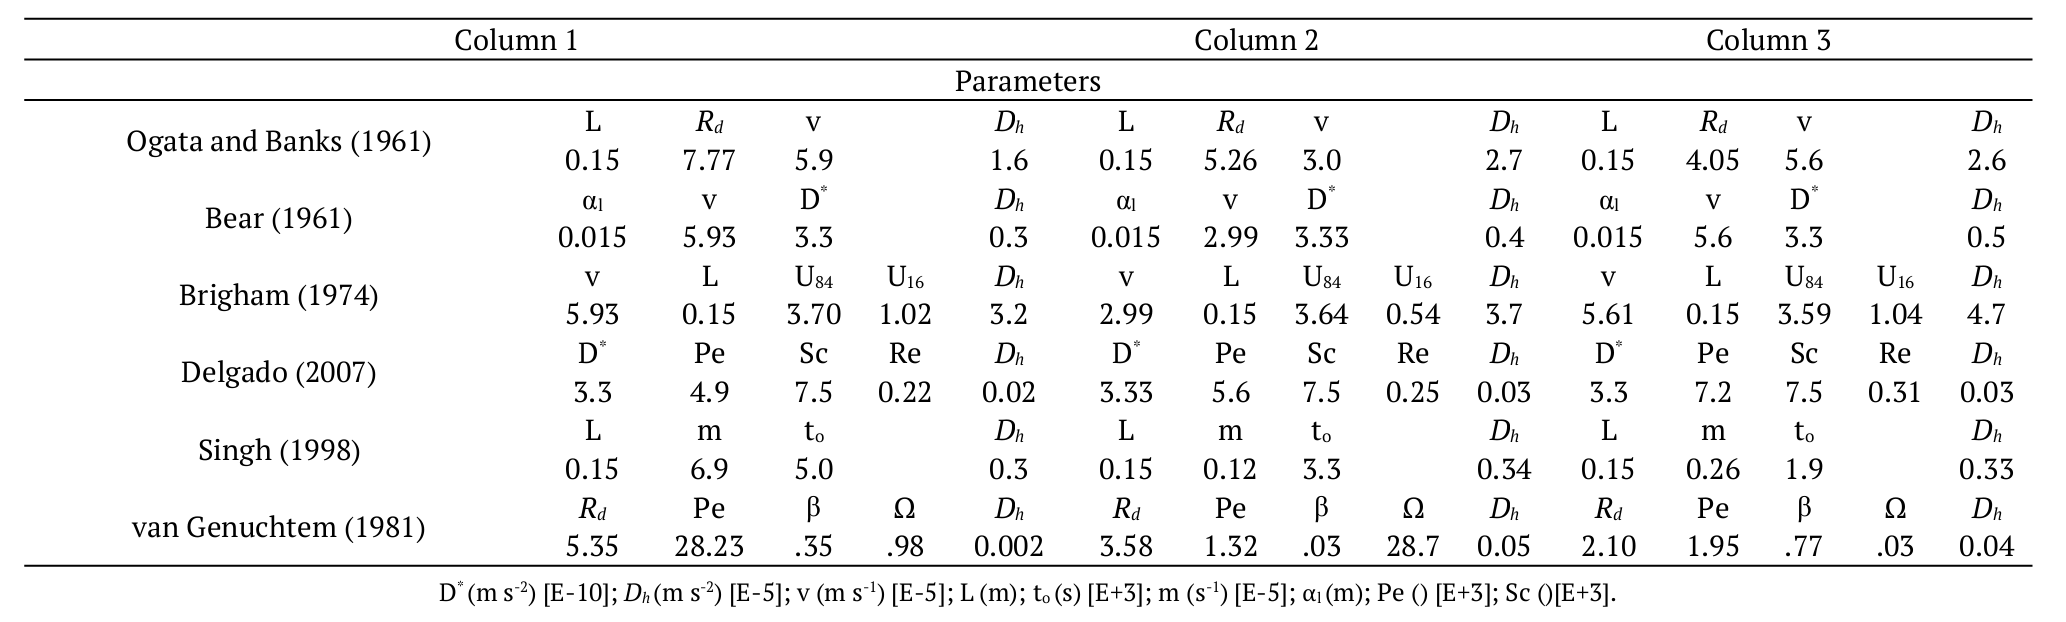

Figure 3.
Differences between mean Dh values obtained by the six methods applied herein.
Before using the Brigham (1974) method, the dimensionless dispersion was determined for all soil columns. Since the values were 8.9, 6.7 and 9.8 for columns 1, 2 and 3 respectively, this method was deemed suitable. However, the probability plot of the function U did not result in a straight line, demonstrating that the boundary conditions used in this method would not be suitable for representing sodium Dh in the studied soil. The probability plots of the U-functions resulted in concave upward lines at high concentrations, a behavior more consistent with the presence of non-connected pores (Brigham, 1974). It is important to mention that this method is based on the Ogata and Banks equation and showed low error values in relation to the van Genuchten model (1981). As this method is not suitable for the studied soil, the low error can be obtained because the fit of the experimental data using this method has a greater degree of freedom compared to the Ogata and Banks method, and it allows the curve to be shifted to a start time different than zero. Thus, a larger amount of data points passes the shifted curve, causing smaller errors than those resulting from the Ogata and Banks method.
The method proposed by Singh (1998), although based on Ogata and Banks, also resulted in small errors, which can be explained by a different mathematical approach used in this method, allowing the consideration of higher concentrations since the beginning of the test, due to the greater degree of freedom of the fit, as occurred with the method proposed by Brigham (1974). Furthermore, with the displacement of the BTC, this method allows the consideration of early and late arrival times resulting from the percolation of the solution by macro and micropores, respectively, therefore justifying their small error values compared to van Genuchten (1981).
The method proposed by Delgado (2007) presented the lowest average errors. In this method, molecular diffusion is considered. In addition, it exhibits a great detail of the flow parameters when considering the Peclet and the Reynolds numbers. Therefore, this method can fairly represent an advective-diffusive transport without delay. However, the equations proposed by Delgado (2007) are based on results of several laboratory tests using nonreactive solutes in homogeneous porous media in terms of porosity and pore size. In addition, the low Dh values obtained should be more related to the importance given to the molecular diffusion, with values in the order of 10E-09 m2 s-1, than to the consideration of two pore regions, unlike the method proposed by van Genuchten (1981).
In the method proposed by Bear (1961) the errors also were low. However, the BTC is not regarded in this method. The determination of the longitudinal hydrodynamic dispersion by Bear’s method is performed, essentially, by considering only that the spreading of solute is Fickian and that it is affected only by the velocity differences in the pores, mechanical dispersion, and molecular diffusion. However, the results can also strongly be affected by the longitudinal dispersivity coefficient (αl). Since obtaining αl is often based on empirical relationships, which are not based on the breakthrough curve (Fetter, 1999), and do not take into account the actual behavior of the solute in the soil, this method may lead to inadequate Dh estimates.
Conclusion
The interpretation of the results must consider dual-porosity transport models to obtain valid results. Other methods would quite likely produce erroneous results. The analysis of the conceptual models of the methods used to determine the hydrodynamic dispersion led to observations of the limitations of each method and a careful analysis of the obtained values, which are related to the characteristics of the soil. Due to the good fits of experimental data and the soil characteristics, the best method for determining the hydrodynamic dispersion coefficient was that proposed by van Genuchten (1981). It is worth mentioning that the main limitation of this research is that it is site specific. In addition, only a limited amount of soil column was studied. Future research can also be performed by considering different boundary conditions, since this can influence Dh values. Lastly, it was concluded that there is no single perfect method for determining soil transport parameters. Modeling of solute transport should be performed with caution and the modeler should evaluate not only the final value but also the conceptual models and the limitations of each method as they relate to the soil under investigation.
Acknowledgements
This research was made possible by the involvement of financial support from the Coordenação de Aperfeiçoamento de Pessoal de Nível Superior (Capes). The authors would also like to thank teachers and staff of the State Technical School “Astor de Mattos Carvalho” for allowing collecting soil samples in the school’s area. We also would like to thank the reviewers for their useful comments, that improved this paper.
References
Ahuja, L. R., Naney, J. W., Green, R. E., & Nielsen, D. R. (1984). Macroporosity to characterize spatial variability of hydraulic conductivity and effects of land management1. Soil Science Society of America Journal, 48(4), 699. doi: 10.2136/sssaj1984.03615995004800040001x
Azaroff, L., & Buerger, M. (1953). The powder method in X-ray crystallography. New York, NY: McGraw-Hill Book Co.
Bear, J. (1961). Some experiments in dispersion. Journal of Geophysical Research, 66(8), 2455-2467. doi: 10.1029/JZ066i008p02455
Bibby, R. (1981). Mass transport of solutes in dual porosity media. Water Resources Research, 17(4), 1075-1081. doi: 10.1029/WR017i004p01075
Brigham, W. (1974). Mixing equations in short laboratory cores. Society of Petroleum Engineers Journal, 14(1), 1-9. doi: 10.2118/4256-PA
Brigham, W. E., Reed, P. W., & Dew, J. N. (1961). Experiments on mixing during miscible displacement in porous media. Society of Petroleum Engineers Journal, 1(1), 1-8. doi: 10.2118/1430-G
Brusseau, M., & Rao, P. (1990). Modeling solute transport in structured soils: A review. Geoderma, 46(1-3), 169-192. doi: 10.1016/0016-7061(90)90014-Z
Carmo, A. I. d., Antonino, A. C. D. M., Netto, A., & Corrêa, M. M. (2010). Caracterização hidrodispersiva de dois solos da região irrigada do Vale do São Francisco. Revista Brasileira de Engenharia Agrícola e Ambiental, 14(7), 698-704. doi: 10.1590/S1415-43662010000700003
Delgado, J. (2007). Longitudinal and transverse dispersion in porous media. Chemical Engineering Research and Design, 85(9), 1245-1252. doi: 10.1205/cherd07017
Delwiche, K., Lehmann, J., & Walter, M. (2014). Atrazine leaching from biochar-amended soils. Chemosphere, 95, 346-352. doi: 10.1016/j.chemosphere.2013.09.043
Donagema, G., & Campos, D. (2011). Manual de métodos de análise de solo. Rio de Janeiro, RJ: Embrapa Solos.
Dousset, S., Thevenot, M., Pot, V., & Šimunek, J. (2007). Evaluating equilibrium and non-equilibrium transport of bromide and isoproturon in disturbed and undisturbed soil columns. Journal of Contaminant, 94(3-4), 261-276. doi: 10.1016/j.jconhyd.2007.07.002
Fetter, C., 1999. Contaminant hydrogeology (2nd ed.). New York, NY: Prentice Hall.
Freeze, R., & Cherry, J. (1979). Groundwater (p. 604). New Jersey, NJ: PrenticeHall Inc Englewood cliffs.
Gerke, H., & Genuchten, M. (1993). A dual porosity model for simulating the preferential movement of water and solutes in structured porous media. Water Resources Research, 29(2), 305-319. doi: 10.1029/92WR02339
Gerritse, R. G. (1996). Dispersion of cadmium in columns of saturated sandy soils. Journal of Environmental Quality, 25(6), 1344-1349. doi: 10.2134/jeq1996.00472425002500060025x
Jarvis, N. J. (2007). A review of non-equilibrium water fl ow and solute transport in soil macropores: Principles, controlling factors and consequences for water quality. European Journal of Soil Science, 58(3), 523-546. doi: 10.1111/j.1365-2389.2007.00915.x
Jiang, S., Pang, L., Buchan, G., Šimůnek, J., & Noonan, M. (2010). Modeling water flow and bacterial transport in undisturbed lysimeters under irrigations of dairy shed effluent and water using HYDRUS-1D. Water Research, 44(4), 1050-1061. doi: 10.1016/j.watres.2009.08.039
Keng, J. C., & Uehara, G. (1974). Chemistry, mineralogy, and taxonomy of oxisols and ultisols. Proceedings of Soil Crop Science Society of Florida, 33, 119-926.
Koorevaar, P., Menelik, G., & Dirksen, C. (1983). Elements of soil physics. In P. Koorevaar, G. Menelik, & C. Dirksen (Eds.), Developments in soil science (p. 1-36). Amsterdam, NL: Elsevier Science.
Lamy, E., Lassabatere, L., Bechet, B., & Andrieu, H. (2009). Modeling the influence of an artificial macropore in sandy columns on flow and solute transfer. Journal of Hydrology, 376(3-4), 392-402. doi: 10.1016/j.jhydrol.2009.07.048
Lapidus, L., & Amundson, N. (1952). Mathematics of adsorption in beds VI. The effect of longitudinal diffusion in ion exchange and chromatographic columns. The Journal of Physical Chemistry, 56(8), 984-988. doi: 10.1021/j150500a014
Larsson, M., & Jarvis, N. (1999a). A dual-porosity model to quantify macropore flow effects on nitrate leaching. Journal of Environmental Quality, 28(4), 1298-1307. doi: 10.2134/jeq1999.00472425002800040034x
Larsson, M., & Jarvis, N. (1999b). Evaluation of a dual-porosity model to predict field-scale solute transport in a macroporous soil. Journal of Hydrology, 215(1-4), 153-171. doi: 10.1016/S0022-1694(98)00267-4
Lewandowska, J., Szymkiewicz, A., & Burzyński, K. (2004). Modeling of unsaturated water flow in double-porosity soils by the homogenization approach. Advances in Water, 27(3), 283-296. doi: 10.1016/j.advwatres.2003.12.004
Magga, Z., Tzovolou, D. N., Theodoropoulou, M. A., Dalkarani, T., Pikios, K., & Tsakiroglou, C. D. (2008). Soil column experiments used as a means to assess transport, sorption, and biodegradation of pesticides in groundwater. Journal of Environmental Science and Health, Part B, 43(8), 732-741. doi: 10.1080/03601230802388868.
McMahon, M., & Thomas, G. (1974). Chloride and tritiated water flow in disturbed and undisturbed soil cores. Soil Science Society of America Journal, 38(5), 727-732. doi: 10.2136/sssaj1974.03615995003800050014x
Mekaru, T., & Uehara, G. (1972). Anion adsorption in ferruginous tropical soils. Soil Science Society of America, 36(2), 296-300. doi: 10.2136/sssaj1972.03615995003600020027x
Ogata, A., & Banks, R. B. (1961). A solution of the differential equation of longitudinal dispersion in porous media (Geological Survey Professional Papers, 411A). Washington, D.C.: United States Government Printing Office. doi: 10.3133/pp411A
Silva, F. P., Kiang, C. H., & Caetano-Chang, M. R. (2003). Perfis de referência do grupo Bauru ( K ) no Estado de São Paulo. Geociências UNESP, 22(esp.), 21-32.
Ray, C., Ellsworth, T., Valocchi, A., & Boast, C. (1997). An improved dual porosity model for chemical transport in macroporous soils. Journal of Hydrology, 193(1-4), 270-292. doi: 10.1016/S0022-1694(96)03141-1
Rezanezhad, F., Price, J. S., & Craig, J. R. (2012). The effects of dual porosity on transport and retardation in peat: A laboratory experiment. Canadian Journal of Soil Science, 92(5), 723-732. doi: 10.4141/cjss2011-050
Saxena, R., Jarvis, N., & Bergström, L. (1994). Interpreting non-steady state tracer breakthrough experiments in sand and clay soils using a dual-porosity model. Journal of Hydrology, 162(3-4), 279-298. doi: 10.1016/0022-1694(94)90232-1
Schwartz, R., Juo, A., & McInnes, K. (2000). Estimating parameters for a dual-porosity model to describe non-equilibrium, reactive transport in a fine-textured soil. Journal of Hydrology, 229(3-4), 149-167. doi: 10.1016/S0022-1694(00)00164-5
Silva, L. P., van Lier, Q. J., Correa, M. M., Miranda, J. H., & Oliveira, L. A. (2016). Retention and solute transport properties in disturbed and undisturbed soil samples. Revista Brasileira de Ciência Do Solo, 40, e0151045. doi: 10.1590/18069657rbcs20151045
Šimůnek, J., Jarvis, N., & van Genuchten, M. (2003). Review and comparison of models for describing non-equilibrium and preferential flow and transport in the vadose zone. Journal of Hydrology, 272(1), 14-35. doi: 10.1016/S0022-1694(02)00252-4
Singh, S. (1998). Estimation of dispersion coefficient from data on soil column test. In Annals of IX National Symposium on Hydrogeology (p. 1-26). Roorkee, IN.
van Genuchten, M. T. (1981). Non-equilibrium transport parameters form miscible displacement experiments (Research report no. 119). Riverside, CA: Salinity Laboratory, USDA, ARS.
van Genuchten, M. T., & Wierenga, P. J. (1976). Mass transfer studies in sorbing porous media I. Analytical solutions. Soil Science Society of America Journal, 40(4), 473-481. doi: 10.2136/sssaj1976.03615995004000040011x
Vanderborght, J., Timmerman, A., & Feyen, J. (2000). Solute transport for steady-state and transient flow in soils with and without macropores. Soil Science Society of America Journal, 64(4), 1305-1317. doi: 10.2136/sssaj2000.6441305x
Washburn, E. W. (1921). Note on a method of determining the distribution of pore sizes in a porous material. Proceedings of the National Academy of Sciences of the United States of America, 7(4), 115-116.
Author notes
vgodoy@sc.usp.br