Ciência, Tecnologia de Alimentos e Engenharia de Alimentos
Antioxidant compounds extraction from coffee husks: the influence of solvent type and ultrasound exposure time
Antioxidant compounds extraction from coffee husks: the influence of solvent type and ultrasound exposure time
Acta Scientiarum. Technology, vol. 41, 2019
Universidade Estadual de Maringá
Received: 27 March 2017
Accepted: 11 September 2018
Abstract: Coffee husk can be removed from the grain mainly by two different ways: the wet method and the dry method. Aiming to add value to the by-products of the coffee agroindustry, we analyzed the antioxidant properties of hydroalcoholic extracts of coffee husks obtained from the two different methods. The production of the extract followed a rotational central composite design, varying the ethanol proportion and the ultrasound exposure time in between. The results of the experimental planning were: extract volume yield; total phenolic compound and antioxidant activity expressed by the DPPH and FRAP methods. Mathematical models were constructed using the significant parameters for each response, and its predictive capacity was evaluated through an analysis of variance of the regression. Better results were found in extracts from husk obtained by the dry method using solvent in a proportion of 40-50% (v v-1) ethanol to 40-60 min. of ultrasound exposure.
Keywords: hydroalcoholic extract, antioxidant activity, DPPH, FRAP, by-product.
Introduction
Coffee stands out as the most relevant agricultural product in Brazil, responsible for 32% of the world production (Companhia Nacional de Abastecimento [Conab], 2014). The coffee fruit reaches its maturity peak at the ‘cherry’ state, and contains the highest amount of all its components and thus producing coffee beans with the perfect chemical composition for all the necessary physical-chemical reactions to occur in the roasting process in order to achieve the desirable sensory characteristics, namely aroma, flavor, acidity, bitterness, body and sweetness, ultimately satisfying the demand for high quality drinking coffee (Giomo, 2012).
After harvesting, coffee can be subjected to dry or wet processing methods. In the case of wet method, coffee beans are initially washed to hydraulically separate fractions of different density. The lightest fraction, consisting of the mixture of dry and crumpled fruits, is separated and goes straight into the drying patio. The heaviest fraction, consisting of the mixture of cherry and green fruits, goes into the peeler-separator for the mechanical separation of the green fruits. Because their husk is harder, the green fruits do not break under the influence of the peeler and they are directed to the lateral exits of the equipment, while the ripe fruits are cut, screened and directed to the complementary peeler for peel separation. In this method, the fruit peel is mechanically removed, being the final result the parchment coffee.
The dry method is the most often used in Brazil. It involves drying the whole fruits, including husk, mucilage, parchment and bean, in a patio or in a mechanical dryer. The drying process can happen mechanically at 60°C and/or by sun exposure in patios. It is the process that less affects the natural condition of the coffee, because all the constituting parts are kept. The pulp is the residue from the wet pulping of the cherry coffee, composed of exocarp (skin), part of the mesocarp (mucilage) and vascular bundles. The dried husk differs from the pulp due to the presence of the parchment, which remains around the coffee bean as a protection during the wet process (Barcelos, Paiva, Perez, Santos, & Cardoso, 2002).
In arabica coffee, pulp represents about 40% of the fresh weight in the cherry maturation state (Calzada et al., 1984). The organic compounds found in coffee pulp include tannins, about 1.80-8.56%, pectic substances, averaging 6.5, 12.4 reducing sugars, 2.0 non-reducing sugars, 1.3 caffein, 2.6 chlorogenic acid and 1.6% caffeic acid (Murthy & Naidu, 2012). This residue includes also crude fiber (15.10%), protein (8.25%) and ash (8.12%) (Borém, 2008). Apart from being used as fertilizers and energetic source, these by-products have been a target of research because they contain antioxidant substances, including caffeic, tannic, vanillic, chlorogenic and gallic acids (Esquivel & Jiménez, 2012).
The antioxidant potential of bioactive compounds in food of plant origin depends on its structure and concentration in the food. Besides from the ripeness degree and plant variety, environmental and genetic factors also have a strong influence on the amount of these substances in plants. However, the antioxidant capacity is influenced by the substrate used in the test, by the solvent and the method applied, as well as by the duration time and temperature set in the extraction (Naczk & Shahidi, 2004).
The conventional extraction using solvents of different polarity is being optimized when subjected to the ultrasound application. The ultrasound produces high quantities of energy, which are transferred to the medium, causing changes in a specific process or product. These changes can be considered as physical, chemical or mechanical in nature and allow the ultrasound use to enhance a diversity of processes like cleaning, drying, filtering, microorganisms and enzymes inactivation and bioactive compounds extraction (Gallego-Juárez, 1999).
As a way to reduce the environmental impact and to add value to the residues, our objective was the evaluation of antioxidant properties in hydroalcoholic extracts obtained from husks derived from the wet method coffee processing (WMC) and dry method coffee processing (DMC). The ethanol proportion has varied between 41 and 98%. An experimental planning was used in order to analyze the ultrasound exposure times for each solvent composition. The antioxidant potential of the extracts was evaluated in relation to the total phenolic content and antioxidant activity by DPPH free radical scavenging and ferric reducing power (FRAP).
Material and methods
Obtaining and preparing the raw material
Approximately 3 kg arabica coffee husks (Coffea arabica) resulting from wet and dry processing methods were collected at local producers in Poços de Caldas, State of Minas Gerais, Brazil, latitude 21° 44’ 19” S and longitude 46° 26’ 23” W, during the harvest of 2015. The husks were lyophilized to reach the same degree of moisture, avoiding the water content interference. To achieve this, a freeze dryer was used (model L-101, Liotop, São Carlos, State of São Paulo, Brazil) at an approximate pressure of 200 µm Hg and temperature of -50ºC. After lyophilization, the husks were then ground with the aid of a domestic blender and stored until use in hermetically sealed containers wrapped with aluminum foil.
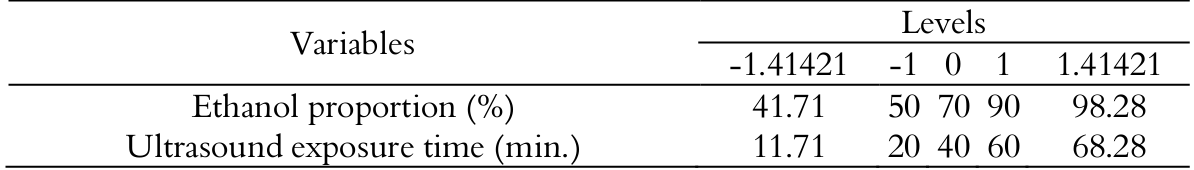
To obtain the extracts, the proportion of husks: solvent was set at 1:5 (m v-1), containing different ethanolic concentrations (Table 1). These proportions were used in such a way that the solvent volume was enough to promote agitation and mixing in the system. After adding the solvent to the husks, the material was shaken at 14.000 rpm for 2 minutes in an ultra-turrax (model T25, Ika, Staufen, Germany) with the aid of a model S25N probe. Next, the material was put in an ultrasonic bath (model 740D, Ultrasonic Cleaner, Ribeirão Preto, State of São Paulo, Brazil) in ice bath for different times of application, as Table 1.
After the ultrasound application, the material was centrifuged (model 206 MP, Excelsa® II, São Paulo, Brazil) at 3500 rpm for 10 min. The supernatant was filtered through a Whatman #4 paper filter to remove any impurities. The volume of the filtered material was measured to calculate the output of the produced extract. The volume yield was expressed in percentage. Subsequently, the extract was stored in amber flasks and frozen at -18ºC.
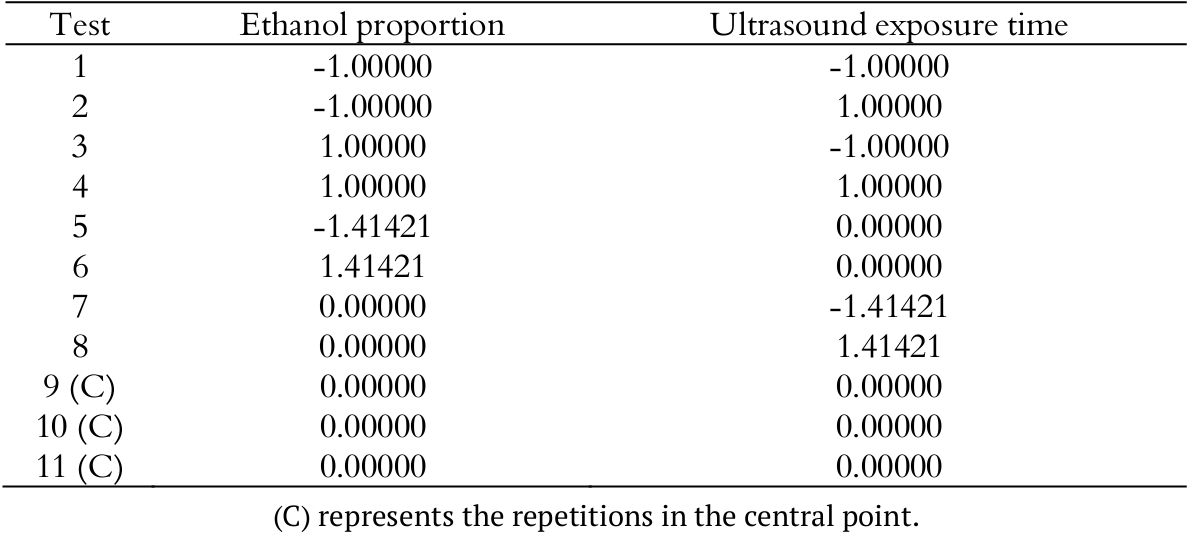
The procedure to extract antioxidant compounds was carried out following a 22 rotational central composite design (RCCD), varying these factors: ultrasound exposure time and ethanol proportion. The experimental planning for each husk type resulted in 11 tests, presented in Table 2.
Total phenolic compounds
The concentration of total phenolic compounds for the different tests was determined by the spectrophotometric method, using the Folin-Ciocalteu reagent. The methodology proposed by Singleton, Orthofer, and Lamuela-Raventós (1999) is based on the addition of 500 µL of the sample in 2.5 mL Folin-Ciocalteu reagent diluted in distilled water (1:10, v v-1). Together with these solutions, 2.0 mL sodium carbonate were added to make the solution alkaline. The test tubes were left to rest in the dark. After 2 hours, readings were made at 765 nm in a spectrophotometer (model UV mini-1240, Shimadzu, Chiyoda-ku, Japan).
To quantify the concentration of total phenolic compounds, a standard curve was designed using gallic acid (GA) in concentrations ranging from 0 to 500 mg L-1. The coefficient of determination of the analytical calibration curve was R2 = 0.9999. The total phenolic concentrations were expressed in milliequivalents of GA g-1 of dry material (meq GA g-1).
DPPH radical scavenging
The analysis followed the method proposed by Brand-Williams, Cuvelier, and Berset (1995), preparing an ethanolic solution of DPPH (2,2-diphenyl-1-picrylhydrazyl) at 6×10⁻⁵ M and Trolox ethanolic solutions (6-hydroxy-2,5,7,8-tetramethylchroman-2-carboxylic acid), which were used in the standard curve.
During the procedures, 100 µL diluted sample were pipetted into 2.9 mL of the DPPH solution in an amber test tube. The absorbance of the samples was read at 515 nm in a spectrophotometer (model UV mini-1240, Shimadzu, Chiyoda-ku, Japan) after 25 min. of reaction away from the light.
The Trolox solutions used in the standard curve varied between 0.19 and 0.93 mM, and the coefficient of determination of the curve was R2 = 0.9996. The antioxidant activity was expressed in milliequivalents of Trolox g-1 of dry material.
Antioxidant activity by ferric reducing power - FRAP
The antioxidant activity by ferric ion reduction was determined with a spectrophotometer (model UV mini-1240, Shimadzu, Chiyoda-ku, Japan), according to the methodology previously described by Benzie and Strain (1996), with modifications, using a calibration curve of Trolox solution, in which the coefficient was R2 = 0.9997.
In test tubes were added with 90 µL extract, 270 μL distilled water and 2.7 mL FRAP reagent (750 mL of 0.3 M acetate buffer, 75 mL of TPTZ 10 mM solution and 75 mL of 20 mM ferric chloride). After homogenization, the tubes were placed in a water bath at 37ºC. The readings were made after 30 min. at 595 nm and the results were expressed in milliequivalents of Trolox g-1 of dry material.
Statistical analysis
For each response, a table was designed with the estimated effects of each significant variable (α = 0.05), differing in a linear (L) or squared (S) way. In addition, an analysis of variance (ANOVA) was applied to verify the predictability of the mathematical model achieved through the STATISTICA 10 program (StatSoft Inc, Tulsa, USA).
Results and discussion
The results obtained in each test for the extraction performance, total phenolic compounds concentration (TP) and antioxidant activity by DPPH and FRAP methods, are listed in Table 3. The evaluation of the estimated effects and the analysis of variance of the regressions obtained for each performance have shown that the equations were significant (Fcalc > Ftab), while the lack of fit had no significant influence (Fcalc < Ftab). Table 4 presents the regression coefficients for each performance on the experimental planning on DMC and WMC.
Volume yield
Although some extracts obtained from WMC have shown high performance, the best volume yield was observed in DMC. A possible explanation for such difference is the swelling degree in WMC. As it absorbs more water than DMC, it also promotes a reduction of the available extract volume.
Response surface and contour graphics for the volume yield of husk extract were illustrated in Figure 1. Both linear and quadratic terms of ethanol proportion showed significant influence on volume yield of WMC extracts, while the ultrasound exposure time had significant quadratic effect on the volume yield but the magnitude of this effect was not relevant to the predictive equation. As for DMC, it is clear that the shorter ultrasound exposure time and higher ethanol extract percentage, higher is also the volume yield.
Possibly, ethanol has a weaker capacity of adsorbing into the solid matrix, remaining more available in the extract. On the other hand, ultrasound promotes the solvent penetration into the husk structure, making it less available.
Total phenolic compounds
The extracts obtained from DMC with a lower proportion of ethanol presented the highest content of total phenolic compounds. Figure 2 shows the influence of solvent and ultrasound exposure time on the phenolic compounds extraction for the husks obtained by the two processing methods.
The highest concentration of phenolic compounds was found in DMC, 9.93 meq GA g-1, in a 40% (v v-1) ethanol extract and intermediate ultrasound exposure time. It was also possible to verify that the lower the ethanol proportion (between 40 and 50%), the better is the total phenolic extraction process. This is attributed to the difference in polarities of the solvents used (water and ethanol), which can extract both the polar compounds and the less polar ones. In accordance with Esquivel and Jiménez (2012), chlorogenic acid corresponds to 42.2% of the total phenolic compounds identified by HPLC in coffee pulp. Thus, the total phenolic content extracted in this study is probably due to the higher concentration of chlorogenic acid present in the chemical nature of the coffee husks, which is a water-soluble phenolic compound and has been reported to present antioxidant properties (Sato et al., 2011; Rodrigues & Bragagnolo, 2013).
Analyzing coffee residues, Baggio, Lima, Mancini, and Fett (2007) also reported similar values to the ones found in the present study, detecting a variation of total phenolic content between 1.39 and 8.08 meq GA g-1 of dry material. However, Murthy and Naidu (2012) registered higher values for coffee by-products extracted with mixtures of isopropanol and water. The total phenolic contents reported by the authors were 1.48% (w w-1) for coffee pulp, 1.22% (w w-1) and 1.32% (w w-1) for cherry husk and silver skin, respectively.
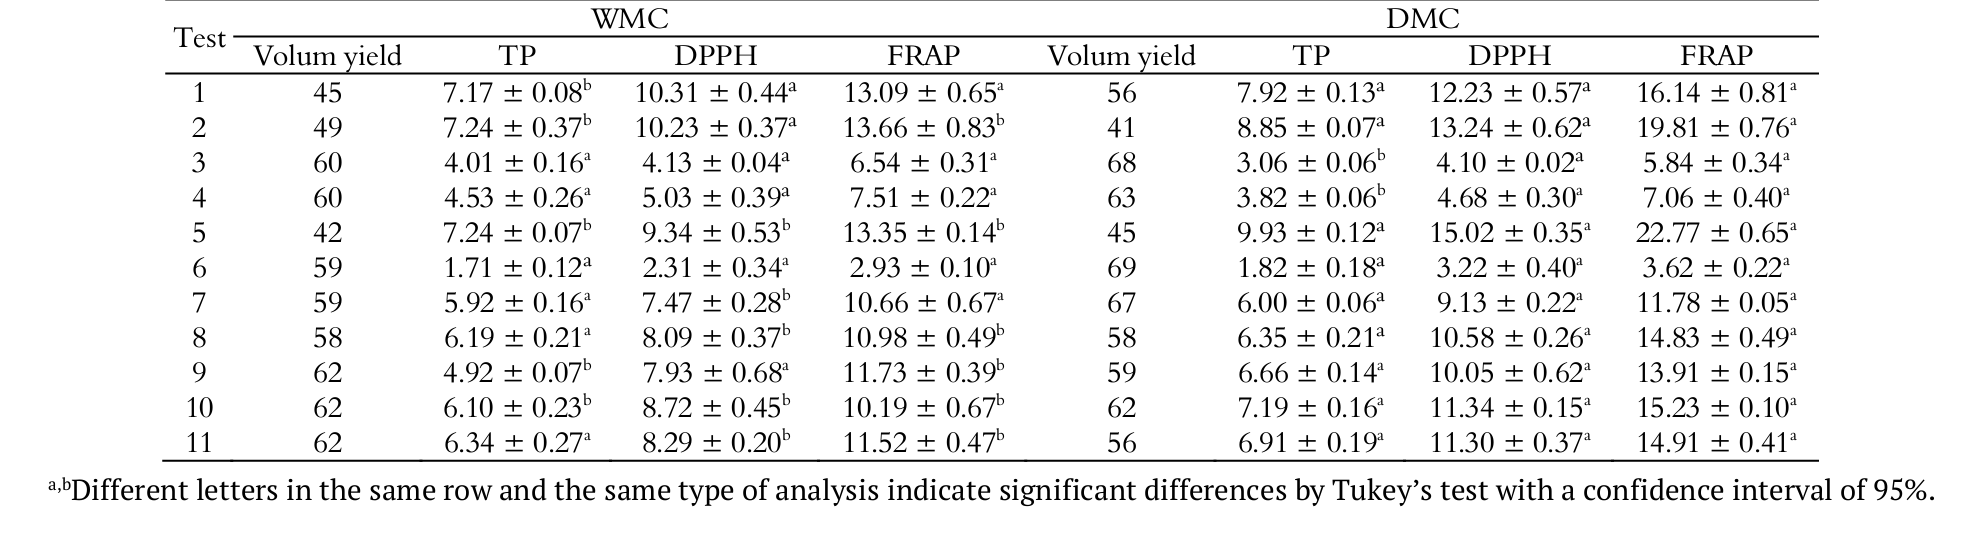
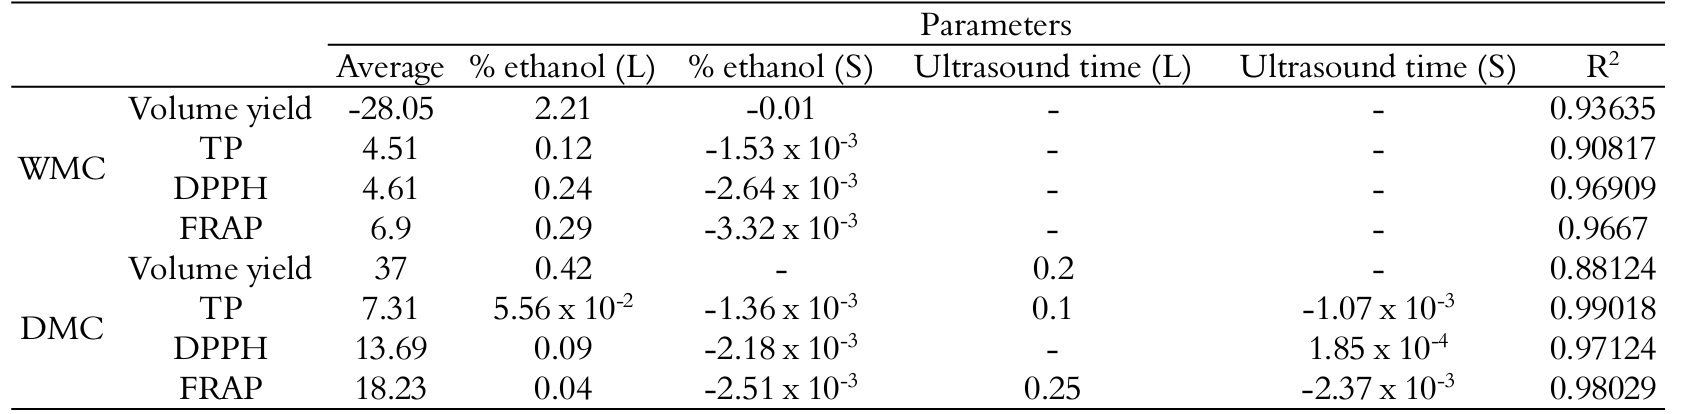
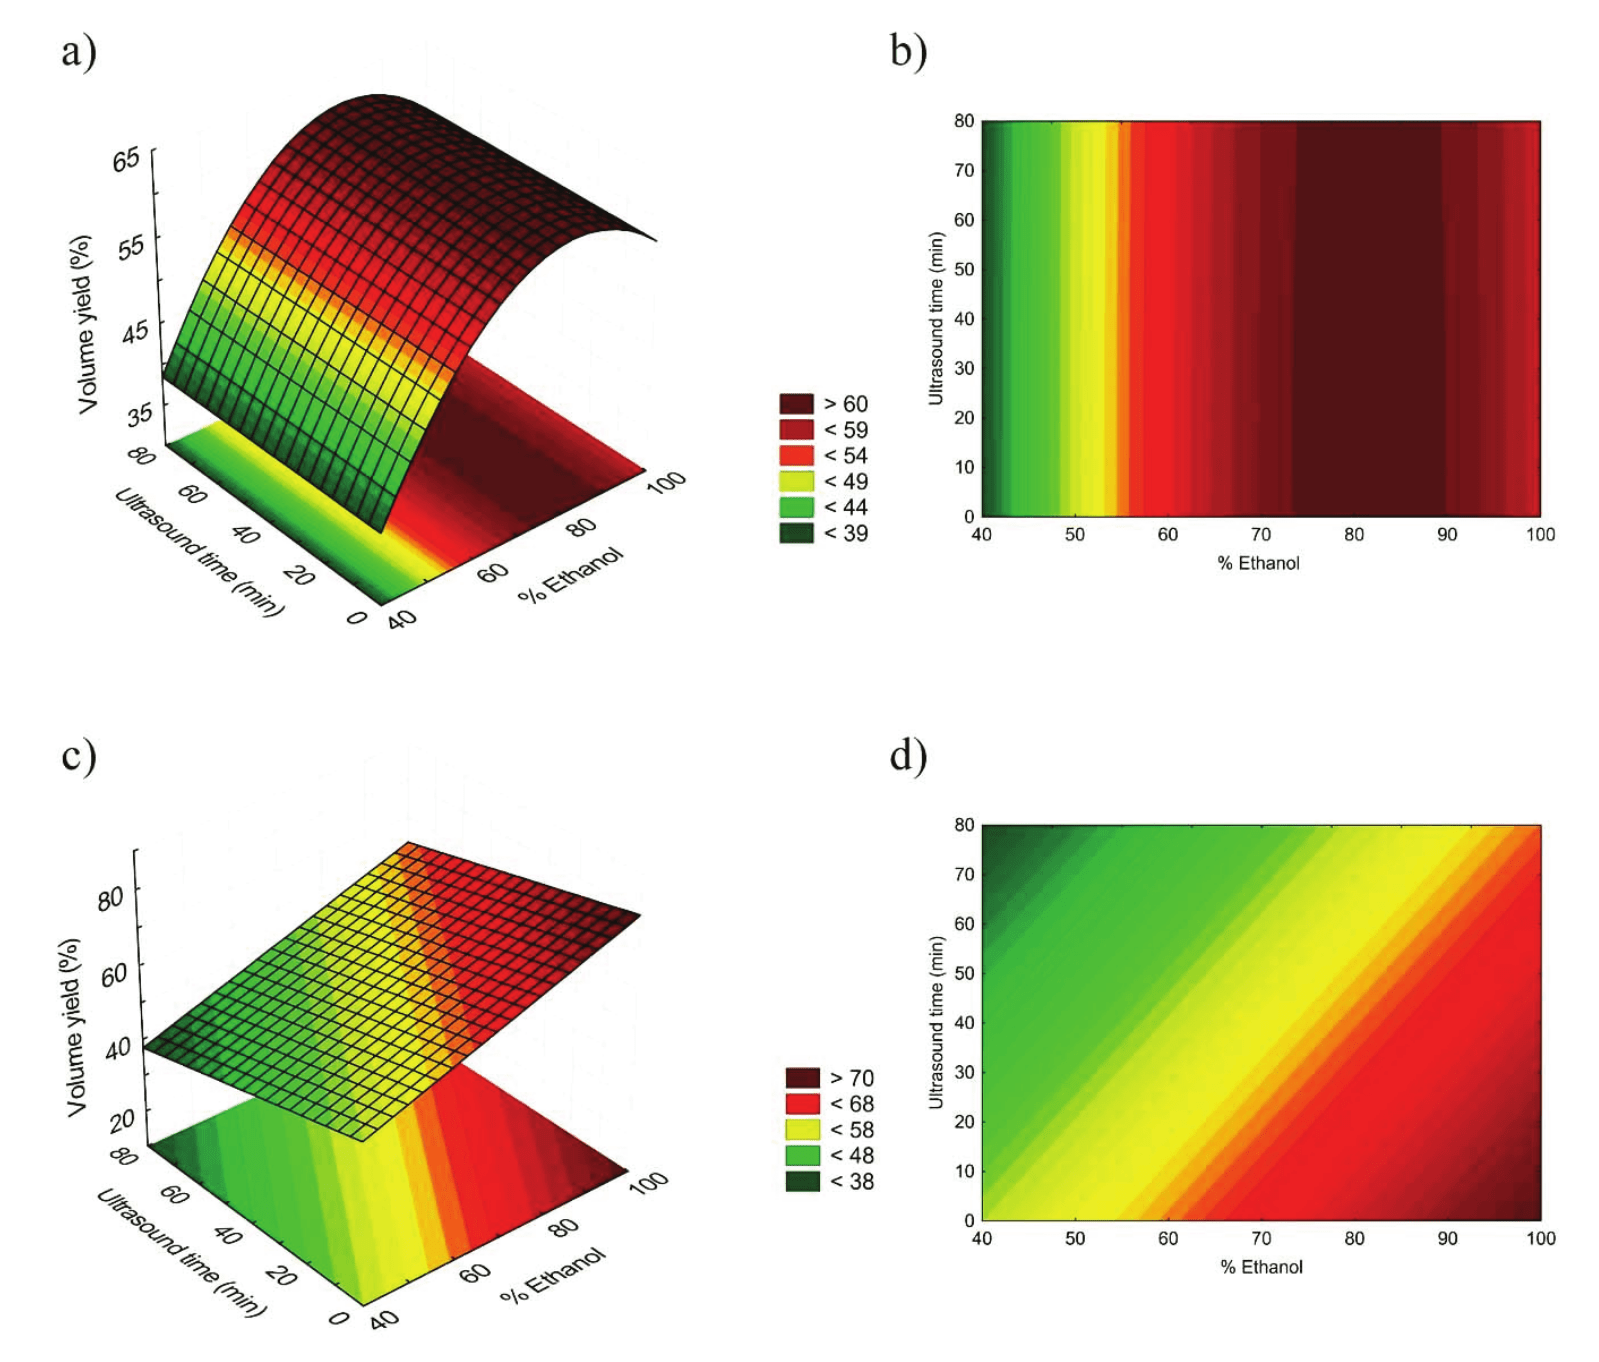
Figure 1.
Response surfaces and contour graphic for WMC (a, b) and DMC (c, d) extract volume yield.
The ultrasound application was also analyzed by Wang, Sun, Cao, Tian, and Li (2008) in order to optimize phenolic compound extraction from wheat bran, in relation to the ethanol proportion (50-70%; v v-1) and application time (15-25 min.). In that study, the highest content of total phenolics (2.99 meq GA g-1) was found in extract containing 60% (v v-1) ethanol subjected to 29 min. of extraction. The shorter time of extraction (11 min.) resulted in a lower amount of phenolics extracted in the same solvent condition (60% of ethanol; v v-1); with an observation in this case that the ultrasound application was a parameter more significant than the ethanol proportion. In a study about the antioxidant activity of agroindustry residues, Melo et al. (2011) evaluated the extraction method, using ethanol and water solvents. In that study, the ethanolic solvent was more effective extracting total phenolic compounds, obtaining concentrations of 3.41 meq GA g-1 in guava pulp and values between 21.45 and 40.79 meq GA g-1 in grape marc.
With ultrasound exposure times ranging between 30 and 60 min., the phenolics extraction is optimized when using DMC. The application of ultrasound generates compression and decompression zones in the liquid, promoting the so-called ‘sponge effect’ (Gallego-Juárez, 1999). This effect in shorter periods of ultrasound exposure is not enough to lead to the extraction of phenolic compounds from the solid matrix. In time periods longer than 60 min., the cavitation process provoked by the ultrasound application can occasionally result in the degradation of compounds susceptible to temperature variations caused by hot spots (Mason & Cordemans, 1996).
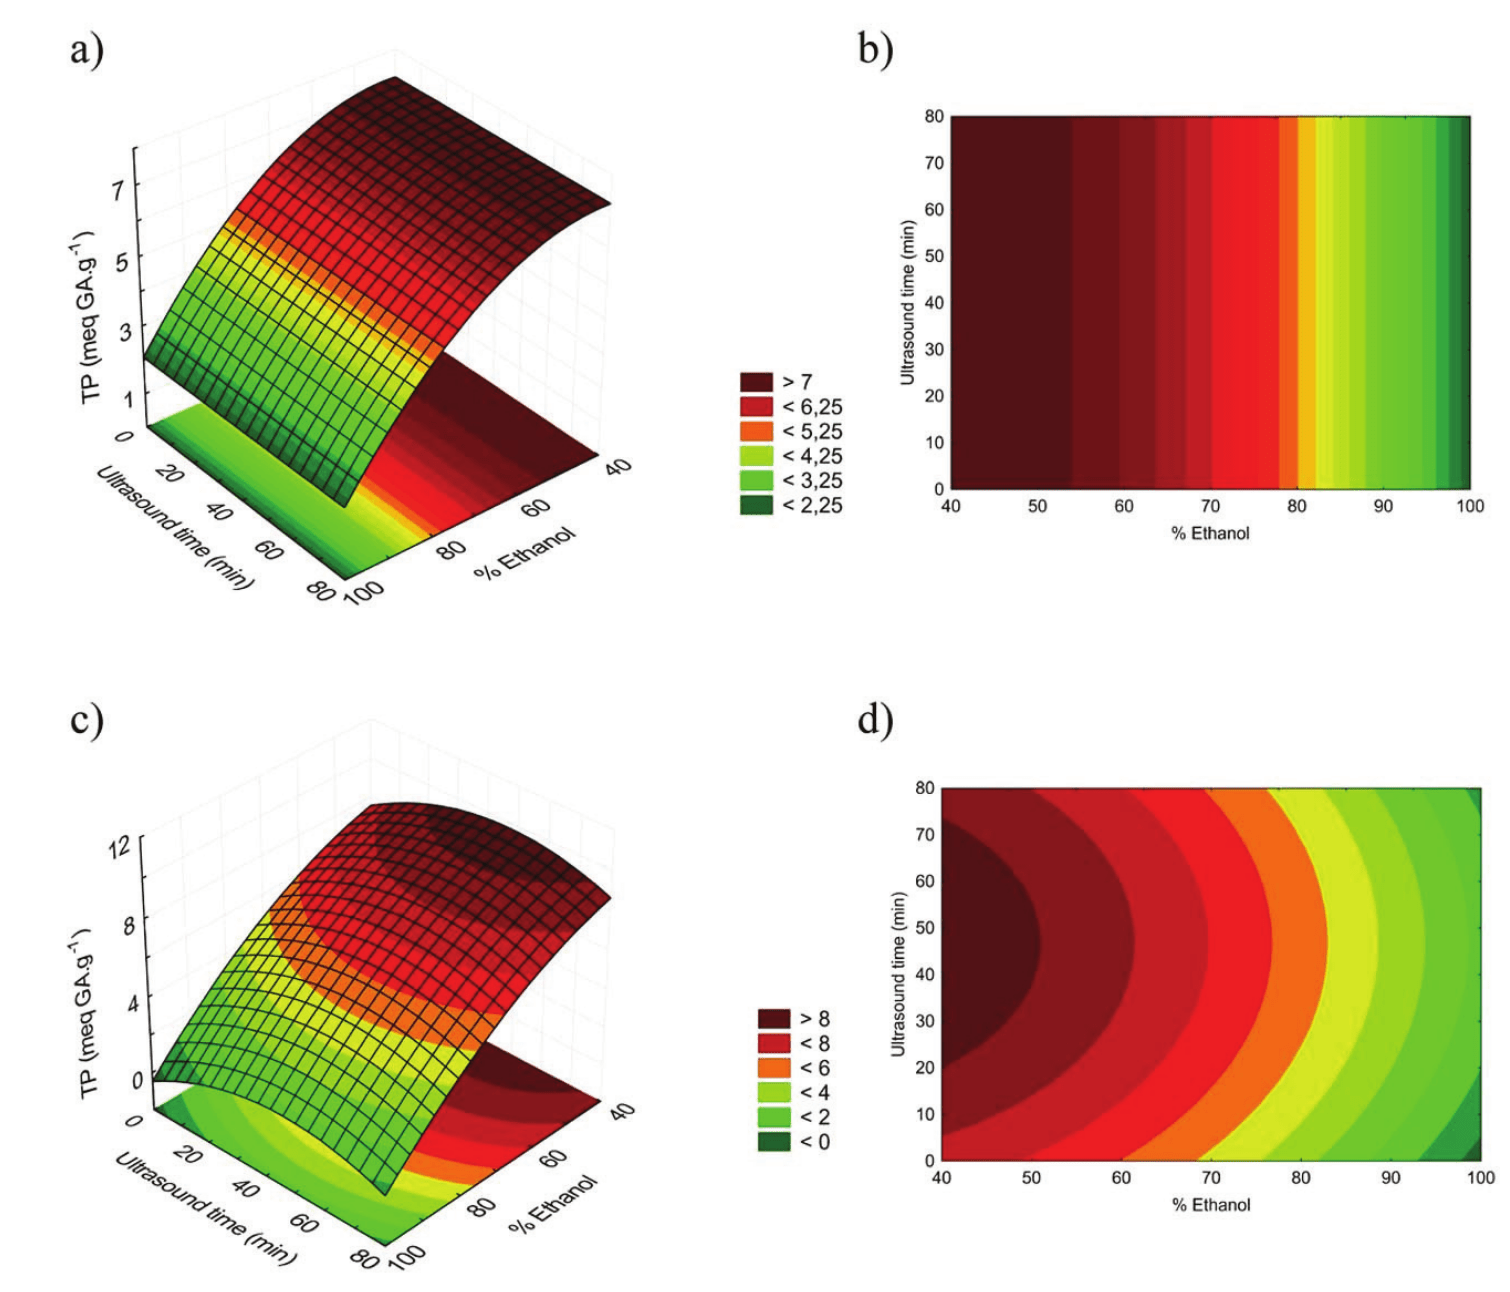
Figure 2.
Response surfaces and contour graphics for total phenolic extracts from WMC (a, b) and DMC (c, d).
Figure 2 shows that, in relation to WMC, distinctly from extracts of husks previously processed at high temperatures, the application of ultrasound was not a significant parameter (p > 0.05). Due to the fact that the coffee husks were lyophilized before the extract production, it can have more active structural points to adsorb the water. In this way, the wetting degree of the structures has increased and therefore the viscosity of the medium subjected to the ultrasound was reduced. It is known that when the viscosity of the medium is high, the cavitation effects are weaker (Sanderson, 2004).
Antioxidant activity by DPPH● radical scavenging
Similar to the total phenolic compounds analysis, the highest values of antioxidant activity, 15.02 meq Trolox g-1 of dry material, was found in the extract of DMC. As shown in Figure 3, in both types of husks, the extracts with proportions of ethanol between 40 and 50% (v v-1) were the most efficient for the antioxidant activity. In relation to the ultrasound application, we observed that the longer time of exposure, higher were the results obtained in the DPPH analysis of DMC. On the other hand, the antioxidant activity in extracts of WMC suffered no influence from the ultrasound exposure times.
Antioxidant activity by ferric reducing power - FRAP
The antioxidant potential evaluated by ferric ion reducing method has shown superior results in DMC, as seen in Figure 4. Similar to the observed in total phenolic compounds and antioxidant activity by DPPH method analysis, the highest concentration in FRAP analysis was found in the extract with the lowest volume of ethanol (40-50%) and an intermediate ultrasound exposure time, resulting in 22.77 meq Trolox g-1 of dry material. The efficiency of the reducing power is also higher in an ultrasound exposure time between 40 and 60 min. on DMC, noting that the ultrasound exposure time was not a significant parameter in the WMC extract.
In a study on the antioxidant capability of passion fruit husk, Cazarin, Silva, Colomeu, Zollner, and Maróstica (2014) found values between 8.73 and 9.15 meq Trolox g-1 sample, in ethanolic and aqueous extracts respectively, which correspond to values inferior to those found in DMC extracts obtained with a lower proportion of ethanol in our study.
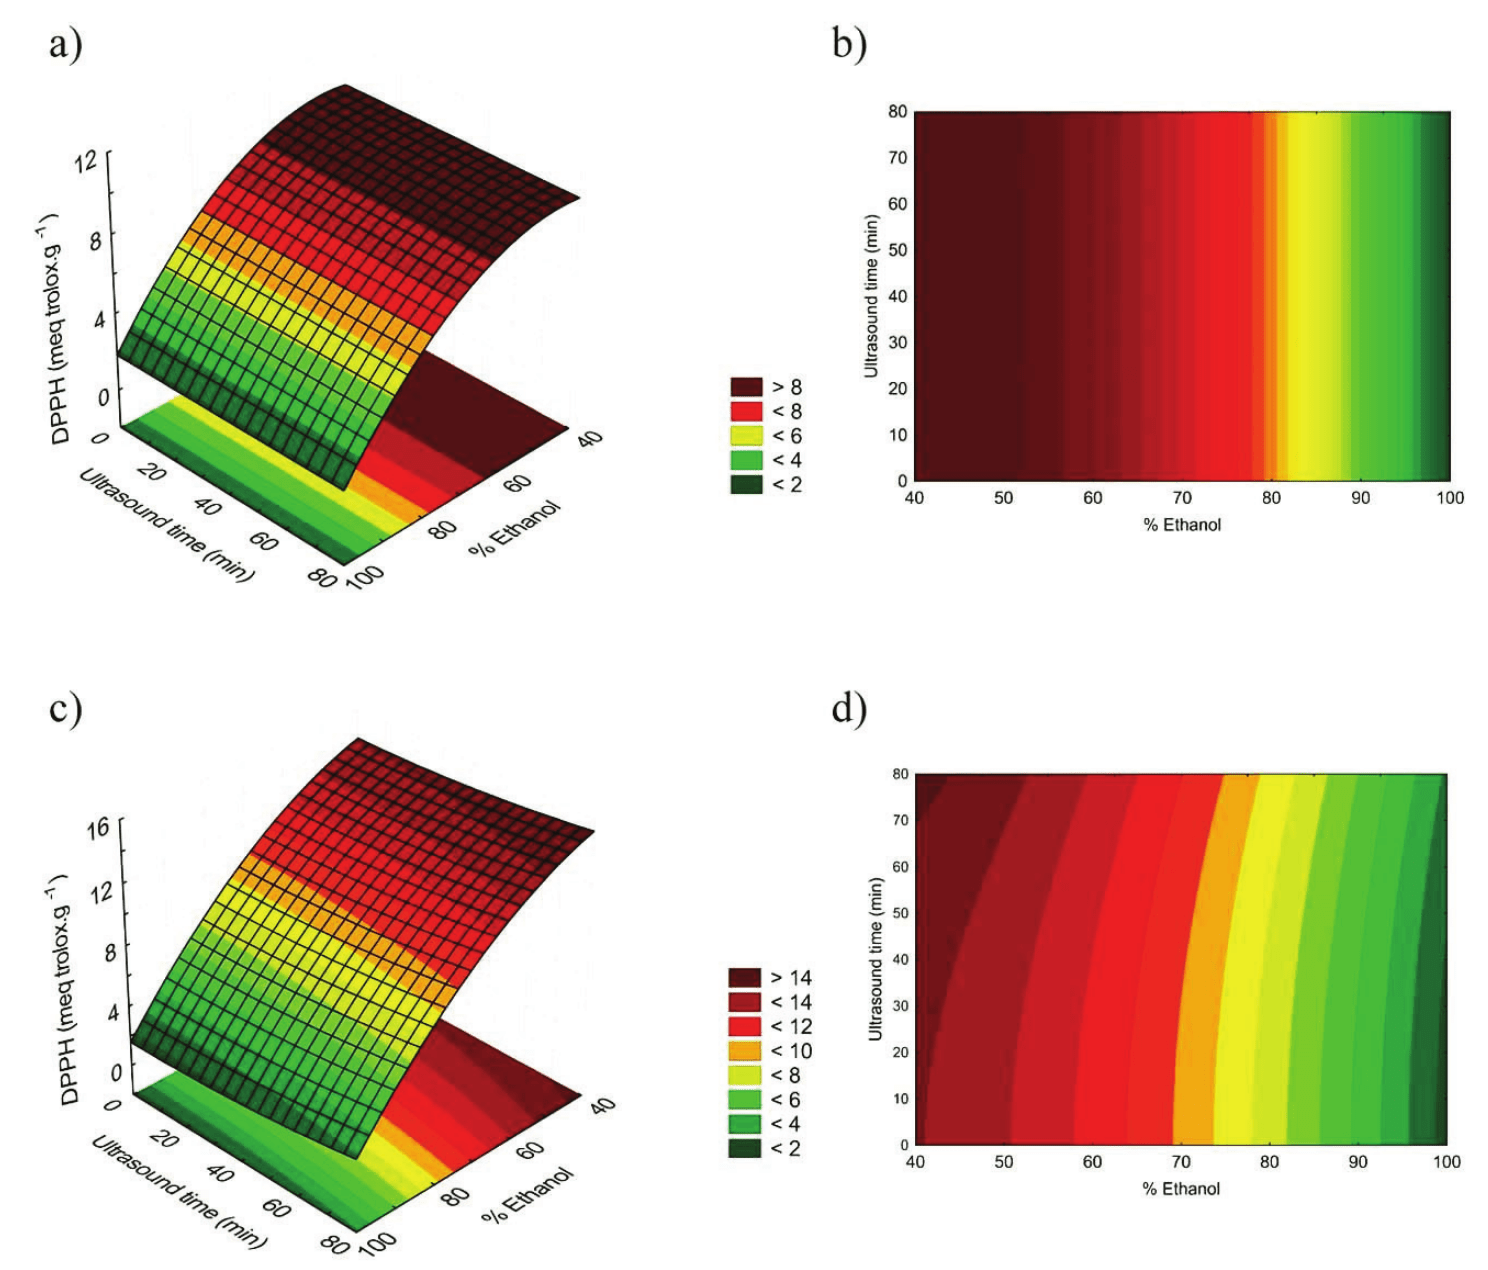
Figure 3.
Response surfaces and contour graphics for DPPH with WMC (a, b) and DMC (c, d) extracts.
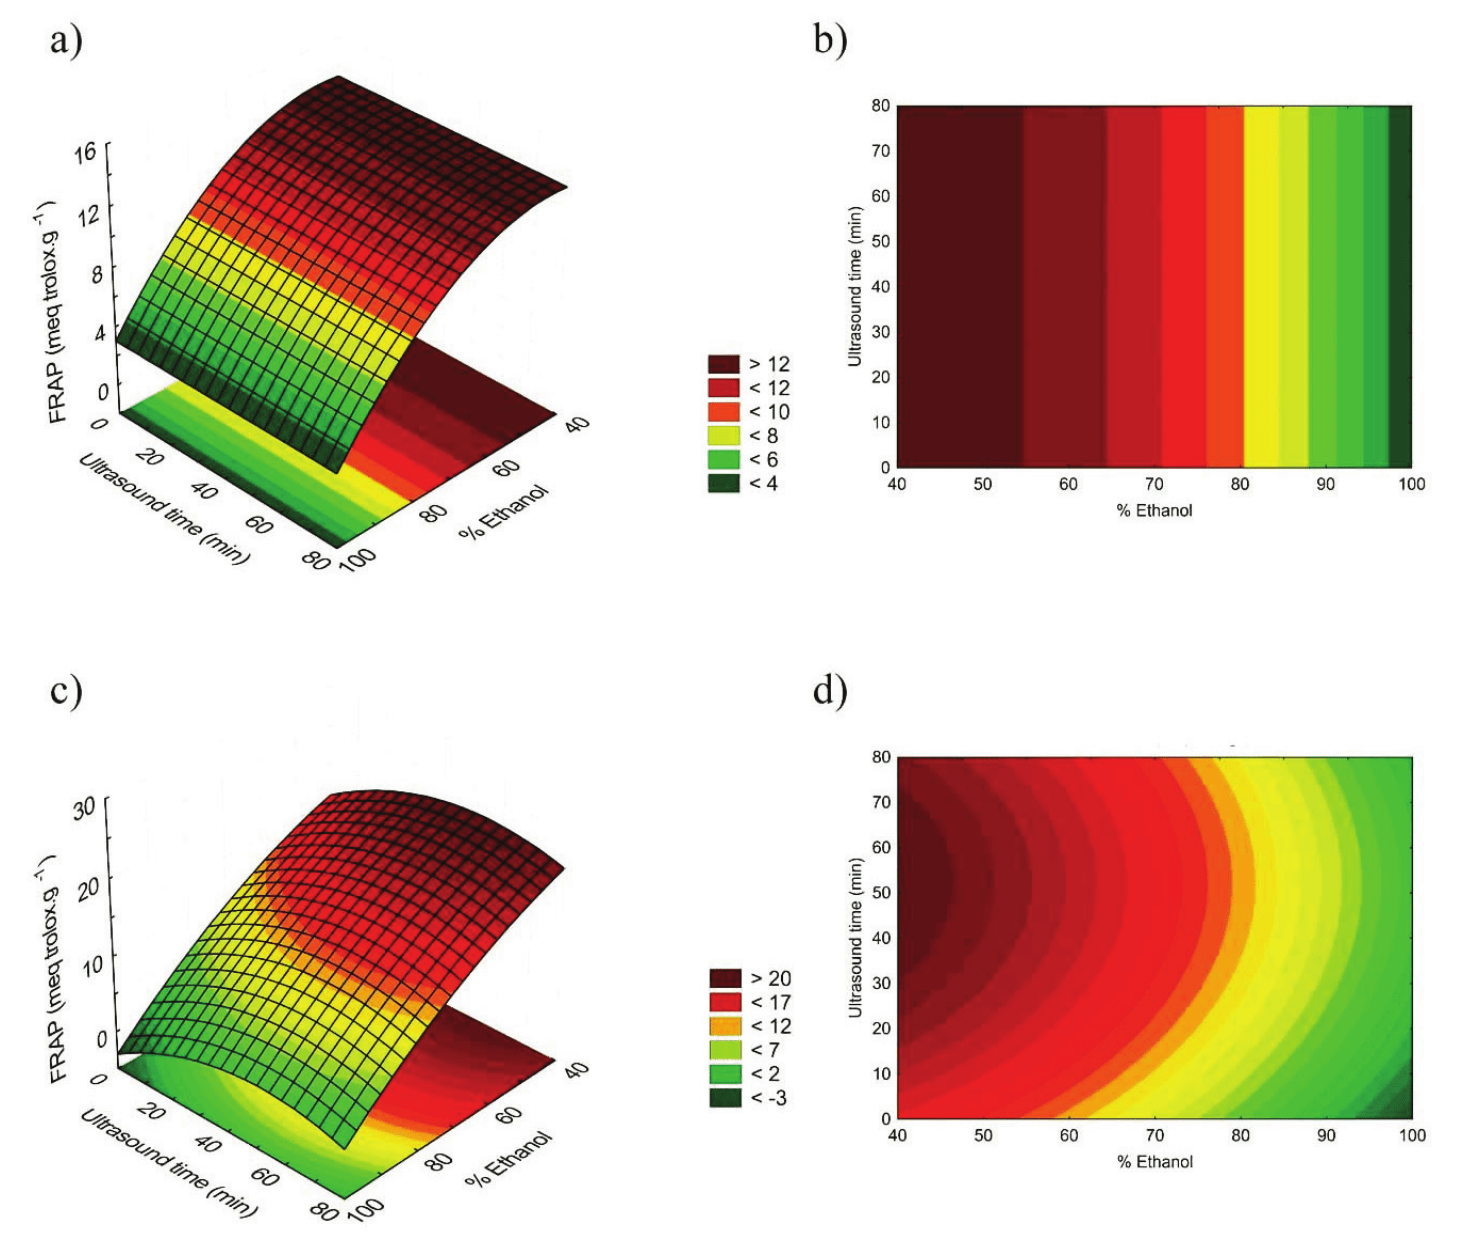
Figure 4.
Response surfaces and contour graphics for FRAP with WMC (a, b) and DMC (c, d).
Hossain et al. (2012) evaluated the antioxidant potential with the FRAP method in methanolic extracts of marjoram and observed the influence of ultrasound exposure time on the extraction. In that study, they obtained higher concentrations, varying between 136.8 and 170.8 meq Trolox g-1 dry material for 10 minutes of application. This system yielded extracts with higher antioxidant activity in comparison to those derived from conventional solid/liquid extraction (90.0 meq Trolox g-1 dry material).
The fact that extracts from husks processed at higher temperatures, in dryers at 60°C, have presented a higher concentration of total phenolic compounds and a higher antioxidant potential than those obtained via wet process, is possibly due to the occurrence of the Maillard reaction. In this reaction, occurring at temperatures above 40°C (Ajandouz & Puigserver, 1999; Shibao & Bastos, 2011), the reducing sugars and amino acids present in the husk react with each other, forming compounds with antioxidant activity (Budryn et al., 2009).
Additionally, unlike the wet processing method, in the dry method, the parchment and the mucilage separate from the coffee bean (Borém, 2008). These differences between the components can also contribute to higher concentrations with the dry husks.
Relation between analysis
Assessing structural characteristics of the phenolic compounds, a high free radical reducing potential has been attributed to these substances. The antioxidant properties of the phenolic content in coffee husks were determined through specific analysis like FRAP and DPPH. In light of this, for each type of husk, graphics were generated to demonstrate the correlation between total phenolic content and the methodologies used to assess the antioxidant activity.
Figure 5a shows that WMC presented correlations between methods, with r = 0.9558 and r = 0.9546 for DPPH and FRAP, respectively.
In DMC, Figure 5b, the analyses made for antioxidant activities correlated in a linear way with the total phenolic concentration, with r = 0.9890 for the DPPH method and r = 0.9917 for FRAP. This type of correlation confirms the reports of Dudonné, Vitrac, Coutière, Woillez, & Mérillon, (2009).
Although the parameters used to obtain the extracts have affected WMC in a minor degree, the antioxidant activity analysis presented a positive and significant correlation with the concentration of phenolics, since the higher the phenolic compounds content, the higher are the antioxidant activities.
Conclusion
Coffee by-products as raw material for antioxidant compound extraction are promising. Ultrasound application significantly influenced the process of phenolic compounds extraction from husk obtained by dry method. The extracts presented higher potential when subjected to ultrasound exposure times between 40 and 60 min., since longer extraction time periods can lead to the degradation of sensitive compounds. In this way, extract from husks using the dry method consisting of 50% ethanol (v v-1), with 40 min. of ultrasound exposure time, allows for a high er performance, higher phenolic compounds concentration, and high antioxidant activity, while savings in time, energy and economic costs.
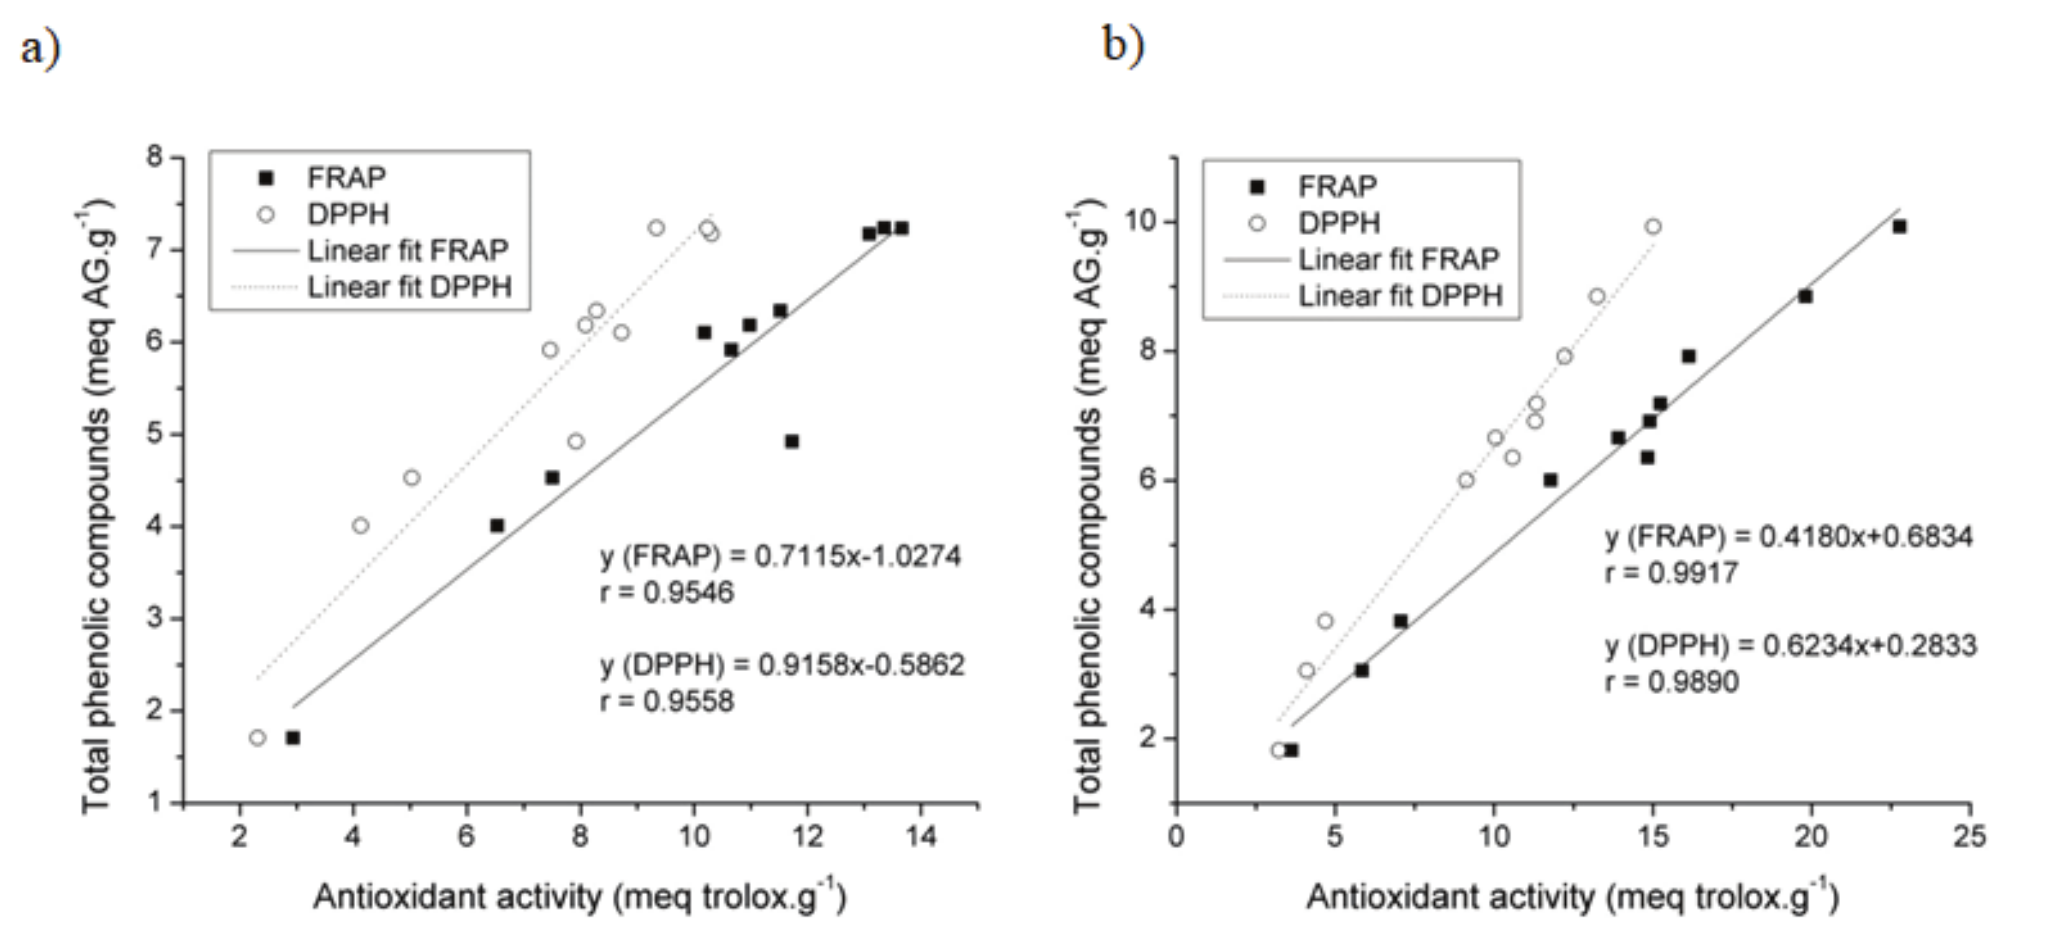
Figure 5.
Correlation between the analysis of total phenolic compounds (TP) and antioxidant activity (DPPH and FRAP) in WMC (a) and DMC extracts (b).
Acknowledgements
The authors would like to express their sincerest gratitude for the financial support provided by the National Council for Technological and Scientific Development and Coordination for the Improvement of Higher Education Personnel.
References
Ajandouz, E. H., & Puigserver, A. (1999). Nonenzymatic Browning reaction of essential amino acids: effect of pH on caramelization and maillard reaction kinetics. Journal of Agricultural and Food Chemistry, 47(5), 1786-1793. doi: 10.1021/jf980928z
Baggio, J., Lima, A., Mancini, F. J., & Fett, R. (2007). Identification of phenolic acids in coffee (Coffea arabica L.) dust and its antioxidant activity. Italian Journal of Food Science, 19(2), 193-203.
Barcelos, A. F., Paiva, P. C. A., Perez, J. R. O., Santos, V. B., & Cardoso, R. M. (2002). Parâmetros bromatológicos da casca e polpa desidratada de café (Coffea arabica L.) armazenadas em diferentes períodos. Ciência e Agrotecnologia, 26(4), 780-790. doi: 10.17523/bia.v70n3p206
Benzie, I. F. F., & Strain, J. J. (1996). The ferric reducing ability of plasma (FRAP) as a measure of ‘antioxidant power’: the FRAP assay. Analytcal Biochemistry, 239(1), 70-76. doi: 10.1006/abio.1996.0292
Borém, F. M. (2008). Pós-colheita do café. Lavras, MG: UFLA.
Brand-Williams, W., Cuvelier, M. E., & Berset, C. (1995). Use of a free radical method to evaluate antioxidant activity. LWT - Food Science and Technology, 28(1), 25-30. doi: 10.1016/S0023-6438(95)80008-5
Budryn, G., Nebesny, E., Podsędek, A., Żyżelewicz, D., Materska, M., Jankowski, S., & Janda, B. (2009). Effect of different extraction methods on the recovery of chlorogenic acids, caffeine and Maillard reaction products in coffee beans. European Food Research and Technolology, 228(6), 913-922. doi: 10.1007/s00217-008-1004-x
Calzada, J. F., Porres, E., Yurrita, A., Arriola, M. C., Micheo, F., Rolz, C. Y., ... Cabella, A. (1984). Biogas production from coffee pulp juice: One-and two-phase systems. Agricultural Wastes, 9(3), 217-230. doi: 10.1016/0141-4607(84)90081-7
Cazarin, C. B. B., Silva, J. K., Colomeu, T. C., Zollner, R. L., & Maróstica, J. M. R. (2014). Capacidade antioxidante e composição química da casca de maracujá (Passiflora edulis). Ciência Rural, 44(9), 1699-1704. doi: 10.1590/0103-8478cr20131437
Companhia Nacional de Abastecimento [Conab]. (2014). Acompanhamento da safra brasileira de café, safra 2014, quarto levantamento. Brasília, DF: Conab.
Dudonné, S., Vitrac, X., Coutière, P., Woillez, M., & Mérillon, J. M. (2009). Comparative study of antioxidant properties and total phenolic content of 30 plant extracts of industrial interest using DPPH, ABTS, FRAP, SOD, and ORAC assays. Journal of Agricultural and Food Chemistry, 57(5), 1768-1774. doi: 10.1021/jf803011r
Esquivel, P., & Jiménez, V. M. (2012). Functional properties of coffee and coffee by-products. Food Research International, 46(2), 488-495. doi: 10.1016/j.foodres.2011.05.028
Gallego-Juárez, J. A. (1999). Some applications of air-borne power ultrasound to food processing. In M. J. W. Povey & T. J. Mason (Eds.), Ultrasound in food processing (p. 127-143). London, GB: Chapman & Hall.
Giomo, G. S. (2012). Uma pós-colheita é segredo da qualidade (p. 12-21). Rio de Janeiro, RJ: A Lavoura.
Hossain, M. B., Brunton, N. P., Patras, A., Tiwari, B., O’Donnell, C. P., Martin-Diana, A. B., & Barry-Ryan, C. (2012). Optimization of ultrasound assisted extraction of antioxidant compounds from marjoram (Origanum majorana L.) using response surface methodology. Ultrasonics Sonochemistry, 19(3), 582-590. doi: 10.1016/j.ultsonch.2011.11.001
Mason, T. J., & Cordemans, E. D. (1996). Ultrasonic intensification of chemical processing and related operations: A review. Chemical Engineering Research & Design, 74(5), 511-516.
Melo, P. S., Bergamaschi, K. B., Tiveron, A. P., Massarioli, A. P., Oldoni, T. L. C., Zanus, M. C., ... Alencar, S. M. (2011). Phenolic composition and antioxidant activity of agroindustrial residues. Ciência Rural, 41(6), 1088-1093. doi: 10.1590/S0103-84782011000600027
Murthy, P. S., & Naidu, M. M. (2012). Sustainable management of coffee industry by-products and value addition - A review. Resources, Conservation and Recycling, 66, 45-58. doi: 10.1016/j.resconrec.2012.06.005
Naczk, M., & Shahidi, F. (2004). Extraction and analysis of phenolics in food. Journal of Chromatography A, 1054(1), 95-111. doi: 10.1016/j.chroma.2004.08.059
Rodrigues, N. P., & Bragagnolo, N. (2013). Identification and quantification of bioactive compounds in coffee brews by HPLC-DAD-MSn. Journal of Food Composition and Analysis, 32(2), 105-115. doi: 10.1016/j.jfca.2013.09.002
Sanderson, B. (2004). Applied sonochemistry–the uses of power ultrasound in chemistry and processing. In T. J. Mason & J. P. Lorimer. Applied sonochemistry: uses of power ultrasound in chemistry and processing (p. 207-208). Weinheim, DE: Wiley‐VCH Verlag.
Sato, Y., Itagaki, S., Kurokawa, T., Ogura, J., Kobayashi, M., Hirano, T., … Iseki, K. (2011). In vitro and in vivo antioxidant properties of chlorogenic acid and caffeic acid. International Journal of Pharmaceutics, 403(1-2), 136-138. doi: 10.1016/j.ijpharm.2010.09.035
Shibao, J., & Bastos, D. H. M. (2011). Maillard reaction products in foods: implications for human health. Revista de Nutrição, 24(6), 895-904. doi: 10.1590/S1415-52732011000600010
Singleton, V. L., Orthofer, R., & Lamuela-Raventós, R. M. (1999). Analysis of total phenols and other oxidation substrates and antioxidants by means of folin-ciocalteu reagent. Methods in Enzymology, 299, 152-178. doi: 10.1016/S0076-6879(99)99017-1
Wang, J., Sun, B., Cao, Y., Tian, Y., & Li, X. (2008). Optimization of ultrasound-assisted extraction of phenolic compounds from wheat bran. Food Chemistry, 106(2), 804-810. doi: 10.1016/j.foodchem.2007.06.062
Author notes
njorge@ibilce.unesp.br