Informação Tecnológica
Experimental prototype of silo-dryer-aerator of grains using Computational Fluid Dynamics (CFD) system
Experimental prototype of silo-dryer-aerator of grains using Computational Fluid Dynamics (CFD) system
Acta Scientiarum. Technology, vol. 41, 2019
Universidade Estadual de Maringá
Received: 01 May 2017
Accepted: 12 December 2018
Abstract: The aim of this study was to size up and evaluate a fixed bed experimental silo-dryer-aerator with four static grain drying cells for segregation lots, through simulations with mathematical equations and a computational fluid dynamics (CFD) system. The average specific energy consumption of the dryer was 2,998.56 kJ kg-1 of evaporated water. At the global scale, the amount of heat needed to complete a grain drying was 22,283.84 kcal (5,325.96 kJ kg-1) and the amount of heat required to complete the cooling of a stored grain mass was 3,525 kcal (842.49 kJ kg-1). The drying equipment responded positively to the dynamic aspects of air, distribution, flow, pressure, speed and heating. The results obtained allow us to conclude that the silo-dryer-aerator prototype was characterized as a viable and sustainable tool, making it possible to perform the drying and storage of grains in standardized and segregated lots, according to genetic characterization, minimizing quantitative and qualitative losses.
Keywords: drying of agricultural products, distribution of air drying, sizing of drying system.
Introduction
The grain production in the world is increasing year after year, due to the need for food and energy to find the social and economic demands of the population, promoting opening of new land areas, adoption of new technologies and inputs, varieties of seed management, and crop management. Consequently, the exploited natural resources demanded by food production were reduced, being a worldwide concern, as the effects on the environment brought changes in the climatic conditions and great socioeconomic losses to the population (Elias, Gutkoski, Oliveira, Mazzutti, & Dias, 2009).
However, the production of grains is only successfully achieved if they are maintained with integrity and quality until consumption, which often does not happen mainly due to the interferences of the processes applied in the post-harvest stages (Dalpasquale & Sperandio, 2009; Park, Kim, Park, & Kim, 2012). Drying is the most used process to ensure the quality and stability of the grains, considering that the decrease of the water content of the material reduces the biological activity and the chemical and physical changes that occur during storage. However, high rates of water removal during drying process may affect grain quality, promoting changes in its structure and in the content of its components. The rates of water removal generate internal stresses in the grains that can cause cracks and micro cracks, resulting in mechanical damage and decreased product quality. The higher the water withdrawal rate of the grains, the higher the rate of water removal, and consequently, greater possibility of mechanical damage to the product (Lacerda Filho, Souza, & Resende, 2000; Bazargan, Gebreegziabher, Hui, & McKay, 2014).
The drying methods can be classified in several ways, as to the periodicity in the heat supply or also in relation to the movement of the grain mass. There are several models of grain dryers available in the market and several studies are being carried out, seeking improvements in equipment to increase yield and feasibility, without any change in grain quality. For that, it is essential to control the temperature and airflow, the velocity and the pressures of the heated air inside the equipment, the product movement and the uniformity of the water content in the grain mass (Lahsasni, Kouhila, Mahrouz, & Jaouhari, 2004).
After drying, the grains are usually stored at large scale in silos or warehouses. During storage the grains are subject to quantitative and qualitative losses of extremely variable magnitude (Coradi, Melo, & Rocha, 2014). To avoid losses, the grains must meet a safety margin for water content, which combined with high temperatures can intensify the process of deterioration in storage. The combined effect of relative humidity and temperature in a given storage environment determines the activity of all the biotic components of the system, which lead to safe storage or product losses (Isquierdo et al., 2013).
Considering the problems of drying and storage of grains, as well the adoption of sustainability concepts, the importance of developing a drying and storage system with high operational efficiency, lower cost, with high quality grains is highlighted. It is assumed that the uniformity of grain drying could be increased and consequently the drying yield. In the storage units, loads of grains of different classes are received requiring drying treatment for an appropriate storage of the raw material, supporting the patterns of quality of the industry.
The aim of this study was to size and evaluate an experimental fixed bed silo-dryer-aerator with four static grain drying cells for segregation lots, through simulations with mathematical equations and a computational fluid dynamics (CFD) system.
Material and methods
The research was developed in Grain Postharvest Laboratory in the experimental area of the Universidade Federal de Mato Grosso do Sul (UFMS), Campus of Chapadão do Sul (CPCS).
The grain dryer was built with 14" high and circular shaped metal sheets containing a drying chamber (5) of 2.0 m height and 1 m diameter, with variable static capacity of 164 kg of grains) (Figure 1). The floor was scaled with 10% of its total perforated area. In the interior, four mobile drying cells were built for residence of the grain mass during drying, each one 1.5 m in height and 0.20 m in diameter, built of 12" metal plates with holes 2 mm in diameter and open at the top. The function of the four mobile drying chambers was to separate grains in bands of water content, impurities, grain size or genetics in order to increase the yield and quality of the grains during drying or storage. The dryer plenum (4) with the function of reducing the drying air speed was arranged below the drying chamber, with a diameter of 1.5 m and a height of 0.30 m. In the center of the plenum was installed one of the electric resistances of 4000 watts of power.
The other electric resistance of the same power was fixed in the front compartment of the plenum (2), 1.5 m long and 0.5 m high. A centrifugal fan of straight blades, of flow of 20 m³ min-1 and static pressure of 40 mmca, power of 0.5 cv, tension of 220/380 volts, rotation of 1750 rpm, single-phase, structure of carbon steel, rotor in cast aluminum, noise 90 DBA, weight of 35 kg was coupled to an air expander funnel 1.5 m long and 0.5 m high interconnected with the dryer body. The instrumentation of the drying system was performed with the control of the drying air temperature directly in the electrical resistances, through a 500 x 400 x 250 mm external controller, channels with open cutout for cable housing, circuit breaker Protection for 10A command and 40A force, 24V DC switching source for solid state relay activation, 40A three phase solid state relay with heat sink, N1040-PR temperature controller for system control, terminal strip for input and output of control cables and force. The used electrical resistances were U-shaped tubular type, manufactured with stainless steel tube 304, diameter 11.2 mm, and iron fins, total length of 1200 mm, 220 volts and 4500 watts. Depending on the area of the equipment, air flow and heating of the dryer, variations in the drying air velocity and temperature are controlled.
Energy and mass balance in the drying process
For the balance of energy and mass in the drying and cooling process according to the characteristics of the product: a) the initial mass of the product, b) the initial water content in the wet basis, c) the final water content in the dry and wet basis, d) the latent heat of vaporization, e) the sensible heat. From the ambient conditions, the air conditions were obtained: a) before the dryer enters: relative humidity, temperature, specific enthalpy, air humidity ratio; b) inside the drying chamber: relative humidity, specific enthalpy, specific volume, humidity ratio; c) in the dryer exhaust air: temperature, specific enthalpy, humidity ratio, specific volume. From the data, the total mass of water to be evaporated in the initial condition was calculated by Equation 1:
 (1)
(1)where:
Pal is the weight of water for initial condition (kg of water), Ui is the water content (% w.b.), Pt is the total grain weight (kg of product). The mass of dry matter is given by Equation 2.
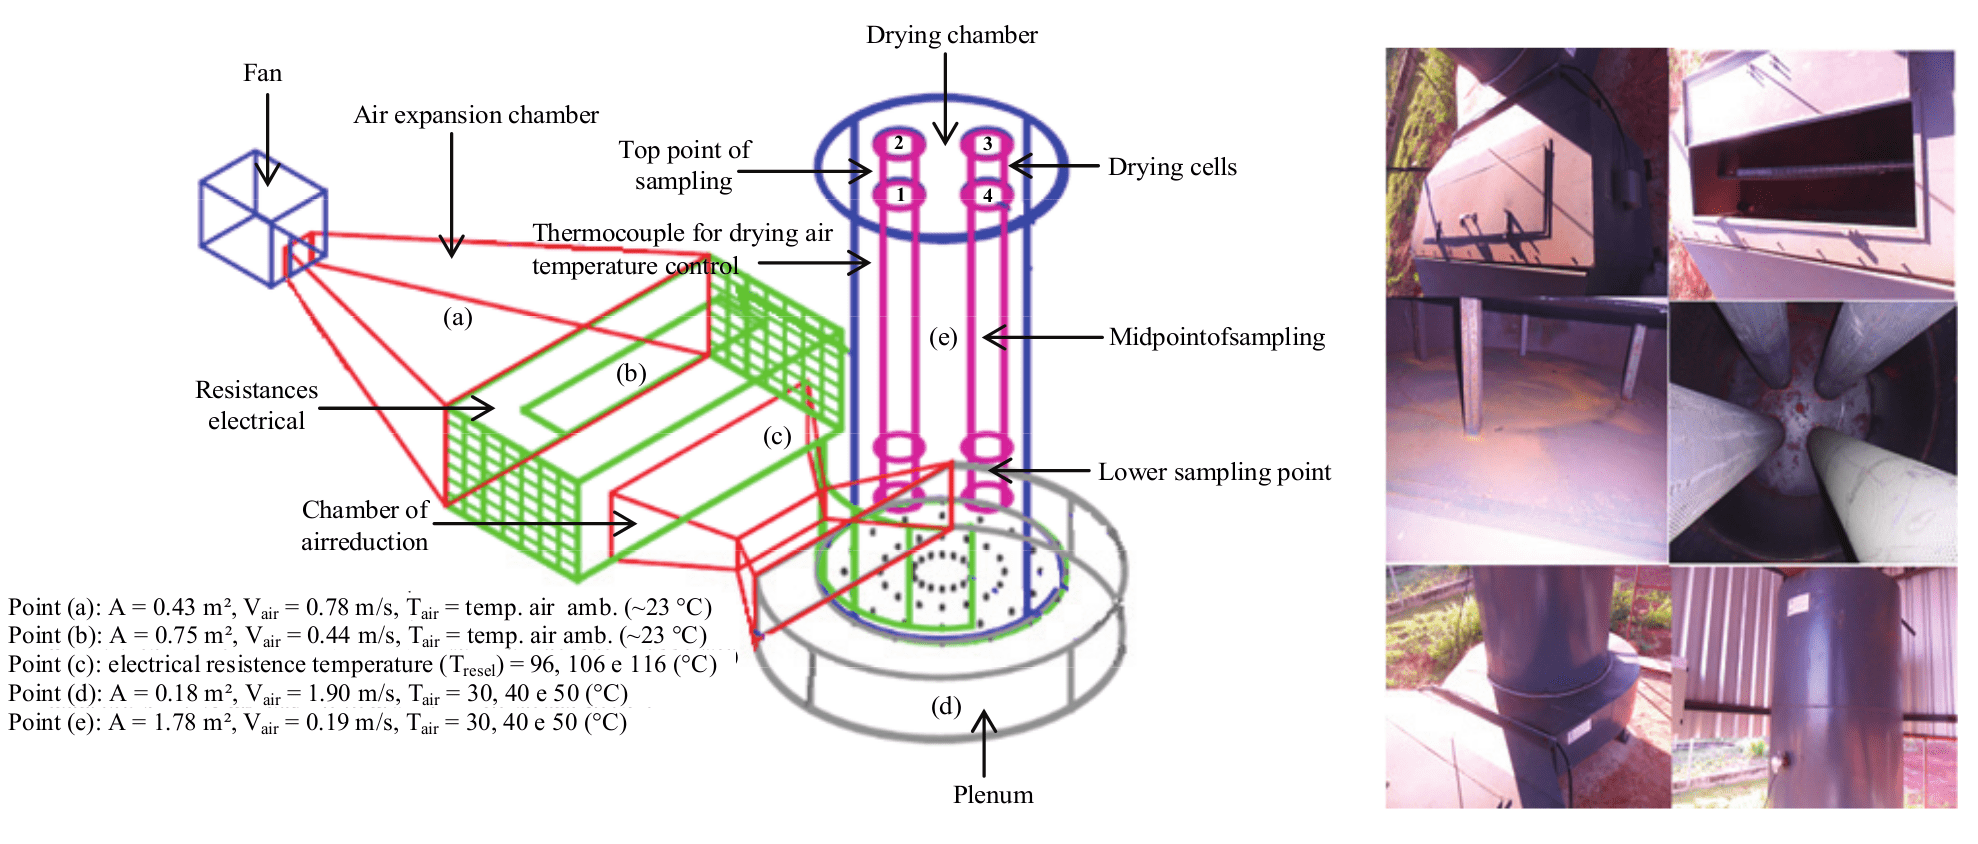
Figure 1.
Experimental silo-dryer-aerator prototype.
 (2)
(2)where:
Pdm is the weight of total dry matter (kg of product), Ptis the total weight (kg of product), Palis the weight of water for initial condition (kg of water). The mass of water to be evaporated to the final condition can be given by Equation 3:
 (3)
(3)where:
Pa2 is the weight of water for the final condition of the drying process (kg of water), Uf is the final water content, decimal in (d.b), Pgw is the total grain weight (kg of product).
The amount of water evaporated can be given by Equation 4:
 (4)
(4)where:
Qwater is the amount of total water to be evaporated, kg of water. To calculate the required amount of ambient air, it is necessary to calculate the variation of the humidity ratio of the exhaust air and the air of the initial condition, as well as the enthalpy change between the drying air and the air of the initial condition. The variation of the humidity ratio is given by Equation 5:
 (5)
(5)where:
Δmr is the variation of the humidity ratio (kg of water vapor/kg of dry air), RM2is the exhaust humidity ratio (kg water vapor/kg dry air), RM1 is the ratio of mixture of air in the initial condition (kg of water vapor/kg of dry air). The total dry matter content can be calculated by Equation 6:
 (6)
(6)where:
Mair dryis the mass of total dry air/kg of total dry air. The variation of enthalpy ratio can be given by Equation 7:
 (7)
(7)where:
ΔE is the enthalpy change (kJ kg-1 dry air), E2 is the enthalpy of the drying air (kJ kg-1 dry air), E1 is the enthalpy of the air in the initial condition (kJ kg-1 air dry). The amount of energy required was calculated by Equation 8:
 (8)
(8)where:
Etis the total dry air energy kJ-1 of dry air. Considering a predetermined time for the drying period of a batch of grains and the number of fans, the airflow required for grain drying was calculated. The dimensioning of the fan air flow is given by Equation 9:
 (9)
(9)where:
In which dry air is the dry air flow rate (kg dry air min.-1), t is the drying time (min.). The fan airflow can be given by Equation 10:
 (10)
(10)where:
Qv is the total fan airflow, without excess air (m3 hour-1), Ve3is the specific volume of the exhaust air (m3 kg-1 dry air). The amount of heat required for the drying of the grain mass was calculated by Equation 11:
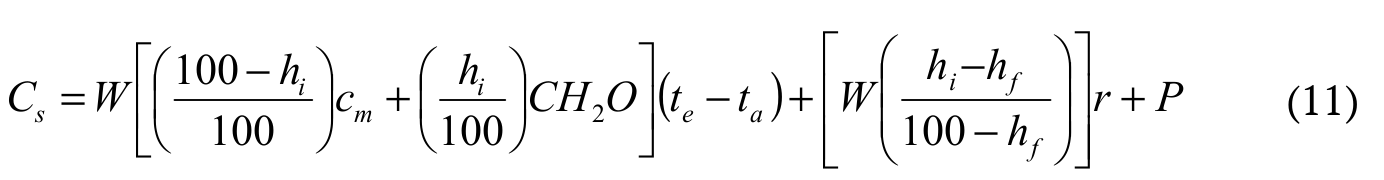 (11)
(11)where:
Cs is amount of heat (kcal); W is product inlet weight being dried (kg); hi is initial moisture content, (% w.b.); hfis final moisture content, (% w.b.); Cm is specific heat of the product to be dried (grain ~ 0.47 kcal kg-1 °C-1); CH2O is specific heat of water (1 kcal kg-1 °C-1); r is latent heat of water (568 kcal kg-1 °C-1 a 50°C); te is operating temperature, °C; tais product initial temperature (°C); P is losses ~ 30%. The amount of heat required for cooling the grain mass was calculated by the Equation 12:
 (12)
(12)where:
Cr is quantity of heat to be withdrawn (kcal hour-1), m is grain mass to be cooled (kg); Cm is specific heat of the mass of grains, (0.47 kcal kg-1 °C-1); is the temperature variation of the grain mass, reduction at -5°C. The time of grain mass stored in cooling in silo-dryer was calculated by Equation 13:
 (13)
(13)where:
t is time (hour); mg is total mass of grains (tons); Cg is specific heat grain, 1.67 kJ kg-1 °C-1, Qtis total air flow fan (m3 min.-1), Da is air density, 1.15 kg m-3, Ca is specific heat of air, 1.0 kJ kg-1 °C-1. The specific energy consumption was defined as the amount of energy per unit mass required for removing water from the grains. The drying efficiency was defined as the ratio between the amount of energy required to grain removal of water and the total energy used by the dryer. In this way, the specific energy consumption was given by Equation 14:
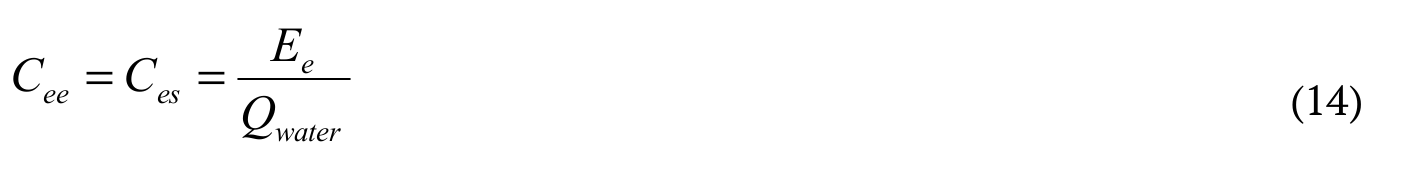 (14)
(14)where:
In which Ceeis the specific energy consumption (kJ kg-1), Csis the specific energy consumption in drying (kJ kg-1), Ee is the energy consumption (kJ), Qwater is the amount of evaporated water (kg of water). The amount of total water to be evaporated was calculated by Equation 15:
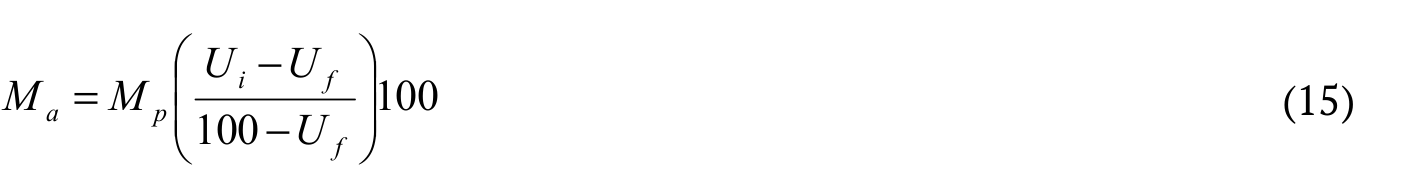 (15)
(15)where:
Mais mass total water to be evaporated (kg of water); Mpis mass total product (kg); Uiis initial content water of grain (% w.b.); Uf is final water content of the grain (% w.b.) The dryer efficiency was calculated by the Equation 16.
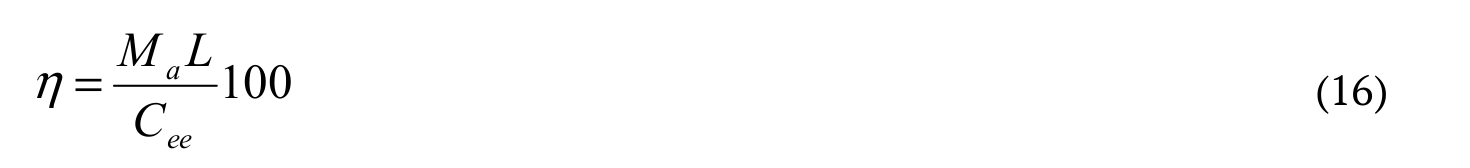 (16)
(16)where:
ɳ dryer yield (%); L latent heat of vaporization of water (2,500), kJ kg of water; Ceeis specific energy consumption (kJ).
Fluid assessment of the heated air inside the silo-dryer-aerator
To evaluate the heated air and cooling fluid in the silo-dryer-aerator the computational tool CFD (Computational Fluid Dynamics), software ANSYS Fluent® 16.0 (Coradi, Martins, Costa, Vigoderis, & Tinôco, 2016) was used. For the simulation it was taken into account the constructive characteristics of the silo-dryer-aerator, the heating and cooling air system, environmental variables controlled, initial and boundary conditions, dimensionless system, and the physical parameters. For the simulation, a mathematical model of air convection inside the dryer was built taking into account the type of air flow, the thermophysical properties of the fluid, the viscous dissipation in the flow, the pressure term in the energy equation and the surfaces of the dryer. The project was characterized as a forced convection air flow.
In order to approximate the integral of the derivative of the dependent variable on the boundaries of the control volumes, the scheme used was the central difference (CDS) with numerical integration, with simplec P-V coupling, convergence configurations with final time of 1e + 004, with ten steps in time (in s), with maximum number of interactions in P-V coupling (4) and temperature (3), permanent regime (convergence) mass errors, pressure, velocity and temperature (1e-005). To solve the problem under study, the solution method by Gauss Seidel was used, with a tolerance of (1e-005), with a maximum of 100 interactions and intervals of one interaction to check the tolerances.
The initial condition of average ambient temperature was 23°C. For the boundary conditions it was considered temperatures of 88, 98 and 108°C in the bottom wall (south side), at which the input of air was heated. While on the east, west and north sides the heat flow was considered equals to zero. Considering that the geometry of the system in real scale interferes with the convergence of the convective heated air in the dryer, the non-dimensionalization became necessary for the simulation. It was considered the following for length (L) of the section (dryer) = 1:
a) Initial temperature (T1) 96.91ºC = 1 (south side) and final temperature (T2) 88.42ºC = 0 (north side);
b) Initial temperature (T1) 106.93ºC = 1 (south side) and final temperature (T2) 98.44ºC = 0 (north side);
c) Initial temperature (T1) 116.96ºC = 1 (south side) and final temperature (T2) 108.46ºC = 0 (north side).
For the simulation of air settled the following custom physical parameters: ρ = 1 kg m-3; cp = 0.72 J kg-1 ºC-1; k = 0.1 w m-1 ºC-1; μ = 0.1 kg m-1 s-1; β = 13.88 1 k-1; q = 0 W m-3; g = 10 m s-2, wherein: (ρ) specific mass, (cp) specific heat, (k) electric conductivity, (µ) viscosity, (q) heat flow, (β) thermal expansion coefficient. The volumetric expansion coefficient was calculated according to the number of Rayleigh (Ra,L), by equation (1), while its convergence occurred when (1708 < Ra,L < 5x10⁵). Thus (Ra,L) = 104 was adopted, resulting in β = 13.88 (1 k-1), allowing the convergence and better distribution of temperature, pressure, speed, and heat flow Equation 17:
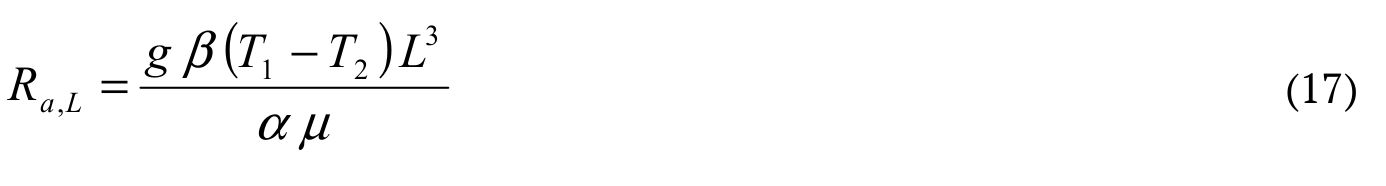 (17)
(17)where:
T1 is initial temperature, T2 final temperature, α coefficient of thermal diffusivity, L section length, Ra,L Rayleigh. The ermalente of ermal diffusivity was determined by Equation 18:
 (18)
(18)Silo-dryer-aerator system network and the mathematical model
Figure 2 shows the flow of the convective air and the distribution of the heat inside the dryer. Equation 19, 20 and 21 characterize the flow (Reynolds & Perkins, 1977).
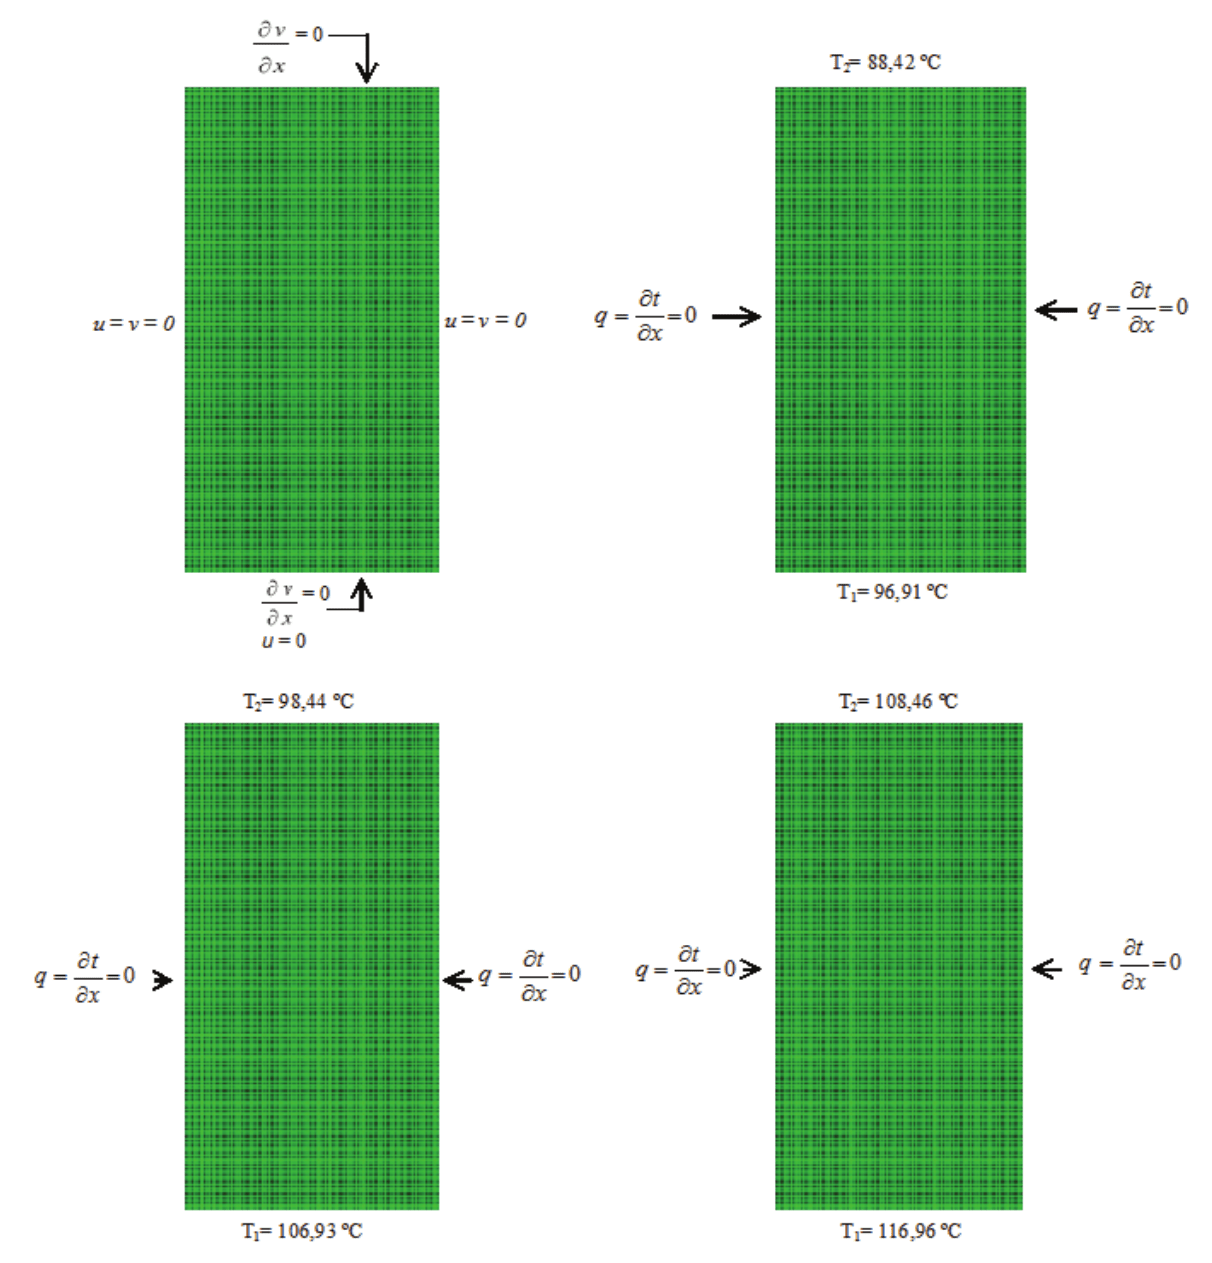
Figure 2.
Representation in cut convective air flow and distribution of heat flow inside the dryer.
Continuity Equation:
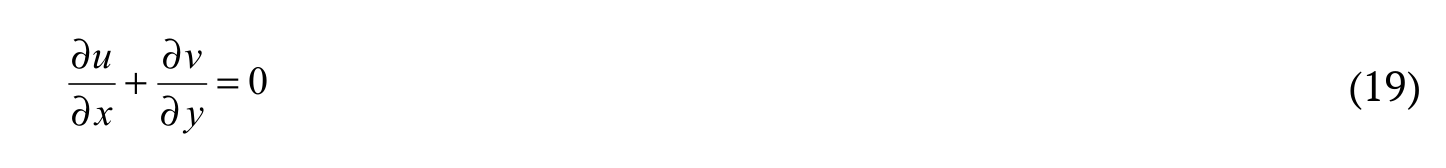 (19)
(19)Equation of the momentum in the x-direction:
 (20)
(20)Equation of the momentum in the y direction:
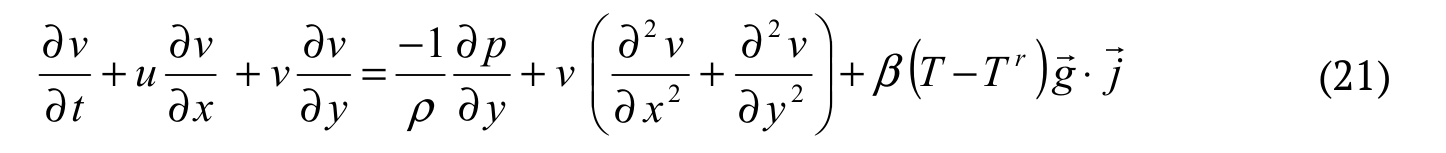 (21)
(21)where:
u is the velocity in the direction (x) (m s-1), v is the velocity in the direction (y) (m s-1), x is the horizontal coordinate (m), y is the vertical coordinate (m), p is the specific mass (kg m-3), δ is the gradient, β is the volumetric expansion coefficient, T is the temperature (°C), i is the unit vector in the (x) direction, J is the unit vector in the (y) direction. Equation 22 represents the conservation of energy in the system:
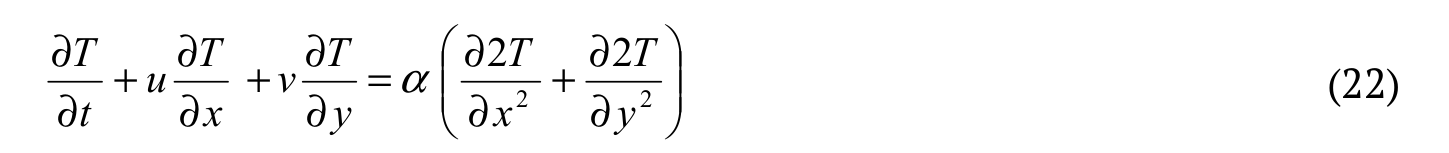 (22)
(22)where:
α is the thermal diffusivity (m2 s-1).
Results and discussion
Energy analysis is a widely used practice in dryer studies, in the search for alternatives that reduce specific energy consumption. The energy and mass balance in the drying and cooling air, in the grain mass and the amount of heat required for drying and cooling are presented in Table 1 and 2. It was verified that the drying of the grains from 22 (w.b.) to 12% (w.b.) of moisture was performed in 23.556 min., i.e. 2.08 min for each 1% of moisture withdrawn from the grain mass. For the energy and mass balances, it was considered the grain dryer running at full capacity of 150.72 kg (Pt), initial moisture content of 22 (w.b.) and the final 12% (w.b.). The average air temperature in the drying chamber was obtained at 106.93°C. The 10°C temperature difference between the inlet of the drying chamber and the outlet as exhaust air was used for the grain mass to remove water from the grains in initial ambient air conditions of 50% RH and 23°C.
To carry out the drying process there was an air mixing 0.126 of 1 kg of dry air steam (ΔRM). The amount of water evaporated (water) was 19.051 kg, i.e. 1.68 kg of water for every 1% of water removed from the grain mass. However, the reduction of 1% (w.b.) of the mass of the water content of grains until the end of drying (12% w.b.) provided an increase of 1.50 kg of dry matter (Pdm). For the initial conditions of room temperature of 30°C and UR of 80%, when the dryer was heated at 106.93°C, the energy obtained in the drying chamber for a mass of 6.41 kg of dry air min.-1 (dry Qair) was of 2,965.61 kJ kg-1 of dry air (ΔE). The total energy (Et) used for drying was 448397.1 kJ in 151.2 kg of dry air (Mair dry).
The average specific energy consumption (Ces + Cee) was 2,998.56 kJ kg-1 of evaporated water. Soysal, Oztekin, and Eren (2006) evaluating a rotary dryer observed an average specific energy consumption of 4,308.5 kJ kg-1 of evaporated water. Elias et al. (2009) designed and evaluated a cross-flow, intermittent and reversible airflow drier for corn drying and concluded that the average drying efficiencies at temperatures of 60, 80 and 100°C were, respectively, 6,638, 6,432 and 5,608 kJ kg-1 of evaporated water. Costa, Lacerda Filho, Silva, Queiroz, and Dadalto (2010) analyzing a drying system of corn seeds in spikes and bulk in fixed layers dryers, using corn cob as fuel, obtained energy efficiencies of 12,967.76, 30,220.2 and 25,213.7 kJ kg-1 of evaporated water for three different treatments. Isquierdo et al. (2013) obtained values of 11,200 kJ kg-1 of evaporated water to reduce coffee moisture from 24 to 14% (w.b.). For drying, a fan with air flow rate (Qv) of 325 m3 hour-1 was considered, considering a specific air volume (Ve3) of 0.845 m3 kg-1 of dry air, obtaining a specific consumption of electric energy (Cee) of 23.53 kg kg-1. The dryer had a yield of 72.76% of energy utilization in the process.
In Table 2, it was obtained the global scaling of the amount of heat required for the drying process of the grains from 22 to 12% (w.b.) of moisture, considering a specific grain heat (Cm) of 0.47 kcal kg-1 °C-1, specific heat of water (CH2O) of 1 kcal kg-1 °C-1, latent heat of vaporization of 568 kcal kg-1 °C-1, for a mean drying air temperature and the temperature of the grain mass (t) of 23°C and losses (P) in the drying process were 30%. The amount of heat (Cs) used to remove moisture from the grains was 22,283.84 (5,325.96 kJ kg-1), 1,345.68 kcal (321.62 kJ kg-1) for each 1% moisture removed of the grain mass, that is, a consumption of 25.89, 1.56 kWh for each 1% moisture removed from the grain mass, at a cost of US$ 11.39 to complete drying, US$ 0.44 for every 1% moisture removed from the grain mass. In Table 2 is the amount of heat to be removed for the 5°C cooling of 1,500 kg of stored grains, considering the specific heat of the grains of 0.47 kcal kg-1 °C-1. To carry out the cooling process, 3,525 kcal (842.49 kJ kg-1) (Cr), a consumption of 4.07 kWh (Cw) and costs of US$ 1.79 (Ce) were used, in a time of 0.8 hours.
Dynamic behavior of the heated air inside the grain dryer using the CFD program
Figure 3I, II and III are simulations (temperature, velocity, pressure, heat flow and power) of the heated air inside the grain dryer at temperatures of 96, 106 and 116°C. It was found in the parameters evaluated that there was a uniform distribution of the heated air from the bottom of the drying chamber, in defined layers and heating air circulation inside the dryer. In the heated air input (base of the dryer), it was found higher values of these parameters, except for the lines of the air current. For air temperature variable, there was a variation of 8.5°C from the air inlet to the dryer exit. The regulation of the temperature in the dryer's control panel for 30°C showed a variation of heating air 96.91 (inlet) to 88.42°C (outlet) (Figure 3 Ia) at the end of the path inside the dryer. However, when the temperature was adjusted to 40°C, it was obtained an air heating from 106.93 (input) to 98.44°C (outlet) (Figure 3 IIa), whereas in the controlled temperature of 50°C air has reached a temperature from 116.96 (input) to 108.46 °C (outlet) (Figure 3 IIa). The air speed parameter, Figure 3 Ib, IIb and IIIb, had similar changes for all temperatures with initial values in the air inlet from 0.65 to 0.00 m s-1 the air outlet of the drying chamber. Lopes, Steidle Neto, and Santiago (2014) recommended at the beginning of the drying process at room temperature, an airspeed from 0.25 to 0.27 m s-1 in the grain mass. Also, according to the author, this increased speed can cause cracks and breaks in the grains. The way it processes the drying fixed layer originates temperature gradients and moisture in the grain mass (Khanchi et al., 2013; Rodríguez, Melo, Mulet, & Bon, 2014). According to the authors, in a stationary drier with radial air distribution under 40°C, no differences were observed between grain temperatures near the central tube and spaced apart. In contrast, soybeans found a gradient at 15°C under similar dryers.
The water content gradient between grains differently spaced in relation to the air inlet area depends on the relative humidity, temperature, air flow, the water content of the pasta thickness and the water transfer capability of grain into the air. This gradient is reduced with decreases in temperature and thickness of the seed weight and increased airflow. In more distant sections of the air inlet may be an increase of the grain moisture content as a result of condensation caused by the passage of humid air in layers over low temperature (Ghazanfari, Emani, Tabil, & Panigrahi, 2006; Ayadi, Mabrouk, Zouari, & Bellagi, 2014). The relationship between the volume of air that passes through the product mass, the resistance to passage of air and the height of the product layer above the distribution system, are important in the design, selection and operation of the air handling equipment. Figure 3 Ic, IIc and IIIc are the results of dynamic air pressure inside the dryer. The variation of pressure was 35.19 Pa, and the decreased air pressure in the middle third of the equipment was increased and the upper third, approaching the initial pressure observed in the first third of the equipment. It was observed that there was no difference between the heating temperature of the air, and the air pressure in the dryer output was higher (65.46 Pa), while in the middle third of the drying chamber the air pressure was lower (30.27 Pa). The distribution of air current lines was above the entrance of the dryer. However, the air current lines showed similar behavior and identical values for all tested temperatures (Figure 3 Ie, IIe and IIIe). The larger air currents were obtained in the upper third of the dryer at the left side of the machine. A reduction of the air flow was observed in the middle third of the equipment. For the heating of the air temperature, the currents of 30°C were higher (0.03 to 0.00 m s-1), while the other temperatures were of 0.02 to 0.00 m s-1.
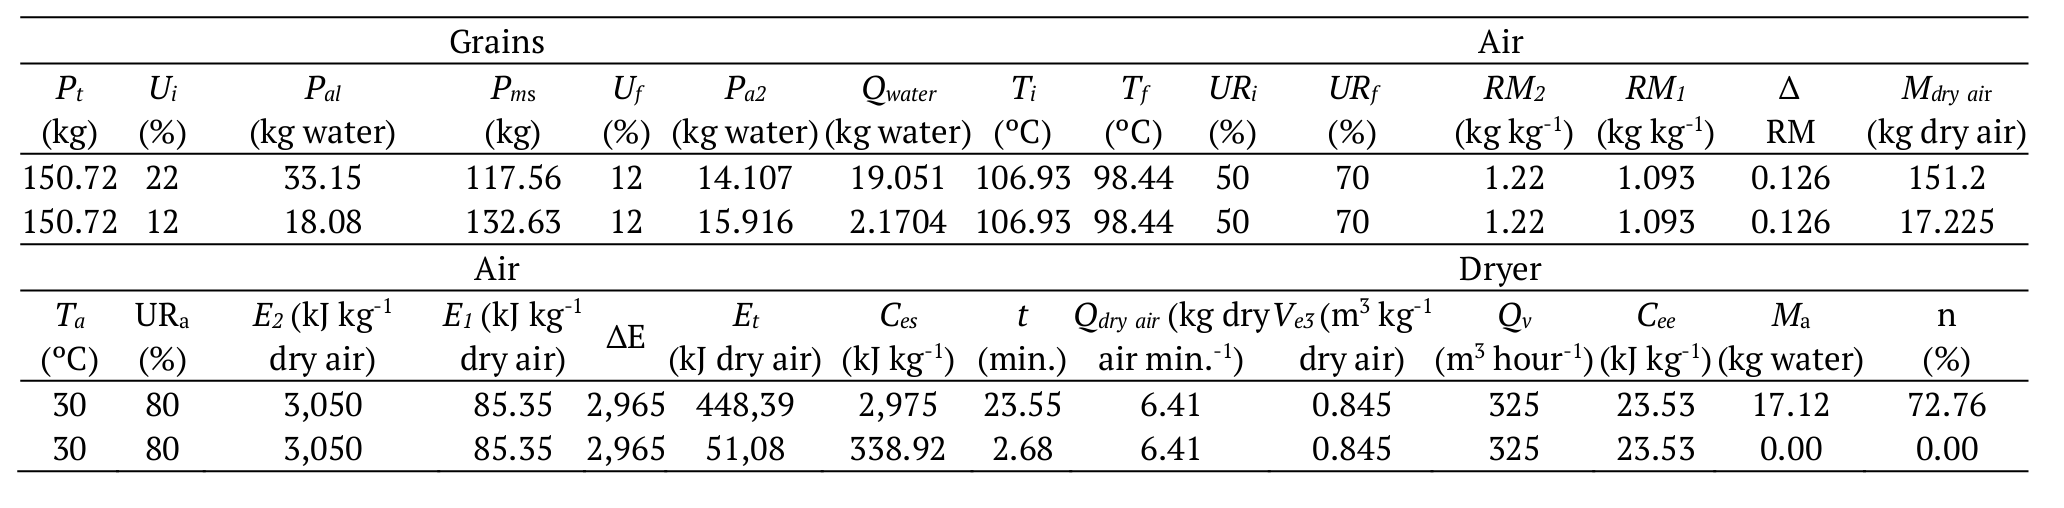
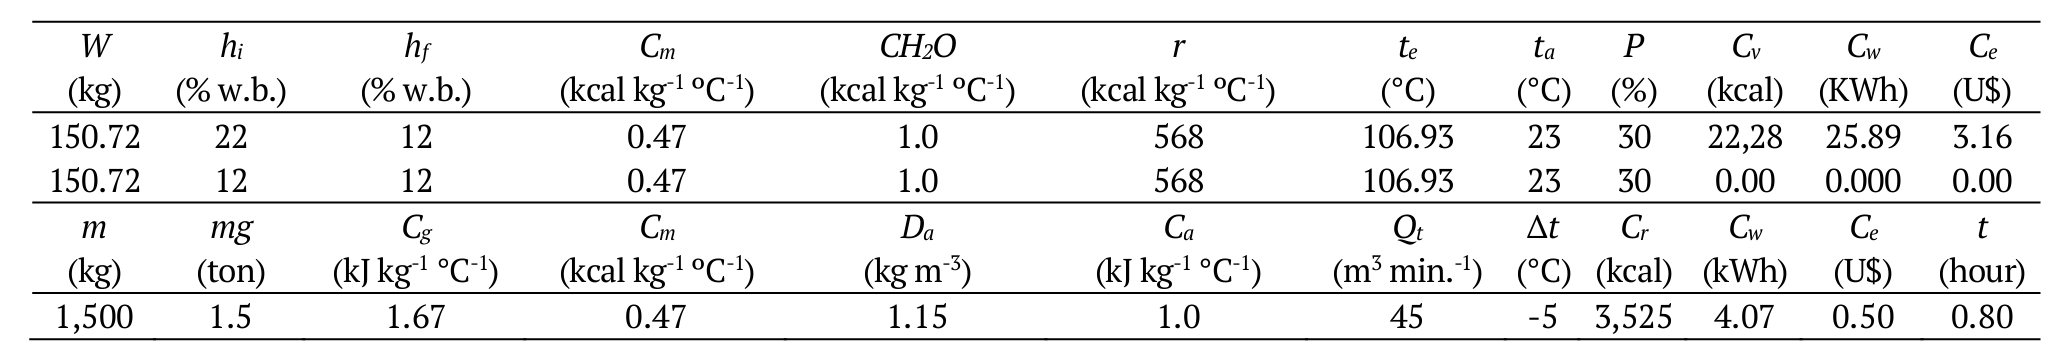
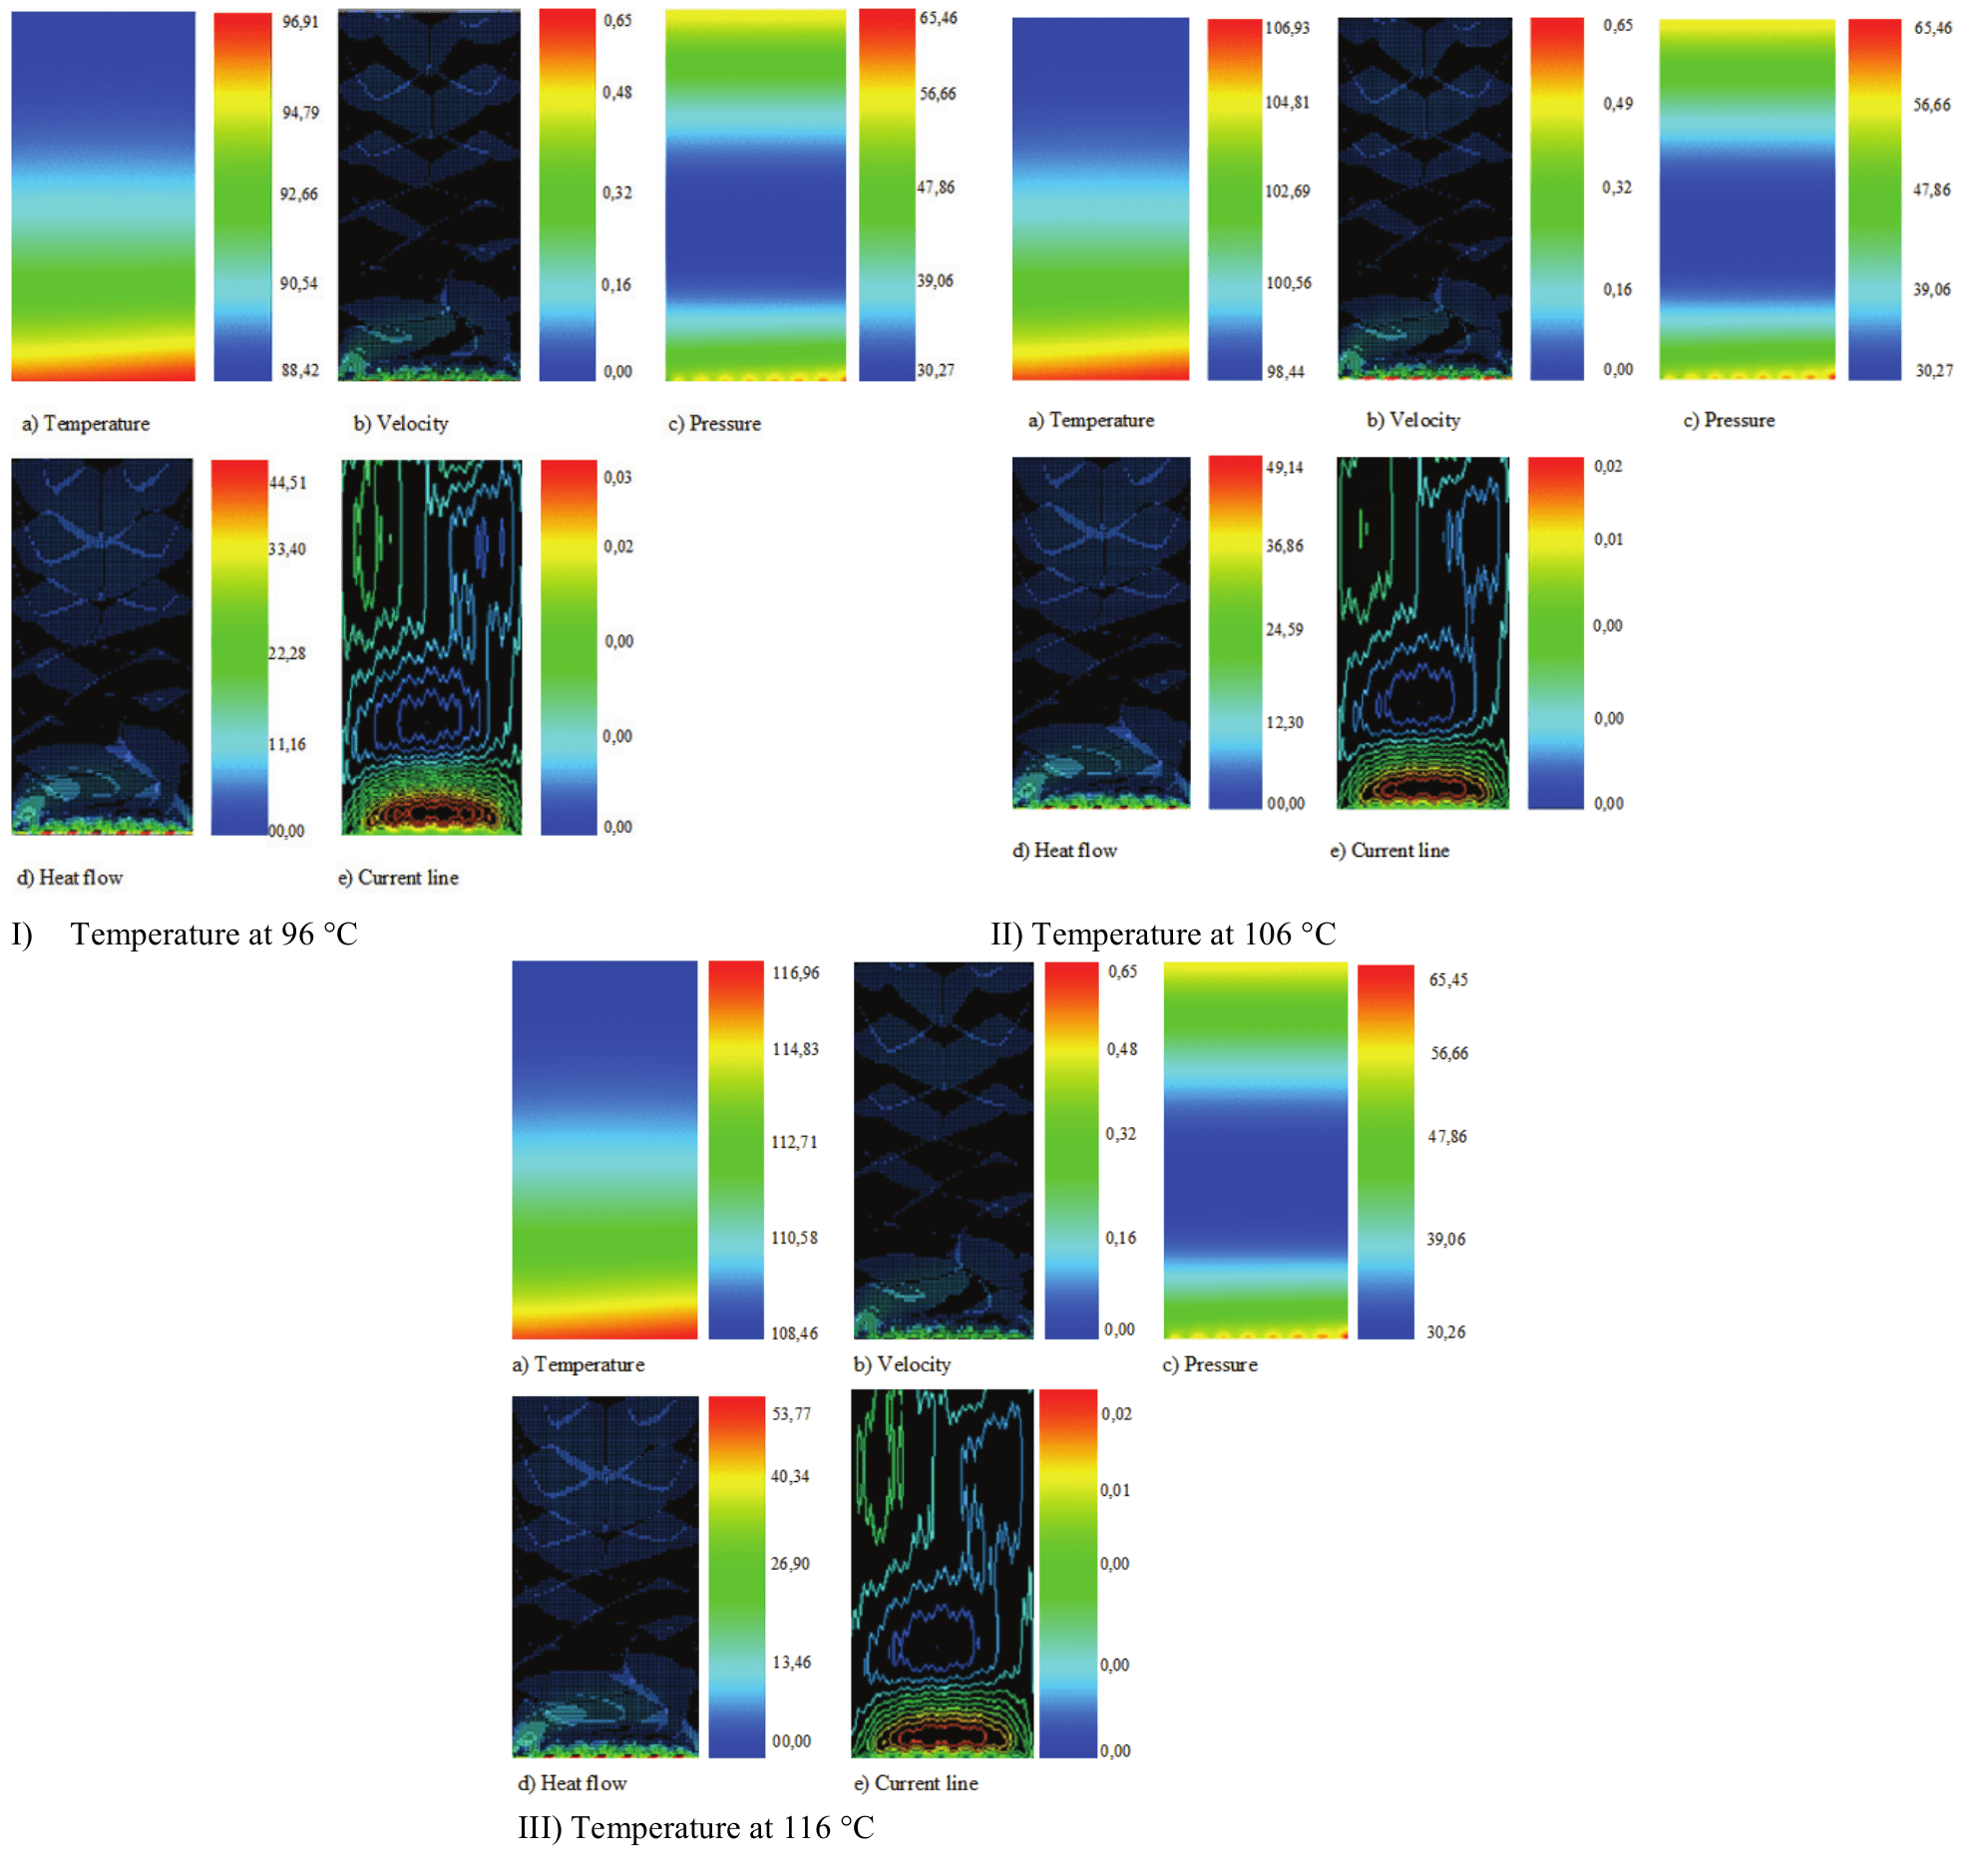
Figure 3.
Simulations of the heated air in the silo-dryer-aerator.
Figure 3 Id it was found that the heat flow was higher at the entrance of the drying chamber, decreasing along the way to zero, but with different initial amounts for each temperature. For the heated air at 30°C (Figure 3 Id), the air flow was 44.51 m3 min.-1 m-2 to 40°C (Figure 3 IId), the air flow was 49,14 m-3 min.-1 m-2, while for the air temperature 50°C (Figure 3 IIId) the airflow was 53.77 m3 min.-1 m-2. According to Lopes, Martins, Neto, and Monteiro (2008) the wetter grains are more susceptible to thermal damage, which is why it is suggested that the higher the water content, the lower the temperature to be used. However, Ozbek and Dadali (2007) reasoned that the surface water can be removed under high air temperature, since the evaporation process removes sufficient heat, not changing the grain temperature. Below 30% water, however, the amount of water is less available for evaporation. According to Soysal et al. (2006); Steidle Neto and Lopes (2015) the air flow should be enough to overcome the losses of the load in order to exercise the grain drying process before the air reaches the humidity saturation. From this point on, the water migration from the interior to the surface of each grain, becomes the main factor affecting the drying rate. Isquierdo et al. (2013) point out that grain mass temperatures ranging between 40.5 and 43.3°C are considered to be maximum, and frequently can cause physical or chemical damage. Nevertheless, the difference between the temperature of the supply air and the grain mass depends on the type of dryer, the botanical species concerned, and the movement of air resistance, making it necessary to know the heat behavior in every type of dryer and species.
Conclusion
The dryer had an efficient energy performance, with an average specific energy consumption of 2,998.56 kJ kg-1 evaporated water. The amount of heat used to remove moisture from grains was 22,283.84 kcal (5,325.96 kJ kg-1) and the amount of heat removed for cooling of the stored grain weight was 3,525 kcal (842.49 kJ kg-1). The drying equipment acted positively in response to the dynamic aspects of air, distribution, flow, pressure, speed and heating. The silo-dryer-aerator prototype was characterized as a viable and sustainable tool making it possible to perform the drying and storage of grains in standardized and segregated lots.
Acknowledgements
The authors thanks UFSM, UFMS, FUNDECT, CAPES, FAPERGS and CNPq for financial support.
References
Ayadi, M., Mabrouk, S. B., Zouari, I., & Bellagi, A. (2014). Kinetic study of the convective drying of spearmint. Journal of the Saudi Society of Agricultural Sciences, 13(1), 1-7. doi: 10.1016/j.jssas.2013.04.004
Bazargan, A., Gebreegziabher, T., Hui, C. W., & McKay, G. (2014). The effect of alkali treatment on rice husk moisture content and drying kinetics. Biomass and Bioenergy, 70(1), 468-475. doi: 10.1016/j.biombioe.2014.08.018
Coradi, P. C., Martins, M. A., Costa, D. R., Vigoderis, R. B., & Tinôco, I. F. F. (2016). Computational Fluid Dynamics (CFD) simulating heated air from wood burning inside a poultries barn. Engenharia Agrícola, 36(5), 768-778. doi: 10.1590/1809-4430-Eng.Agric.v36n5p768-778/2016
Coradi, P. C., Melo, E. C., & Rocha, R. P. (2014). Evaluation of electrical conductivity as a quality parameter of lemongrass leaves (Cymbopogon Citratus Stapf) submitted to drying process. Drying Technology, 32(8), 969-980. doi: 10.1080/07373937.2013.879593
Costa, D. R., Lacerda Filho, A. F., Silva, J. S., Queiroz, D. M., & Dadalto, J. P. (2010). Análise energética de um sistema de secagem de milho em secador rotativo. Engenharia na Agricultura, 18(8), 151-164. doi: 10.13083/reveng.v18i2.215
Dalpasquale, V. A. D., & Sperandio, E. K. (2009). Performance of the Michigan drying simulation model with a new drying rate concept. Acta Scientiarum Agronomy, 31(4), 553-557. doi: 10.4025/actasciagron.v31i4.3872
Elias, M. C., Gutkoski, L. C., Oliveira, M., Mazzutti, S., & Dias, A. R. G. (2009). Harvest moisture, drying methods and storage time in the technological quality of wheat grains. Ciência Rural, 39(1), 10-21. doi: 10.1590/S0103-84782009000100005
Ghazanfari, A., Emani, S., Tabil, N. G., & Panigrahi, S. (2006). Thin-layer drying of flax fiber: II. Modeling drying process using semi-theoretical and empirical models. Drying Technology, 24(12), 1637-1642. doi: 10.1080/07373930601031463
Isquierdo, E. P., Borém, F. M., Andrade, E. T., Corrêa, J. L. G., Oliveira, P. D., & Alves, G. E. (2013). Drying kinetics and quality of natural coffee. American Society of Agricultural and Biological Engineers. Transactions, 56(3), 1003-1010. doi: 10.13031/trans.56.9794
Khanchi, A., Jones, C. L., Sharma, B., Huhnke, R. L., Weckler, P., & Maness, N. O. (2013). An empirical model to predict infield thin layer drying rate of cut switchgrass. Biomass and Bioenergy, 58(1), 128-135. doi: 10.1016/j.biombioe.2013.08.024
Lacerda Filho, A. F., Souza, S. J., & Resende, R. C. (2000). Structures for storage of grains. In Silva, J. S. (Org.), Drying and storage of agricultural products (p. 325-344). Viçosa, MG: Aprenda Fácil.
Lahsasni, S., Kouhila, M., Mahrouz, M., & Jaouhari, J. T. (2004). Drying kinetics of prickly pear fruit (Opuntia ficus indica). Journal of Food Engineering, 61(2), 173-179. doi: 10.1016/S0260-8774(03)00084-0
Lopes, D. C., Martins, J. H., Neto, A. J. S., & Monteiro, P. M. B. (2008). Management of stored maize by AERO controller in five Brazilian locations: a simulation study. Biosystems Engineering, 101(3), 325-330. doi: 10.1016/j.biosystemseng.2008.09.001
Lopes, D. C., Steidle Neto, A. J., & Santiago, J. K. (2014). Comparison of equilibrium and logarithmic models for grain drying. Biosystems Engineering, 118(1), 105-114. doi: 10.1016/j.biosystemseng.2013.11.011
Ozbek, B., & Dadali, G. (2007). Thin-layer drying characteristics and modelling of mint leaves undergoing microwave treatment. Journal of Food Engineering, 83(4), 541-549. doi: 10.1016/j.jfoodeng.2007.04.004
Park, C. E., Kim, Y. S., Park, K. J., & Kim, B. K. (2012). Changes in physicochemical characteristics of rice during storage at different temperatures. Journal of Stored Products Research, 48(1), 25-29. doi: 10.1016/j.jspr.2011.08.005
Reynolds, W. C., & Perkins, H. C. (1977). Engineering thermodynamics. Retrieved from https://en.wikibooks.org/wiki/Engineering_Thermodynamics
Rodríguez, J., Melo, E. C., Mulet, A., & Bon, J. (2014). Management of Surface drying temperature to increase antioxidant capacity of thyme leaf extracts (L.). Drying Technology, 32(16), 1931-1941. doi: 10.1080/07373937.2014.917094
Soysal, Y., Oztekin, S., & Eren, O. (2006). Microwave drying of parsley: modelling, kinetics, and energy aspects. Biosystems Engineering, 93(4), 403-413. doi: 10.1016/j.biosystemseng.2006.01.017
Steidle Neto, A. J., & Lopes, D. C. (2015). Thermistor based system for grain aeration monitoring and control. Computers and Electronics in Agriculture, 116(1), 45-54. doi: 10.1016/j.compag.2015.06.004