Geociências
Wavelet analysis of rainfall data of the aguapeí -peixe hydrographic basins (state of São Paulo)
Wavelet analysis of rainfall data of the aguapeí -peixe hydrographic basins (state of São Paulo)
Acta Scientiarum. Technology, vol. 41, 2019
Universidade Estadual de Maringá
Received: 20 June 2017
Accepted: 31 October 2018
Abstract: With the use of the Wavelet analysis, this study aimed to detect the dominant oscillations and phenomena that influence the occurrence of extreme rainfall events in the basins of the Aguapeí River and the Peixe River in order to generate information useful to water management. Rainfall data from 18 stations in the State of São Paulo were used, in the period from 1958 to 2013, obtained through the National Water Agency (ANA). The temporal scales that influence the rainfall and the occurrence of extreme events at each rainfall station of the basins were identified, in which the approximately 22-year scale related to the Pacific Decadal Oscillation (PDO) was the dominant in all rainfall stations. The study pointed out that the association of different temporal scales contributes to the increase in the rainfall index, on the other hand, the lack of them relates to years of low rainfall index.
Keywords: temporal scales, extreme rainfall events, rainfall index.
Introduction
In recent years, Brazil is experiencing increasingly intense and frequent extreme climatic events, which associated with climate change have caused damages that reach the growing population (Marengo, Schaeffer, Zee, & Pinto, 2009).
The El Niño Southern Oscillation (Enso) climate phenomenon has a reduced intensity in the Southeastern region of Brazil compared to the South and Northeast regions of Brazil (Minuzzi, Sediyama, Costa, & Vianello, 2006), but this phenomenon intensifies or attenuates the meteorological systems and causes the rainfall variability in the region, affecting the energy and economic sectors and the urban population.
The hydrographic basins of the Aguapeí River and the Peixe River, located in the west of the State of São Paulo, are characterized as agricultural areas due to extensive cattle ranching and sugarcane crops that are important for the regional economy. Annually, heavy rainfall events that occur especially in the summer, cause erosion, floods and landslides that affect mainly the infrastructure of the region, such as highway blockades and bridge ruptures. For the agricultural sector, excessive rainfall affects both the planting and harvesting of crops such as corn, coffee, sugarcane and vegetables (Equation 1).
 (1)
(1)The application of the wavelet analysis becomes an effective method to identify the mechanisms that influence the rainfall events of the region, understanding their functioning and identifying the climatic cycles acting in the rainfall series. From this perspective, the use of this statistical analysis in the rainfall data series of the Aguapeí-Peixe Basins aims to assist in the energetic and economic planning of the region, besides advising on the adoption of mitigating and preventive practices in relation to possible extreme climatic events that may hit the region.
Material and methods
The study area (Figure 1) is the Aguapeí River basin, which has an area of 13,196 km2 and is located between the geographic coordinates 21° 20’ to 22° 11’ South latitude and 51° 07’ to 51° 19’ West longitude, and the Peixe River Basin, with an area of 10,769 km2 and situated between the geographic coordinates 21° 44’ to 22° 21’ South latitude and 51° 19’ to 51° 50’ West longitude, both located in the western plateau in the western state of São Paulo, (Rocha & Tommaselli, 2012; Trivellato & Perez Filho, 2016).
In this study, we used rainfall data for the 1958-2013 period from 19 localities belonging to the hydrographic basins of the Aguapeí River and the Peixe River, obtained through the National Water Agency (ANA). The rainfall series of the stations were treated to be subjected to the wavelet analysis through Prp indices. These indices are anomalies of the variables, calculated from the monthly climatology and normalized by the standard deviations (Silva, Souza, & Kayano, 2009):
Where AVari,j is the anomaly of the variable, in year j = 1, 2, 3, ..., N and month i = 1, 2, 3, ... 12; Vari,j is the variable in year j = 1, 2, 3 ..., N and month i = 1, 2, 3, ... 12, which was calculated its anomaly; i is the climatological average of the month to be calculated the anomaly and σi is the standard deviation used for each specific month i.
The information generated from the rainfall data was examined to identify seasonal and interannual variations, cyclic periods and random variations, using the wavelets. These preliminary wavelet analyzes can provide a clearer indication of which time scale dominates the meteorological systems throughout the series.
The term wavelet extends to a set of small wave-shaped functions produced by dilations (a) and translations (b) of a simple function ψ(t) of real variable t, eventually called as mother-wavelet or basic-wavelet. The functions resulting from the mother-wavelet are termed daughter-wavelets or simple wavelets. This function must be quadratically integrable within a real range, or space [L2(Ʀ)], i.e. it must have infinite energy. The wavelet function is characterized mathematically on a scale a and position b, where a and b are real values, and a > 0, (Weng & Lau, 1994):
Morlet wavelet is complex and has similar characteristics to meteorological signs, such as symmetry or asymmetry and abrupt or mild temporal variation. These criteria are adopted for the use of wavelet for identification of variations in synoptic scales, intra-seasonal oscillations and among other meteorological variations (Weng & Lau, 1994). The Morlet function is defined by the following Equation 2.
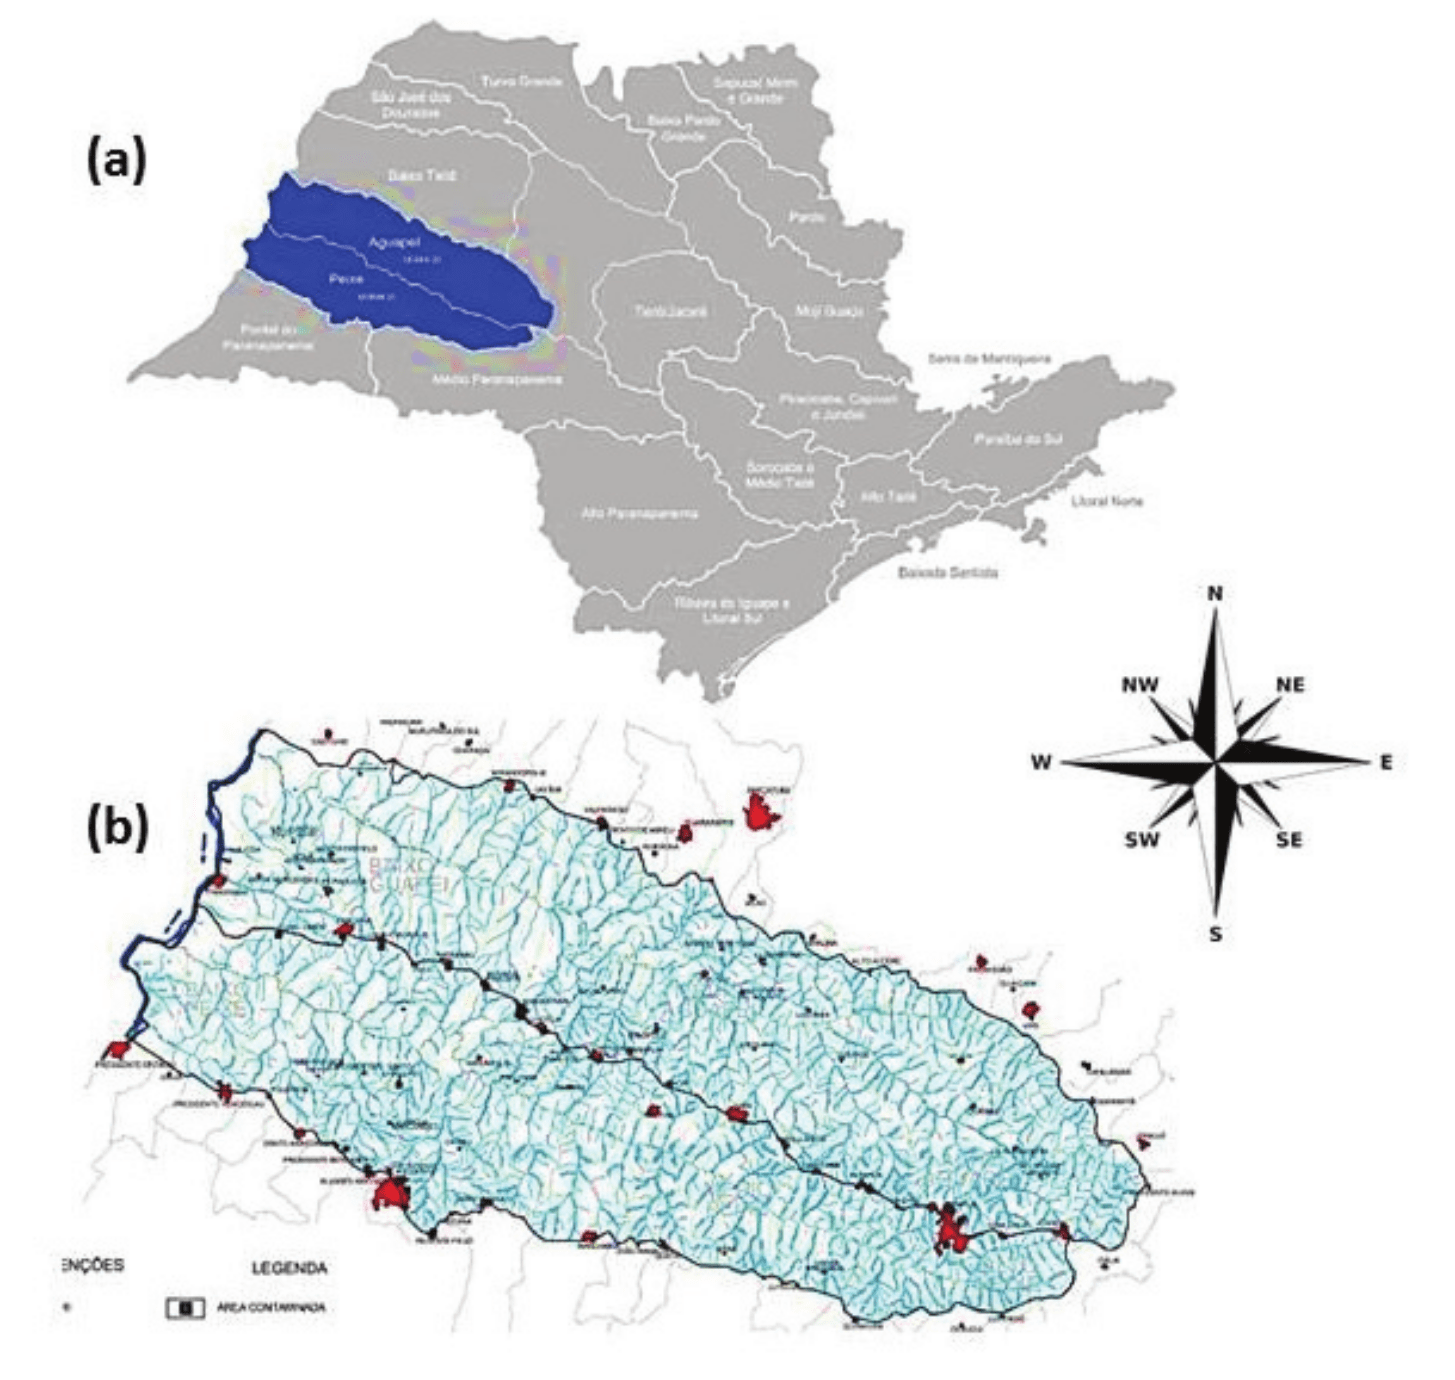
Figure 1.
(a) Aguapeí-Peixe River basin located in the western region of the State of São Paulo (b) Aguapeí-Peixe River basin.
 (2)
(2)Which represents a wave modulated by a Gaussian envelope. Where: i = parameter of expansion and compression of the wave; W0 = frequency parameter and t = time. All introduced into the programming script of Matlab Software, version R2017b, with license to ICAT/UFAL.
Due to the limit on the number of pages, only the figures referring to the wavelet spectra will be presented but not the figures of the Prp indices, which are also discussed together with the respective spectra.
Results and discussions
The temporal scales that influence the rainfall and the occurrence of extreme events in each rainfall station of the Aguapeí and Peixe rivers basins were identified through the application of the wavelet analysis.
The time scales identified were the approximately 22-year scale that is related to the PDO (Mantua, Hare, Zhang, Wallace, & Francis, 1997) and was dominant in all rainfall stations under study; the 2-7 year scale related to the ENSO signal; the 11-year scale, which is associated with the cycles of sunspots (Kerr, 1996; Molion, 2005) and also to the Atlantic Dipole (Servain, Wainer, Mccreary, & Dessier, 1991); however the performance of the Dipole is not verified directly influencing the rainfall in the SEB/SB. Finally, the occurrence of the seasonal scale of 0.25-0.5 years was identified.
These extreme events occurred mostly due to the simultaneous occurrence of several time scales as reported by Rockwood and Maddox (1988) or due to the occurrence of climatic phenomena in the same phase according to Gershunov and Barnett (1998).
In the Adamantina rainfall station (Figure 2a and b), the dominant peak on the 22-year scale occurred between 1963 and 1997. We also verified the presence of 11-year scales from 1960 to 1995, of 2-7 year from 1960 to 2013, and the seasonal scale of 0.25-0.5 years, which was the only one to present statistical significance (Figure 2c).
PDO was in the cold phase up to 1977 (Mantua et al., 1997), leading to a greater number of La Niña events, which resulted in a reduction in SB/SEB rainfall in some years of this period. In 1987 and 1992, the performance of the 22-year scale and the 2-7 year scale were observed, intensifying the seasonal scale and causing high rainfall indices in both years. For the years of 2007 and 2012, the high rainfall indices were due to the junction of the scale of 2-7 years and the scale of 0.25-0.5 years. It can be observed that the junction of different scales favors the variation in the rainfall index. Similar results were found by Gershunov and Barnett (1998), Silva et al. (2009), Silva and Silva (2016).
At the Bastos rainfall station (Figure 3a), the dominant PDO scale was predominant between 1973 and 2013 (Figures 3b and c). The 11-year scale was present in the series from 1958 to 1986. We also observed the 2-7 year and 0.25-0.5 year scales acting from 1958 to 2013. The years of 1961 and 1968 presented negative rainfall indices and the performance of the scale of 22 years in this period was not observed. The year 1961 was presented as a normal year and the years 1967/68 were classified as a Weak La Niña year (Wolter & Timlin, 1998); the sunspot cycle was in low activity in 1961 and in phase of increase of solar activity in 1968 (Njau, 2006). The interaction between scales unfavorable to rainfall led to the reduction of the seasonal scale causing negative peaks of rainfall.
In the rainfall station of Echaporã (Figure 4a), the dominant scale of approximately 22 years related to the ODP acted in the period from 1958 to 1982 (Figure 4b). It was verified the presence of the 11-year scale with predominance from 1965 to 1995, of the 2-7 year scale present in the whole series, and the seasonal scale of 0.25-0.5 years.
In the years 1962, 1979, 1992 and 2005, there was no association of favorable rainfall scales and consequently the weakening of the seasonal scale caused negative rainfall indices. In the years 1983, 1987, 1990, 1998 and 2007, the rainfall station of Echaporã presented positive rainfall indices due to the combination of the different time scales, for example, the year 1983, when the seasonal scale was more intense.
In the rainfall station of Emilianópolis (Figure 5a), the dominant peak in the 22-year scale occurred in the period 1958-2004 (Figure 5b). It was observed the presence of the 11-year scale with a predominance from 1959 to 1977, of the scale of 2-7 years and the seasonal scale of 0.25-0.5 years that occurred during the period with statistical significance (Figure 5c). In the years of 1960, 1964, 1972, 1976, 1998 and 2007, there were positive peaks of rainfall associated with the simultaneous presence of the scales of 22 years, 11 years and 2-7 years and the scale of 0.25-0.5 years, with the exception of the 11-year scale for 1998 and 2007. On the other hand, in the years 1979, 1985/86, 1991/92 and 2002, we noted that the absence of the seasonal scale caused negative rainfall peaks as discussed by Gershunov and Barnett (1998) and Silva and Silva (2016).
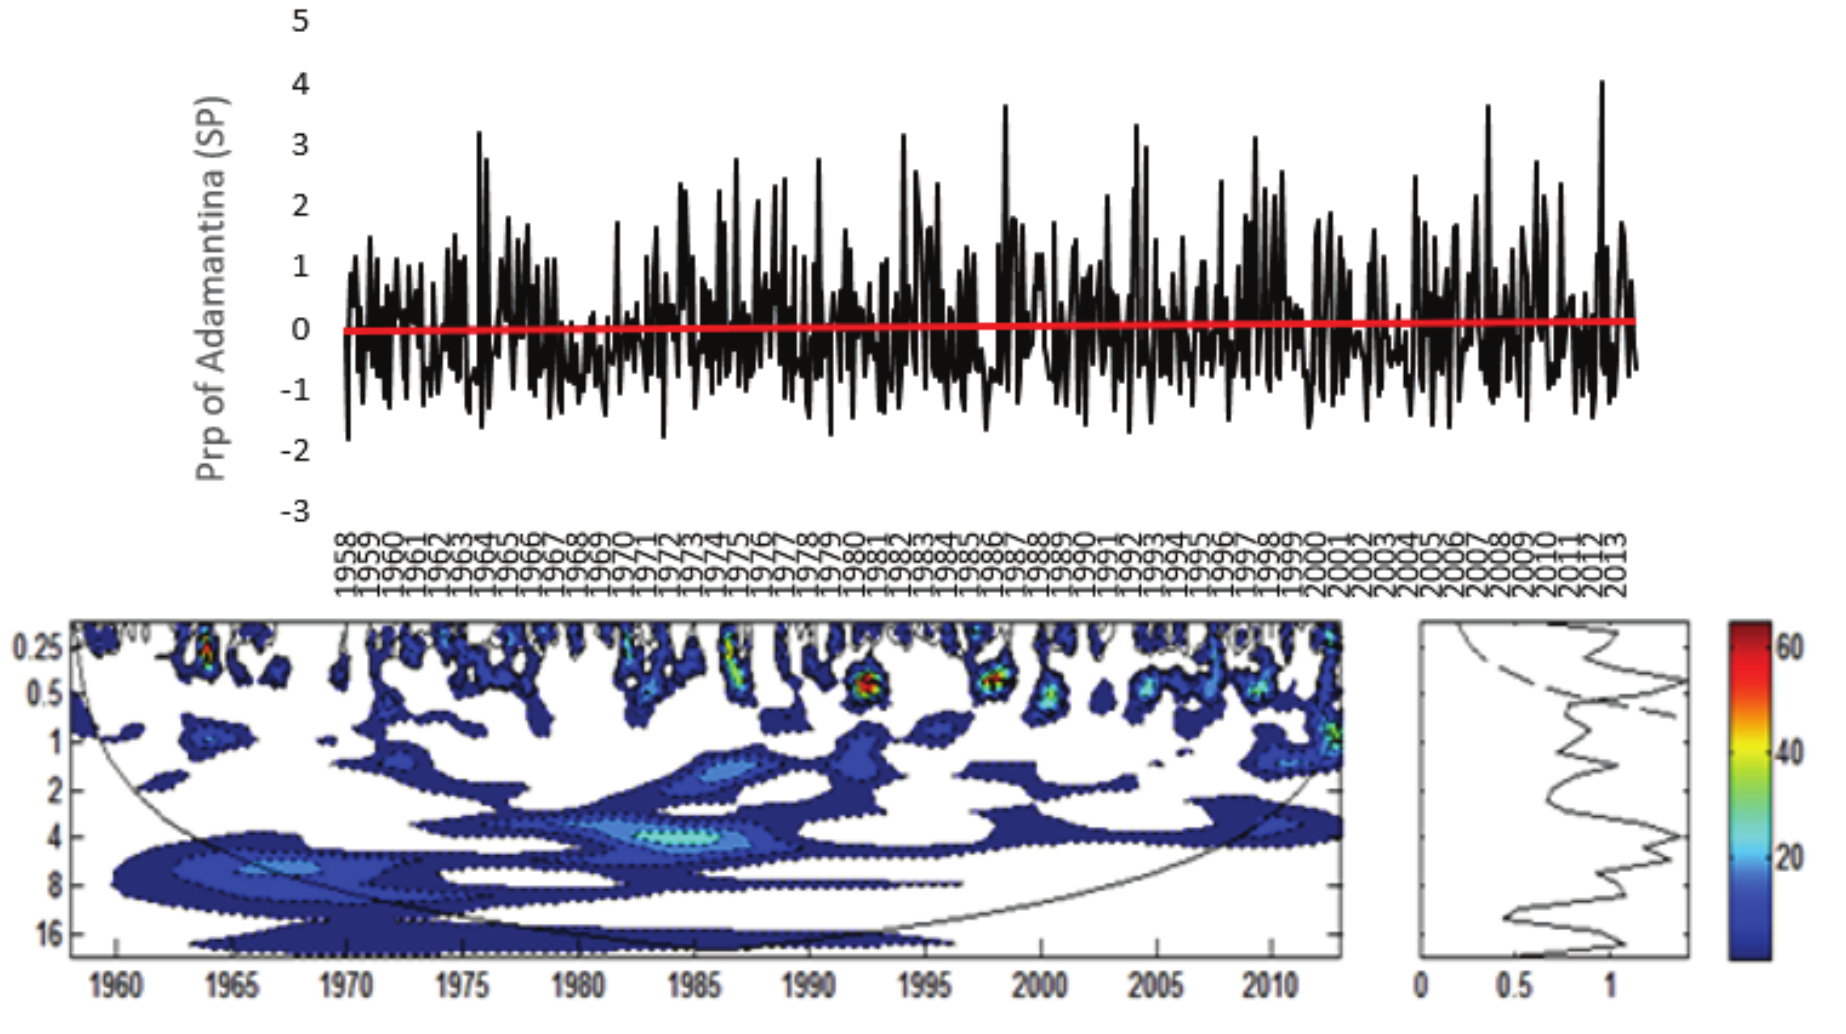
Figure 2.
a) Rainfall Index for Adamantine Rainfall Station (Prp) normalized by standard deviation; b) Local Energy Spectrum for Adamantina (Prp); Shaded contours correspond to normalized variances significant at the 5% level. The U-shaped curve represents the cone of influence, under which the edge effect is important. c) Wavelet Global Spectrum, the dashed contour indicates that the Wavelet Global Spectrum is significant at 95% level. Attention: In Figure B) Axis Y: Period (years); Axis X: Time (years); in Figure C) Axis X: Variance.
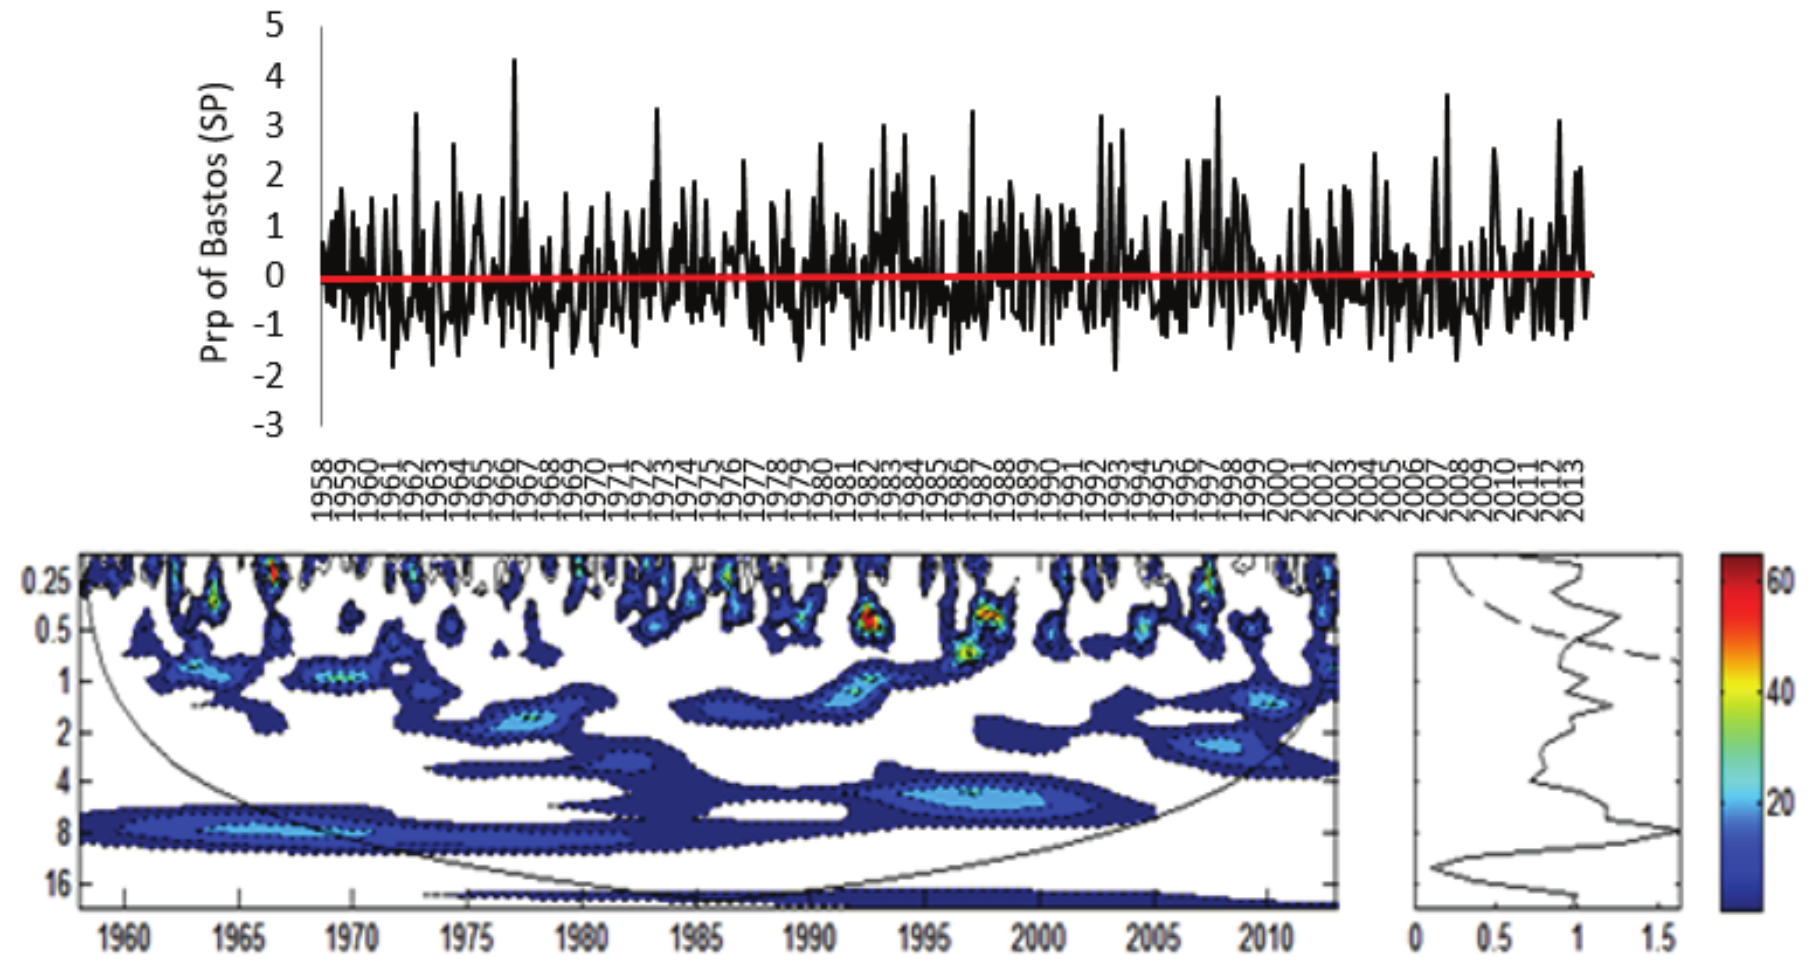
Figure 3.
a) Rainfall Index for Bastos Rainfall Station (Prp) normalized by standard deviation; b) Local Energy Spectrum for Bastos (Prp); Shaded contours correspond to normalized variances significant at the 5% level. The U-shaped curve represents the cone of influence, under which the edge effect is important. c) Wavelet Global Spectrum, the dashed contour indicates that the Wavelet Global Spectrum is significant at 95% level. Attention: In Figure B) Axis Y: Period (years); Axis X: Time (years); in Figure C) Axis X: Variance.
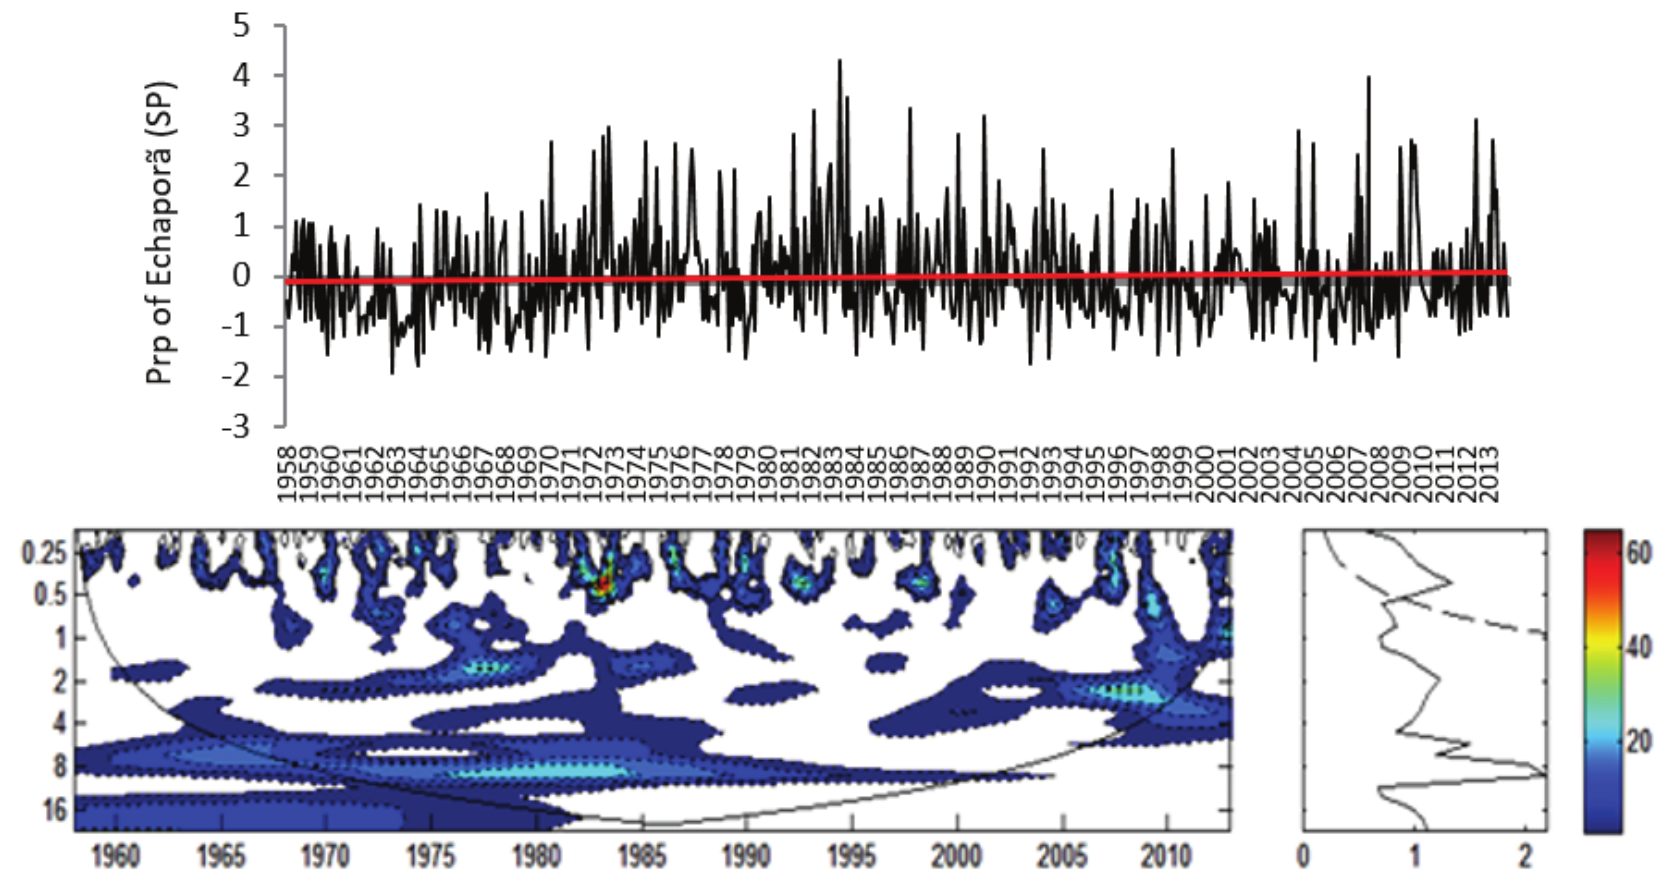
Figure 4.
a) Rainfall Index for Echaporã Rainfall Station (Prp) normalized by standard deviation; b) Local Energy Spectrum for Echaporã (Prp); Shaded contours correspond to normalized variances significant at the 5% level. The U-shaped curve represents the cone of influence, under which the edge effect is important. c) Wavelet Global Spectrum, the dashed contour indicates that the Wavelet Global Spectrum is significant at 95% level. Attention: In Figure B) Axis Y: Period (years); Axis X: Time (years); in Figure C) Axis X: Variance.
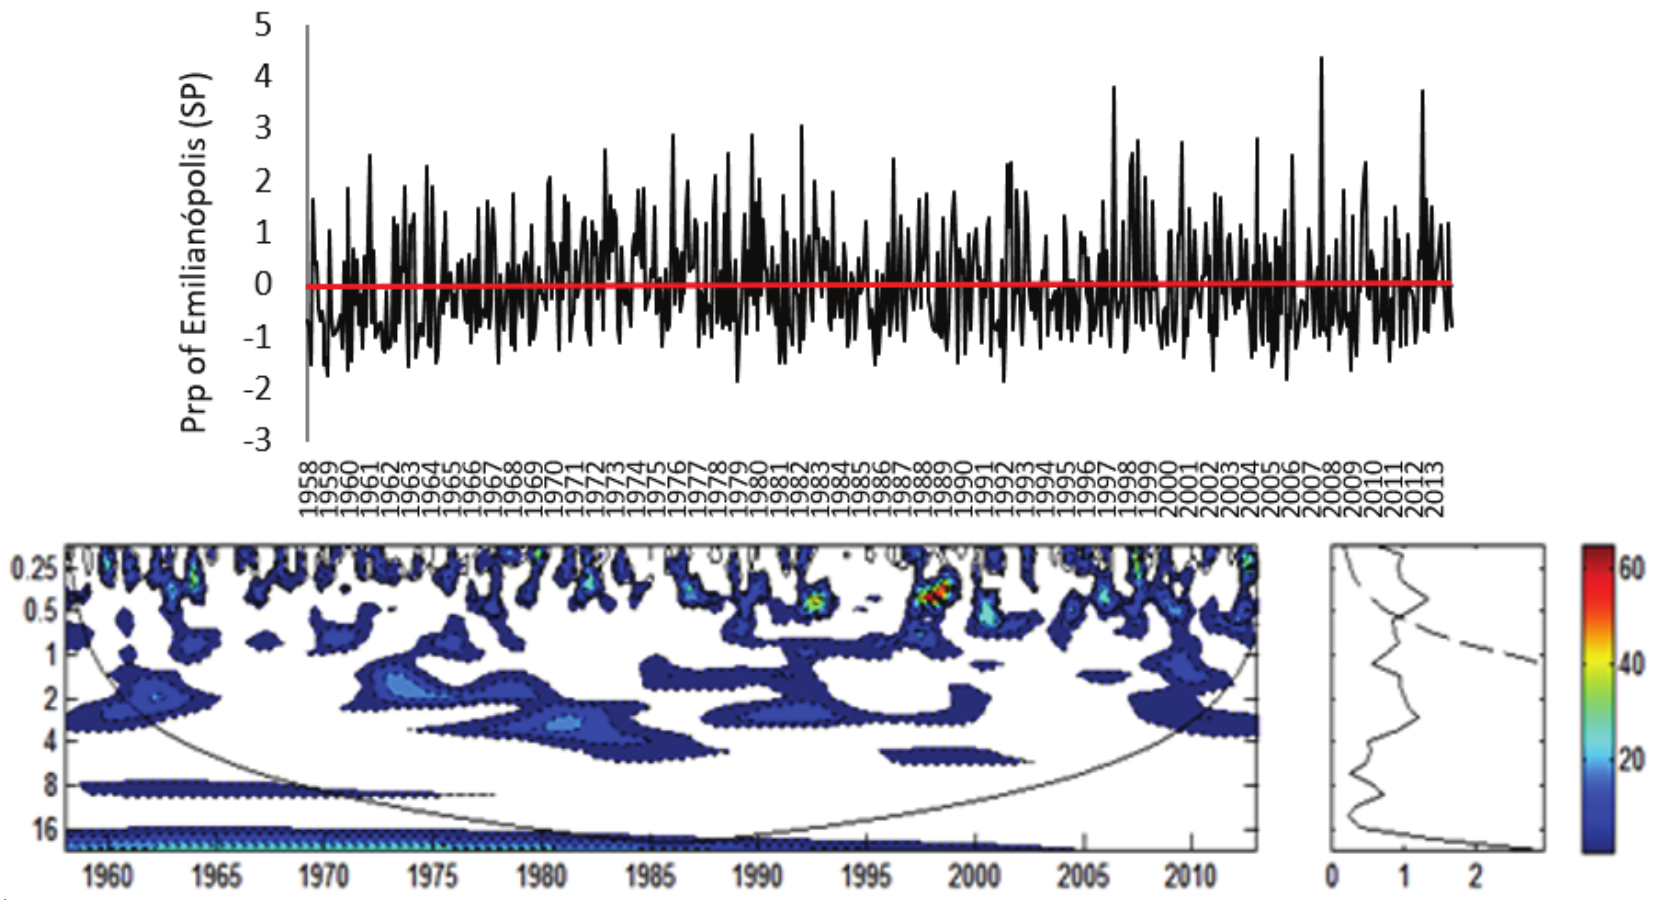
Figure 5
a) Rainfall Index for Emilianópolis Rainfall Station (Prp) normalized by standard deviation; b) Local Energy Spectrum for Emilianópolis (Prp); Shaded contours correspond to normalized variances significant at the 5% level. The U-shaped curve represents the cone of influence, under which the edge effect is important. c) Wavelet Global Spectrum, the dashed contour indicates that the Wavelet Global Spectrum is significant at 95% level. Attention: In Figure B) Axis Y: Period (years); Axis X: Time (years); in Figure C) Axis X: Variance.
The rainfall station of Marília (Figure 6a) showed a dominant peak on the 22-year scale occurring between 1958 and 1998 (Figure 6b), but with no statistical significance (Figure 6c). The 11-year scale acted from 1965 to 1995, with the most intense phase concentrated between 1975 and 1985. The scale of 2-7 years and the seasonal scale of 0.25-0.5 years were also observed.
The years 1978, 1983/84, 1992, 2000, 2007 and 2012 presented the highest rainfall indices. The association between the scales of 22 years, 11 years and 2-7 years intensified the seasonal scale of 0.25-0.5 years, except for the years after 1998, in which we observed the absence of the scale of 22 years and of 11 years, but the interaction of the scale of 2-7 years with the seasonal scale occurred.
In the rainfall station of Osvaldo Cruz (Figure 7a), the dominant 22-year scale was persistent in the period from 1974 to 2013 (Figure 7b). The 11-year scale occurred in the period 1958-2003, the secondary scale of 2-7 years and the seasonal scale of 0.25-0.5 years were present in the series (Figures 7b and c).
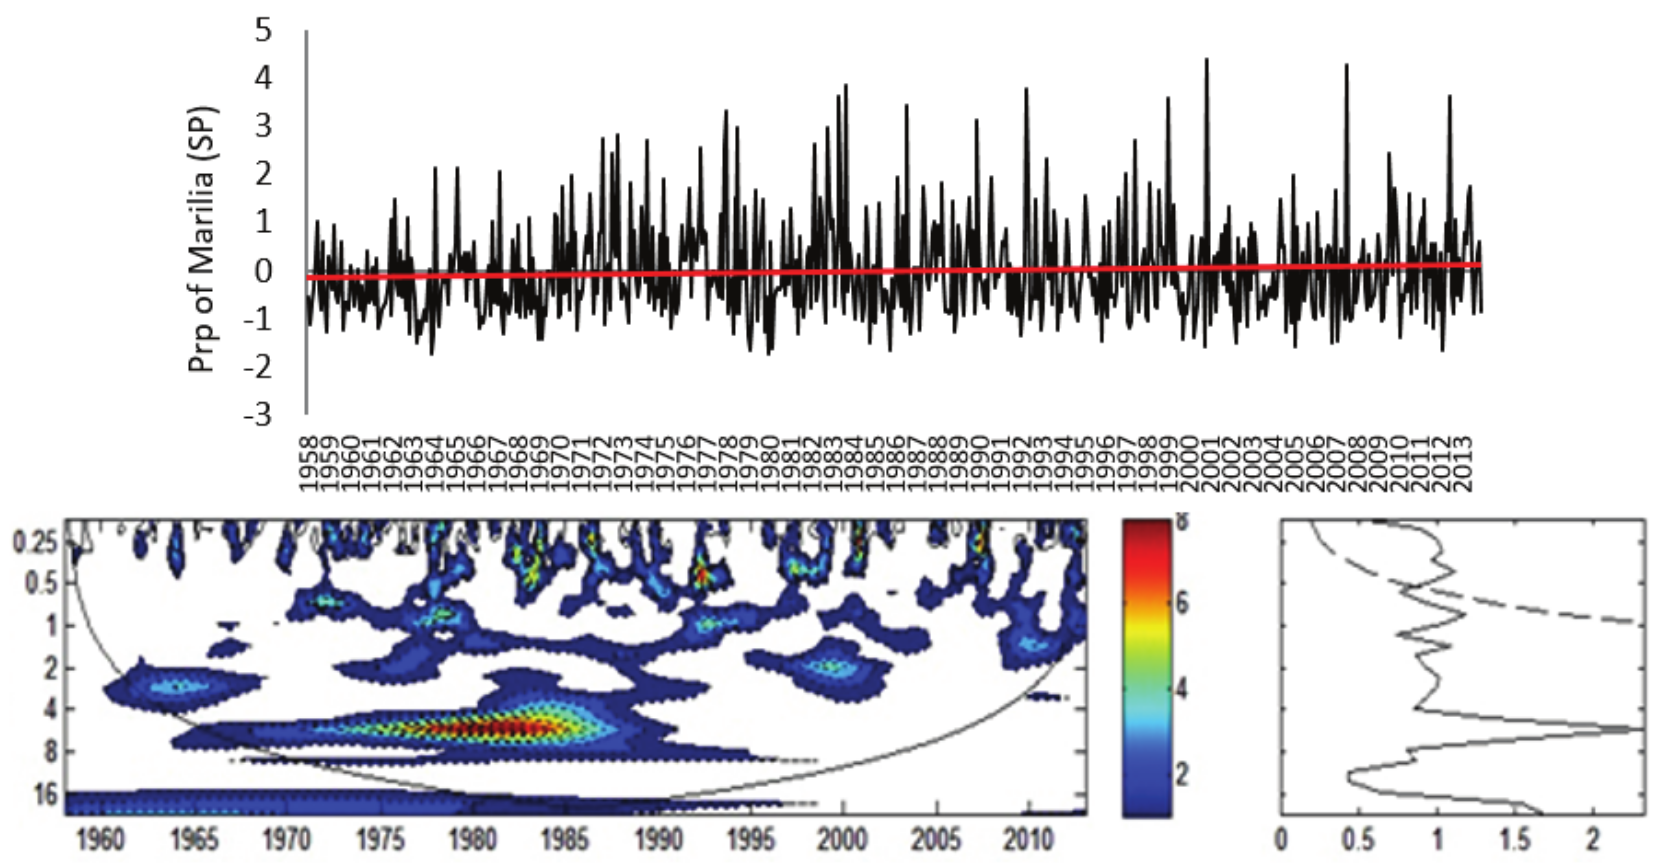
Figure 6.
a) Rainfall Index for Marília Rainfall Station (Prp) normalized by standard deviation; b) Local Energy Spectrum for Marília (Prp); Shaded contours correspond to normalized variances significant at the 5% level. The U-shaped curve represents the cone of influence, under which the edge effect is important. c) Wavelet Global Spectrum, the dashed contour indicates that the Wavelet Global Spectrum is significant at 95% level. Attention: In Figure B) Axis Y: Period (years); Axis X: Time (years); in Figure C) Axis X: Variance.
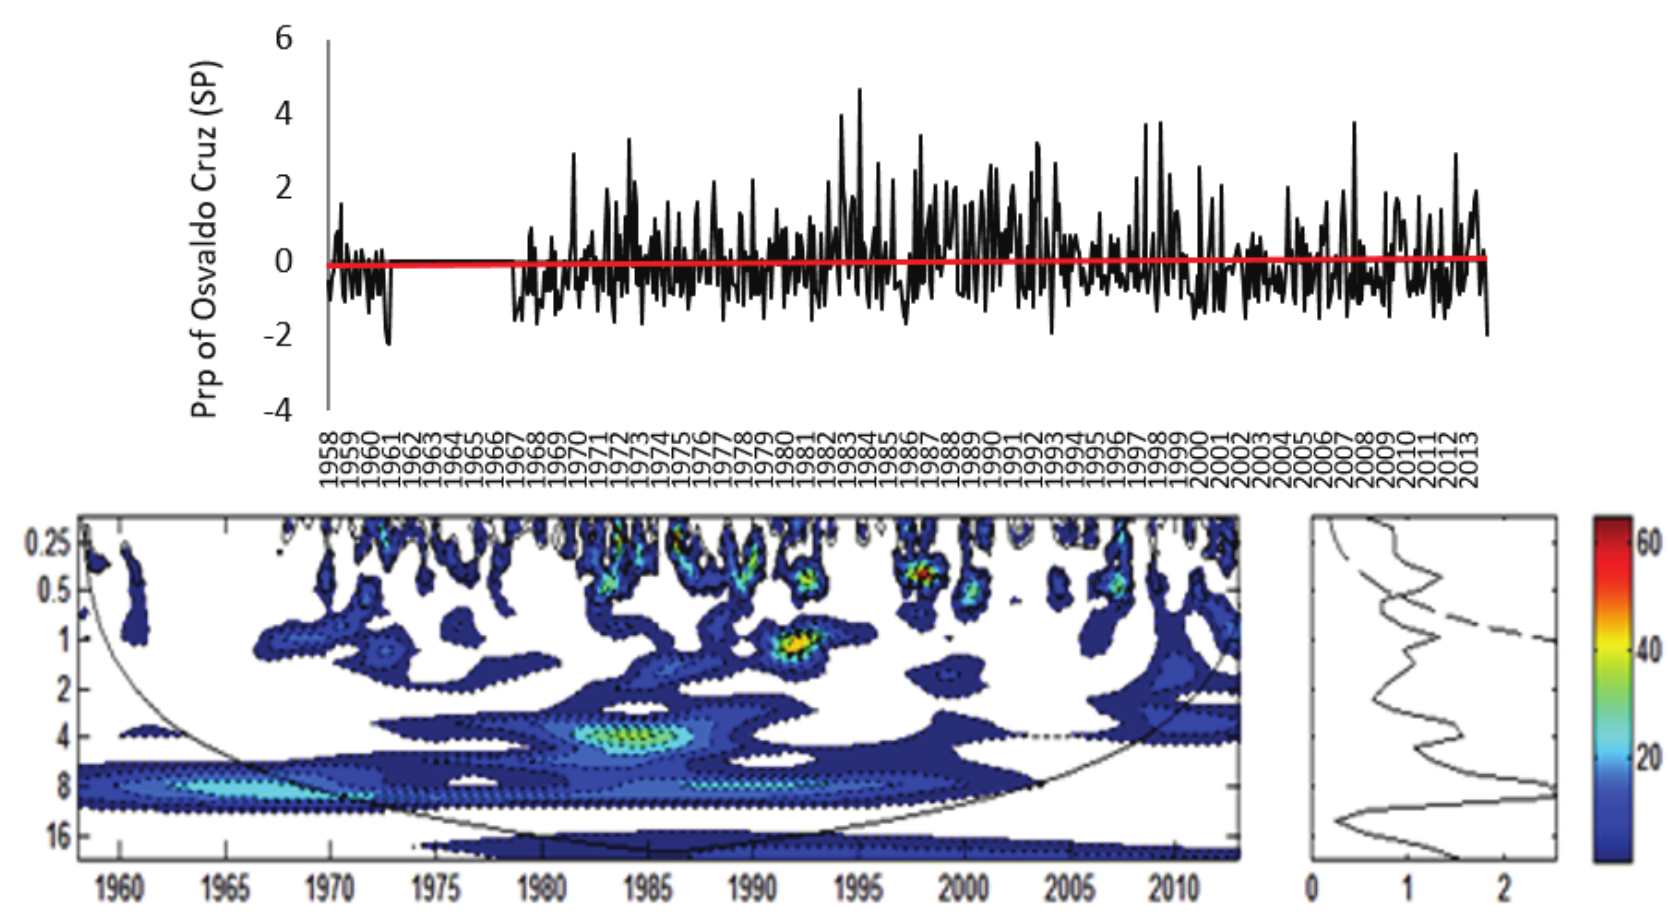
Figure 7.
a) Rainfall Index for Osvaldo Cruz Rainfall Station (Prp) normalized by standard deviation; b) Local Energy Spectrum for Osvaldo Cruz (Prp); Shaded contours correspond to normalized variances significant at the 5% level. The U-shaped curve represents the cone of influence, under which the edge effect is important. c) Wavelet Global Spectrum, the dashed contour indicates that the Wavelet Global Spectrum is significant at 95% level. Attention: In Figure B) Axis Y: Period (years); Axis X: Time (years); in Figure C) Axis X: Variance.
In the interval between 1961 and 1967 there was a lack of available rainfall data in the rainfall station of Osvaldo Cruz, and it was necessary to apply normalized averages since it is the prp index, so as not to underestimate or overestimate the results.
According to Gershunov and Barnett (1998), the union of different time scales causes high rainfall peaks as noted in the years 1983, 1986, 1992, 1998 and 2007 when they were associated with the scales of 22 years, 11 years and 2-7 years and the scale of 0.25-0.5 years.
It was detected the absence of the seasonal scale in the years of 1993, 2000 and 2009, causing negative indices of rainfall. For 1993, there were interactions not favorable to rainfall due to opposite phases of climatic phenomena (sunspot cycle and Enso). In turn, in 2000 there, was interaction of the PDO with Enos, which was in the cold phase providing strong La Niña years.
The rainfall station of Presidente Prudente (Figure 8a) had a dominant peak in the 22-year scale, but was not significant at the 95% level. The scales of 11 years, 2-7 years and the scale of 0.25-0.5 years were observed. The 11-year scale was present in the period from 1965 to 1978 (Figure 8b), the scale of 2-7 years and the scale of 0.25-0.5 years corresponding to the seasonal scale were also present in the series.
The years 1967 and 1974/75 showed negative peaks of rainfall. The 11-year scale and the 2-7 year scale acted simultaneously reducing rainfall. The sunspot cycle showed minimal solar activity for the years cited ( Njau, 2006) and the ENOS signal set up as La Niña years and normal year (Wolter & Timlin, 1998).
The dominant 22-year PDO-related scale in the rainfall station of Presidente Venceslau (Figure 9a) prevailed between 1958 and 2000 (Figure 9a). The 11-year scale was also noticed, occurring from 1963 to 1995; the scale of 2-7 years was present in the whole series as well as the seasonal scale of 0.25-0.5 years.
The rainfall station of Presidente Venceslau presented a lack of rainfall data from 1999 to 2001, being necessary the application of normalized averages since it is the prp index, so as not to underestimate or overestimate the results.
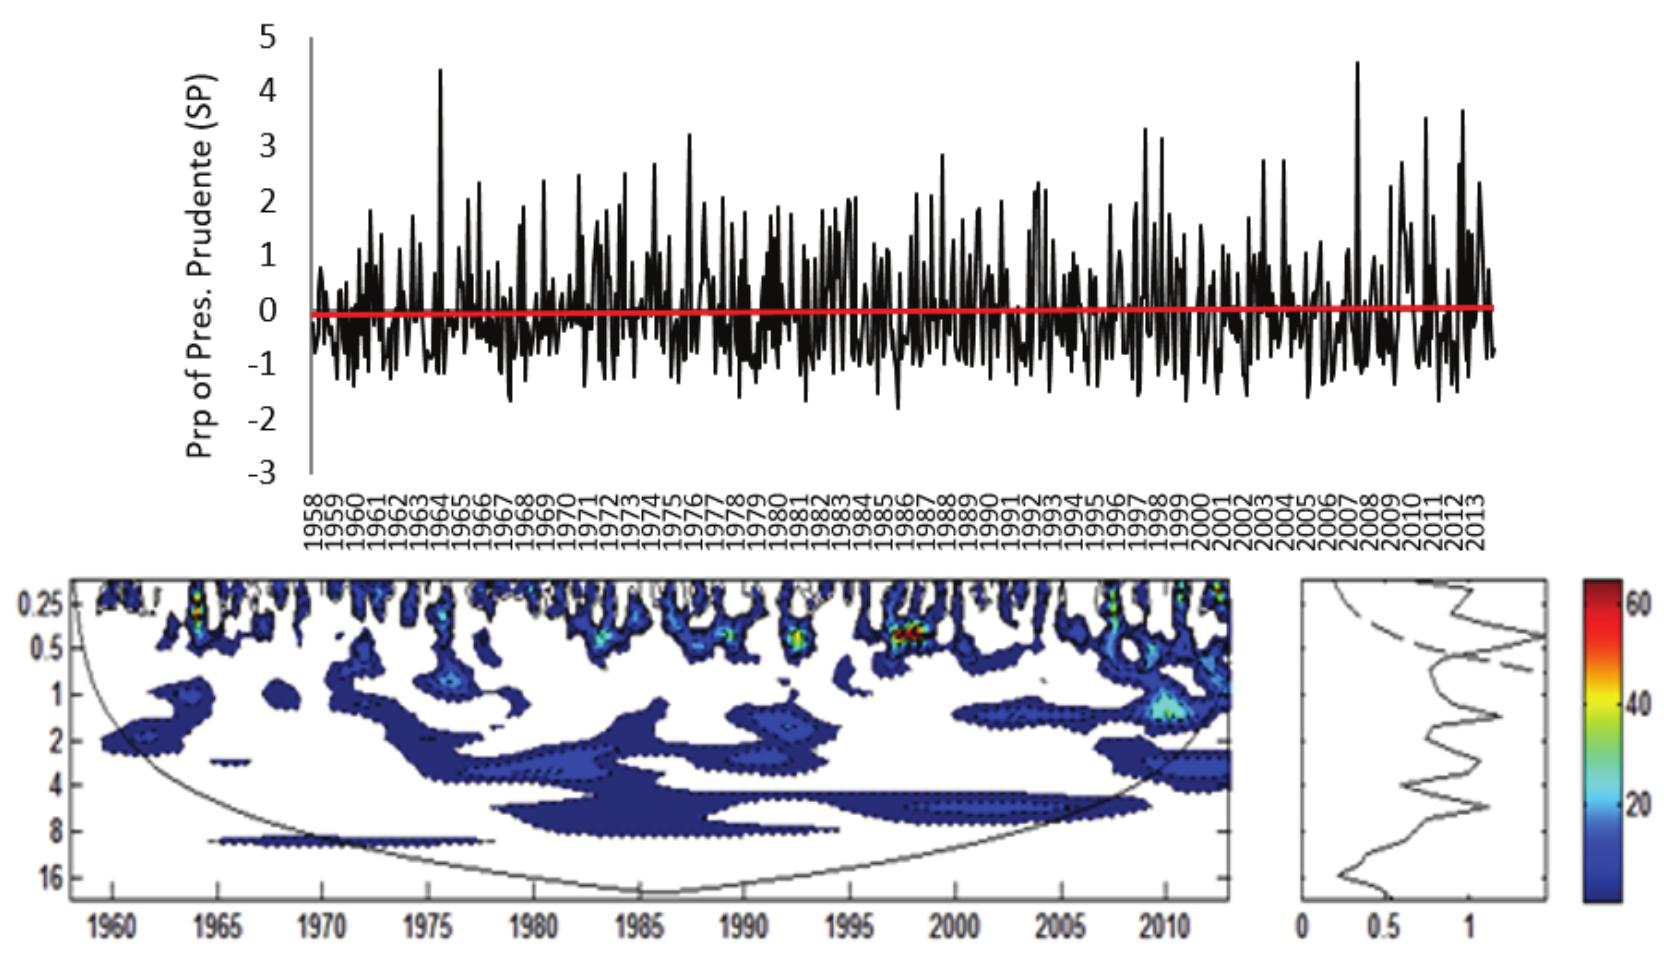
Figure 8.
a) Rainfall Index for Presidente Prudente Rainfall Station (Prp) normalized by standard deviation; b) Local Energy Spectrum for Presidente Prudente (Prp); Shaded contours correspond to normalized variances significant at the 5% level. The U-shaped curve represents the cone of influence, under which the edge effect is important. c) Wavelet Global Spectrum, the dashed contour indicates that the Wavelet Global Spectrum is significant at 95% level. Attention: In Figure B) Axis Y: Period (years); Axis X: Time (years); in Figure C) Axis X: Variance.
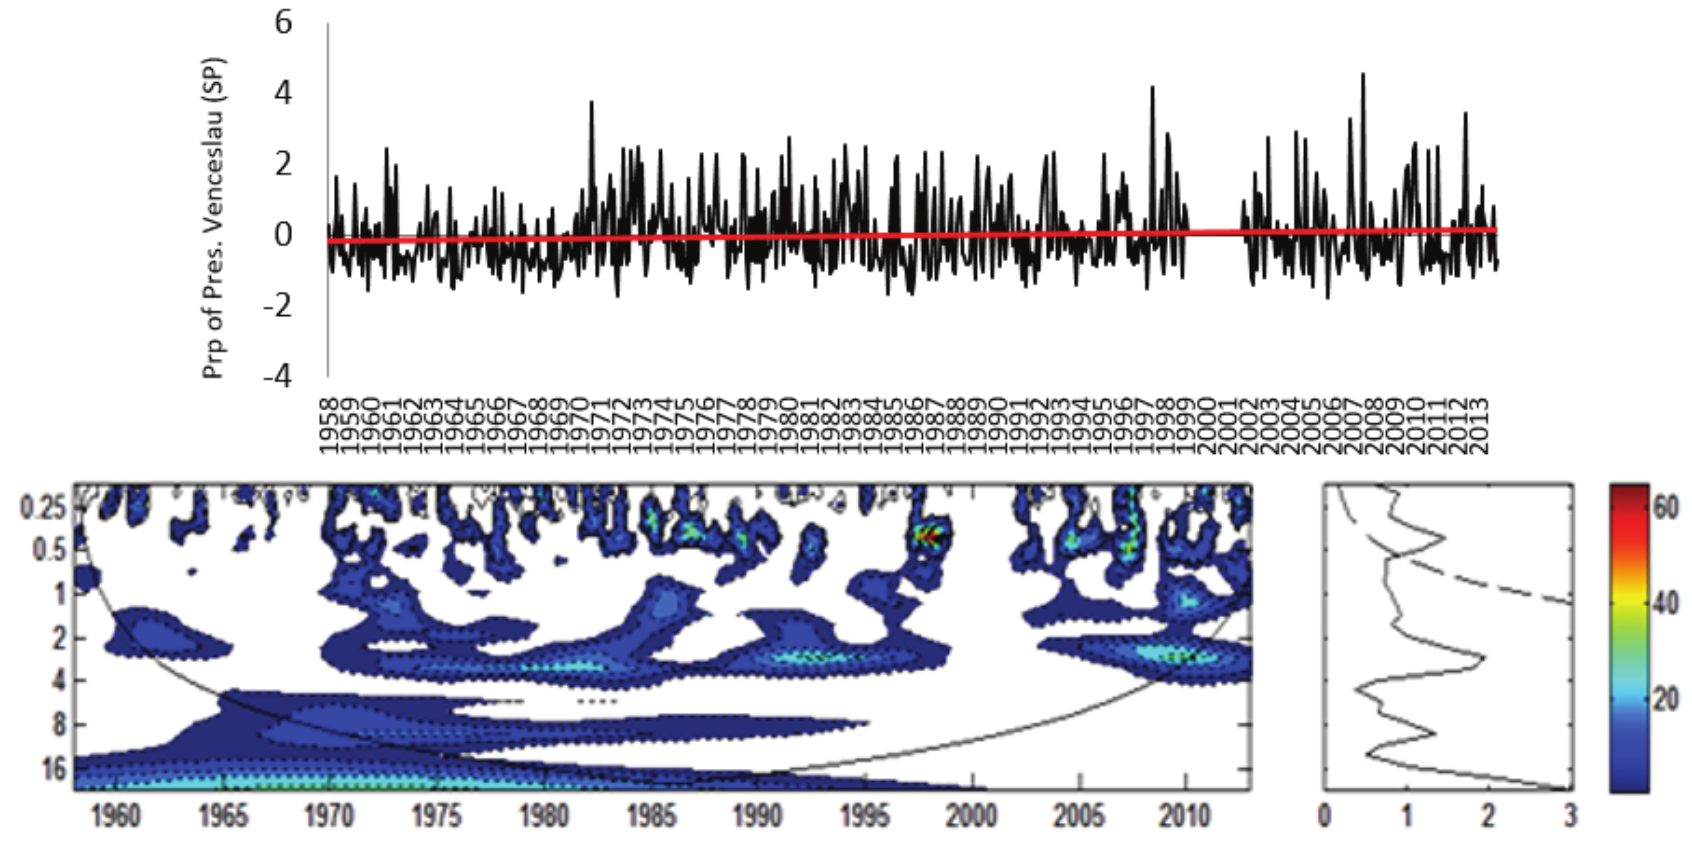
Figure 9.
a) Rainfall Index for Presidente Venceslau Rainfall Station (Prp) normalized by standard deviation; b) Local Energy Spectrum for Presidente Venceslau (Prp); Shaded contours correspond to normalized variances significant at the 5% level. The U-shaped curve represents the cone of influence, under which the edge effect is important. c) Wavelet Global Spectrum, the dashed contour indicates that the Wavelet Global Spectrum is significant at 95% level. Attention: In Figure B) Axis Y: Period (years); Axis X: Time (years); in Figure C) Axis X: Variance.
The years 1970/71 and 1997/98 presented a high rainfall index characterized by the association of the scales of 22 years, 11 years, 2-7 years and 0.25-0.5 years. The seasonal scale was more intense for 1998 (Figure 9b). In turn, for the year 2007 the interaction of the scales occurred by the presence of the scales of 2-7 years and the seasonal scale, raising the rainfall. The PDO remained in the cold phase until 1977 when it remained in the opposite phase until 1998.
In the rainfall station of Rancharia (Figure 10a), the dominant 22-year scale occurred between 1958 and 1998 (Figure 10b). We observed the 11-year scale from 1963 to 2011, the scale of 2-7 years and the seasonal scale of 0.25-0.5 years, which was statistically significant (Figure 10c).
In the years 1972/73, 1982, 1992 and 1997/98, positive rainfall anomalies were found, characterized by the association of the seasonal scale, with the 2-7-year scale, the 11-year scale and the 22-year scale. The rainfall extremes in 2000 and 2007, for example, occurred by joining the 11-year and 2-7-year time scales, leading to intensification of the seasonal scale, potentiating local rainfall totals, as suggested by Rockwood and Maddox (1988) and Gershunov and Barnett (1998).
In the rainfall station of Clementina (Figure 11a), the dominant peak in the 22-year scale ran from 1958 to 1981 (Figure 11b). The scales 11-year predominated from 1986 to 2013, the 2-7 year scale, between 1961 and 2013, and the 0.25-0.5 year seasonal scale, presenting statistical significance (Figure 11c).
The PDO was in the cold phase until 1977 leading to more La Niña events, reducing rainfall in the region; after this period, the hot phase was set, where events of El Niño became more frequent and intense (Mantua et al., 1997). In the years 1968, 1975, 1979 and 2000, there were negative rainfall peaks associated with the scales of 22 years and 2-7 years, except for the year 2000, when the interaction occurs through the scales of 11 years and 2-7 years. The interaction of scales with opposite phases led to a reduction in rainfall indices according to the study by Gershunov and Barnett (1998).
In the rainfall station of Castilho (Figure 12a), the dominant peak of the PDO scale (22 years) occurred between 1958 and 1996, showing more intense between 1962 and 1978 (Figure 12b), but it was not statistically significant (Figure 12c). The 11-year scale occurred from 1959 to 2002, the 2-7 year scale occurred throughout the series, and the seasonal scale of 0.25-0.5 years was also observed.
In agreement with Gershunov and Barnett (1998), the combination of temporal scales with opposite trends reduces rainfall as can be seen in the years 1960, 1964, 1986, when the association of the scales of 22 years, 11 years and 2-7 years beyond the absence of the seasonal scale, provided dry years. The years 2005 and 2011 also presented reduced rainfall indices, however caused by the lack of association of time scales, since there was no presence of the scales of 22 years and 11 years, corroborating with the result reported by Silva and Silva (2016).
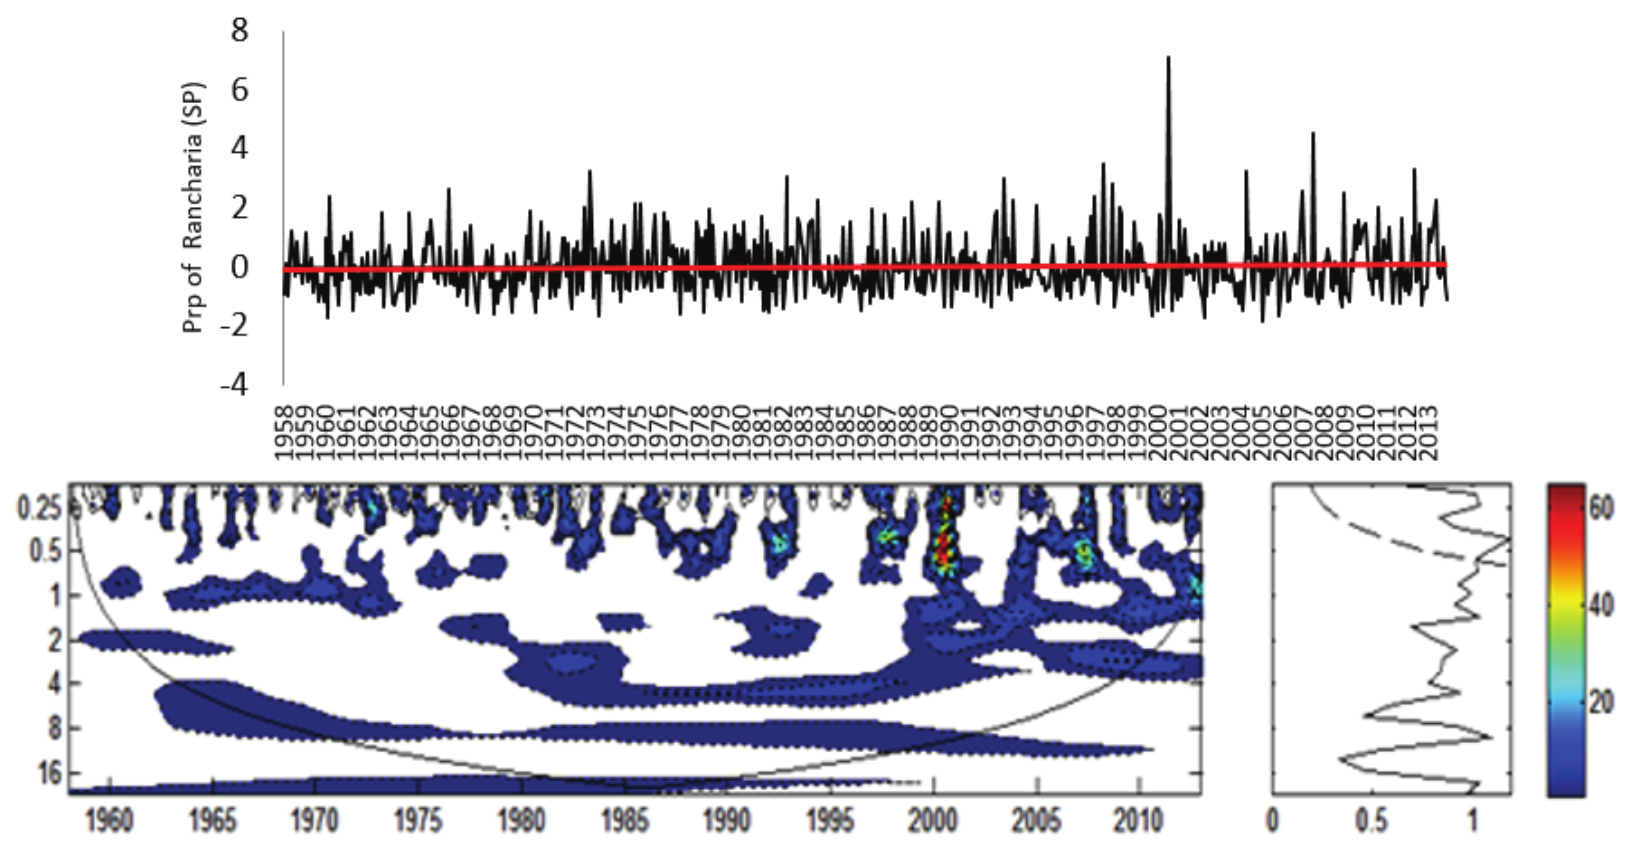
Figure 10.
a) Rainfall Index for Rancharia Rainfall Station (Prp) normalized by standard deviation; b) Local Energy Spectrum for Rancharia (Prp); Shaded contours correspond to normalized variances significant at the 5% level. The U-shaped curve represents the cone of influence, under which the edge effect is important. c) Wavelet Global Spectrum, the dashed contour indicates that the Wavelet Global Spectrum is significant at 95% level. Attention: In Figure B) Axis Y: Period (years); Axis X: Time (years); in Figure C) Axis X: Variance.
The dominant scale that occurred from 1958 to 1993 (Figure 13a) in the rainfall station of Dracena was the 22-year scale that is linked to PDO (Mantua et al., 1997). We observed the scale of 11 years, predominating in the period from 1975 to 1998, the scale of 2-7 years and the seasonal scale of 0.25-0.5 years.
The years 1978, 1982 and 1998 presented a high rainfall index associated with the interaction of the 22-year, 11-year, 2-7-year and 0.25-0.5 year scales. In the years of 1972 and 1998, it was possible to notice a greater intensity in the seasonal scale (Figure 13a). In addition, it is important to note that for these cited years, the ENSO signal has been shown to be an El Niño year (Wolter & Timlin, 1998), the sunspot cycle was in the phase of increased solar activity (Araya, Bonatti, & Fernandez, 2000; Njau, 2006). The associations of the different scales induced the occurrence of the increase of the rainfall index, resulting in rainy years, as also affirmed by Rockwood and Maddox (1988), Silva et al. (2009) and Silva and Silva (2016).
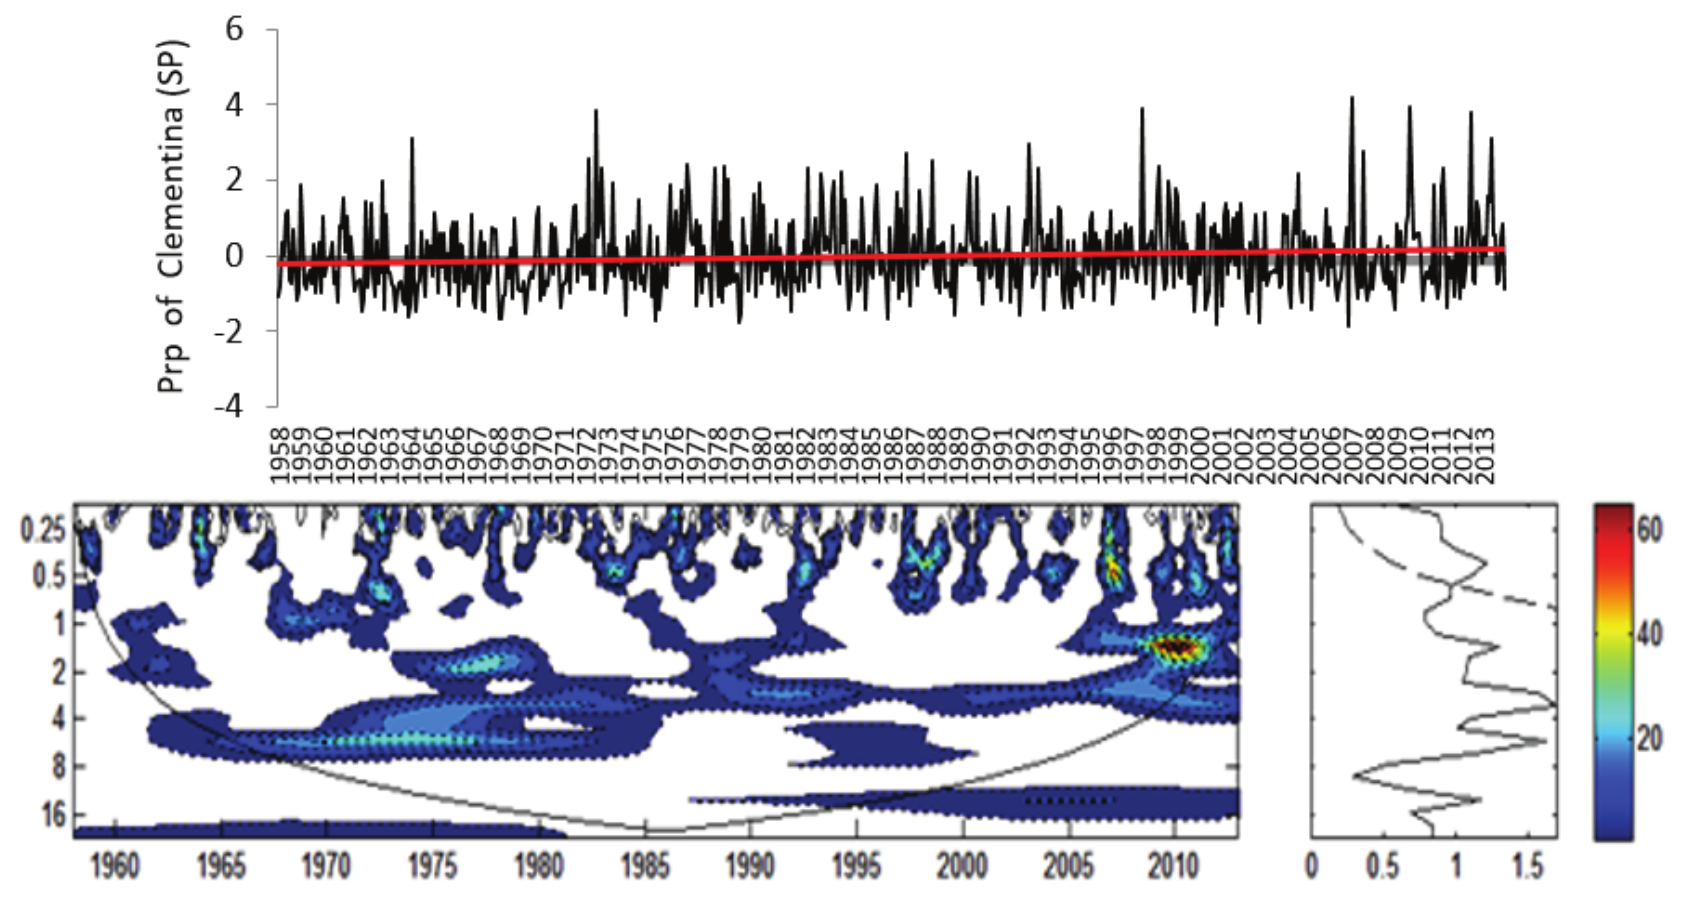
Figure 11.
a) Rainfall Index for Clementina Rainfall Station (Prp) normalized by standard deviation; b) Local Energy Spectrum for Clementina (Prp); Shaded contours correspond to normalized variances significant at the 5% level. The U-shaped curve represents the cone of influence, under which the edge effect is important. c) Wavelet Global Spectrum, the dashed contour indicates that the Wavelet Global Spectrum is significant at 95% level. Attention: In Figure B) Axis Y: Period (years); Axis X: Time (years); in Figure C) Axis X: Variance.
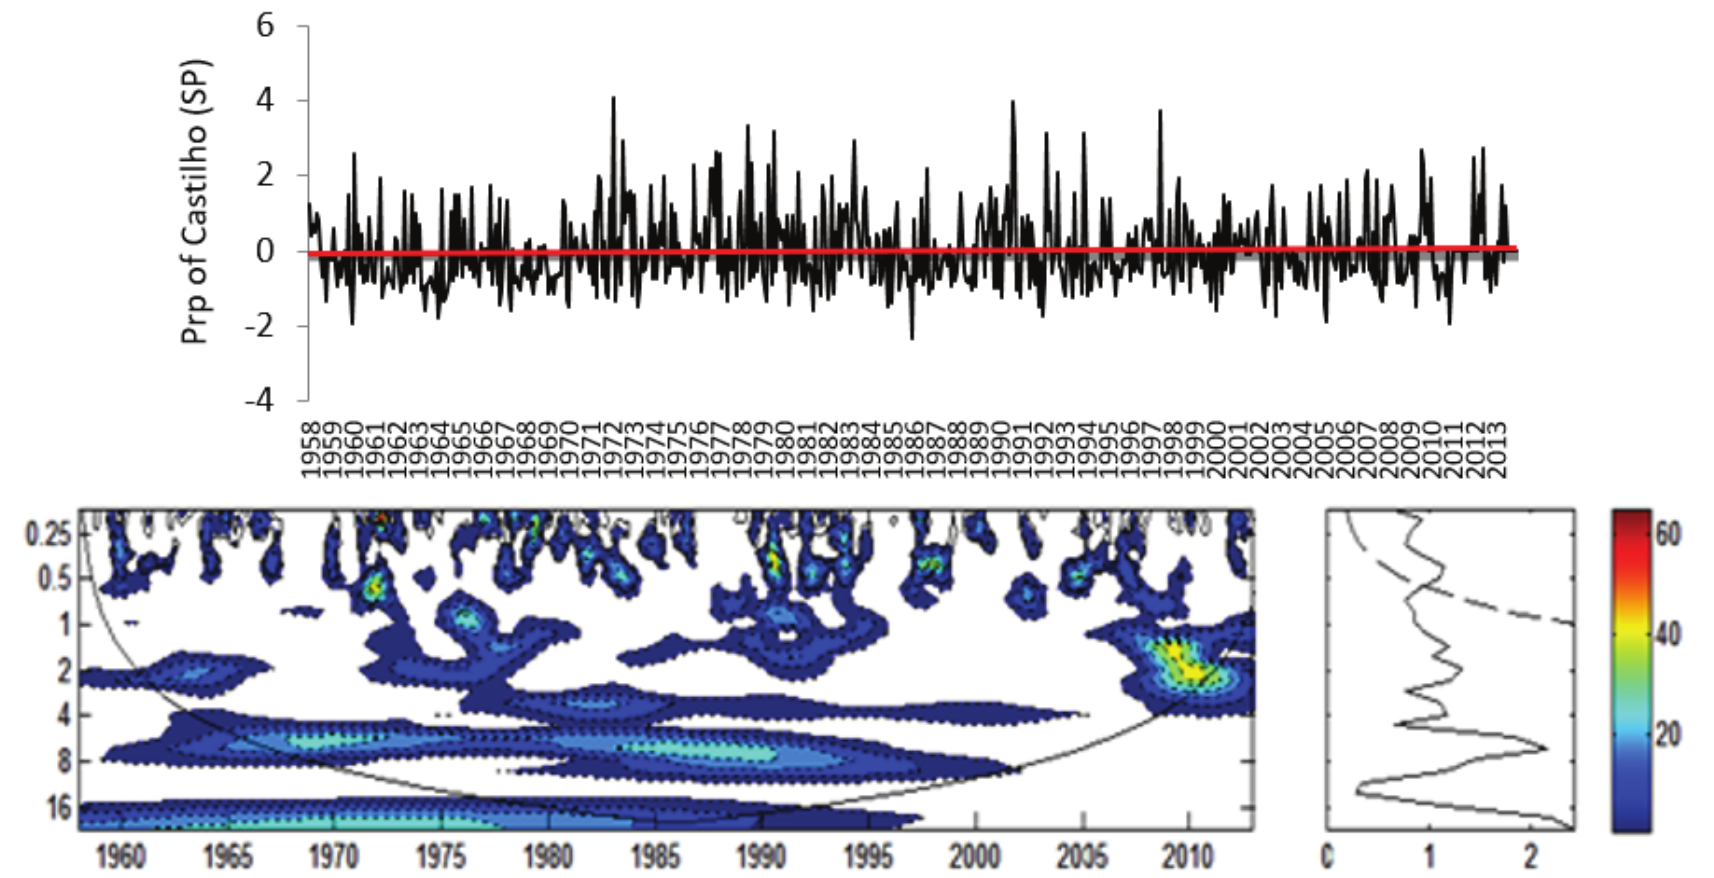
Figure 12.
a) Rainfall Index for Castilho Rainfall Station (Prp) normalized by standard deviation; b) Local Energy Spectrum for Castilho (Prp); Shaded contours correspond to normalized variances significant at the 5% level. The U-shaped curve represents the cone of influence, under which the edge effect is important. c) Wavelet Global Spectrum, the dashed contour indicates that the Wavelet Global Spectrum is significant at 95% level. Attention: In Figure B) Axis Y: Period (years); Axis X: Time (years); in Figure C) Axis X: Variance.
In the rainfall station of Garça (Figure 14), the dominant peak in the 22-year scale was present throughout the series. The other scales observed in the local energy spectrum were the 11-year scale that predominated from 1965 to 1975 and from 1998 to 2013, the 2-7 year scale, more intense between 1975 and 1985 and the seasonal scale of 0.25-0.5 years.
We registered positive rainfall anomalies for the years 1962, 1978, 1983, 1987, 1992 and 1998, which are related to the association of temporal scales of 22 years and 2-7 years (PDO and Enso). For the years 2007 and 2012, the interaction of all scales including the 11-year scale was detected. In all these years, the seasonal scale of 0.25-0.5 years was more intense and according to Wolter and Timlin (1998), all the years cited were years of El Niño and normal year in 1962.
In the rainfall station of Getulina (Figure 15a), the dominant peak in the 22-year scale was verified in the local energy spectrum occurring between 1958 and 1981 (Figure 15b). We also observed the presence of the 11-year scale, in the period 1990-2004, and the 2-7 year scale, predominant throughout the series, but with a greater intensity between 1970 and 1984, and the seasonal scale of 0.25- 0.5 years.
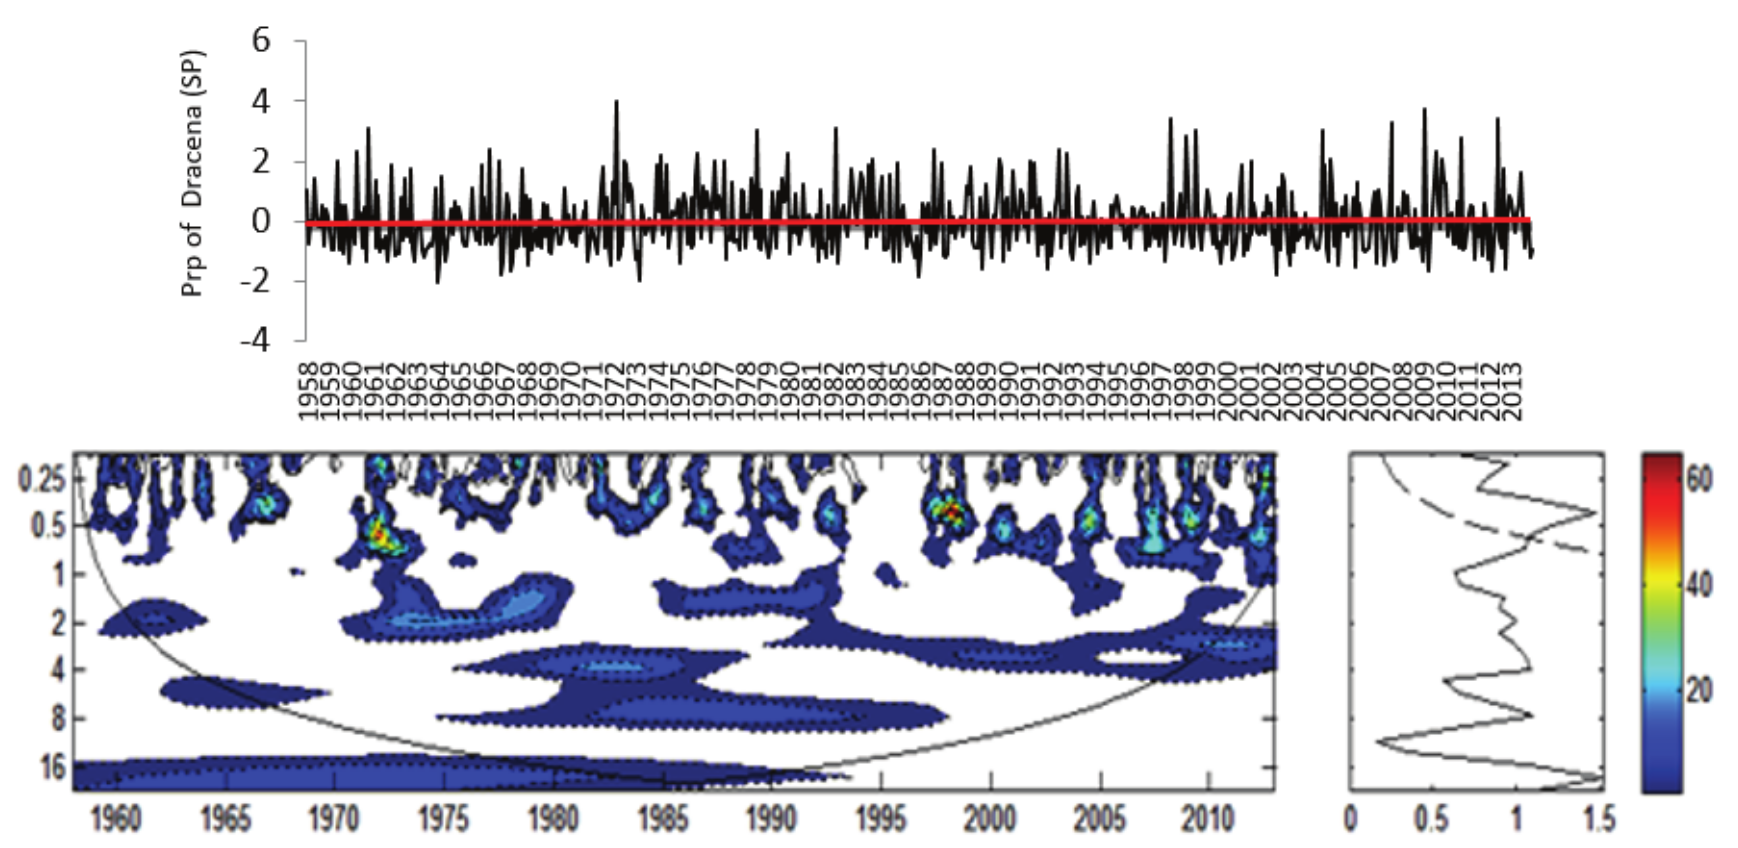
Figure 13.
a) Rainfall Index for Dracena Rainfall Station (Prp) normalized by standard deviation; b) Local Energy Spectrum for Dracena (Prp); Shaded contours correspond to normalized variances significant at the 5% level. The U-shaped curve represents the cone of influence, under which the edge effect is important. B) Wavelet Global Spectrum, the dashed contour indicates that the Wavelet Global Spectrum is significant at 95% level. Attention: In Figure B) Axis Y: Period (years); Axis X: Time (years); in Figure C) Axis X: Variance.
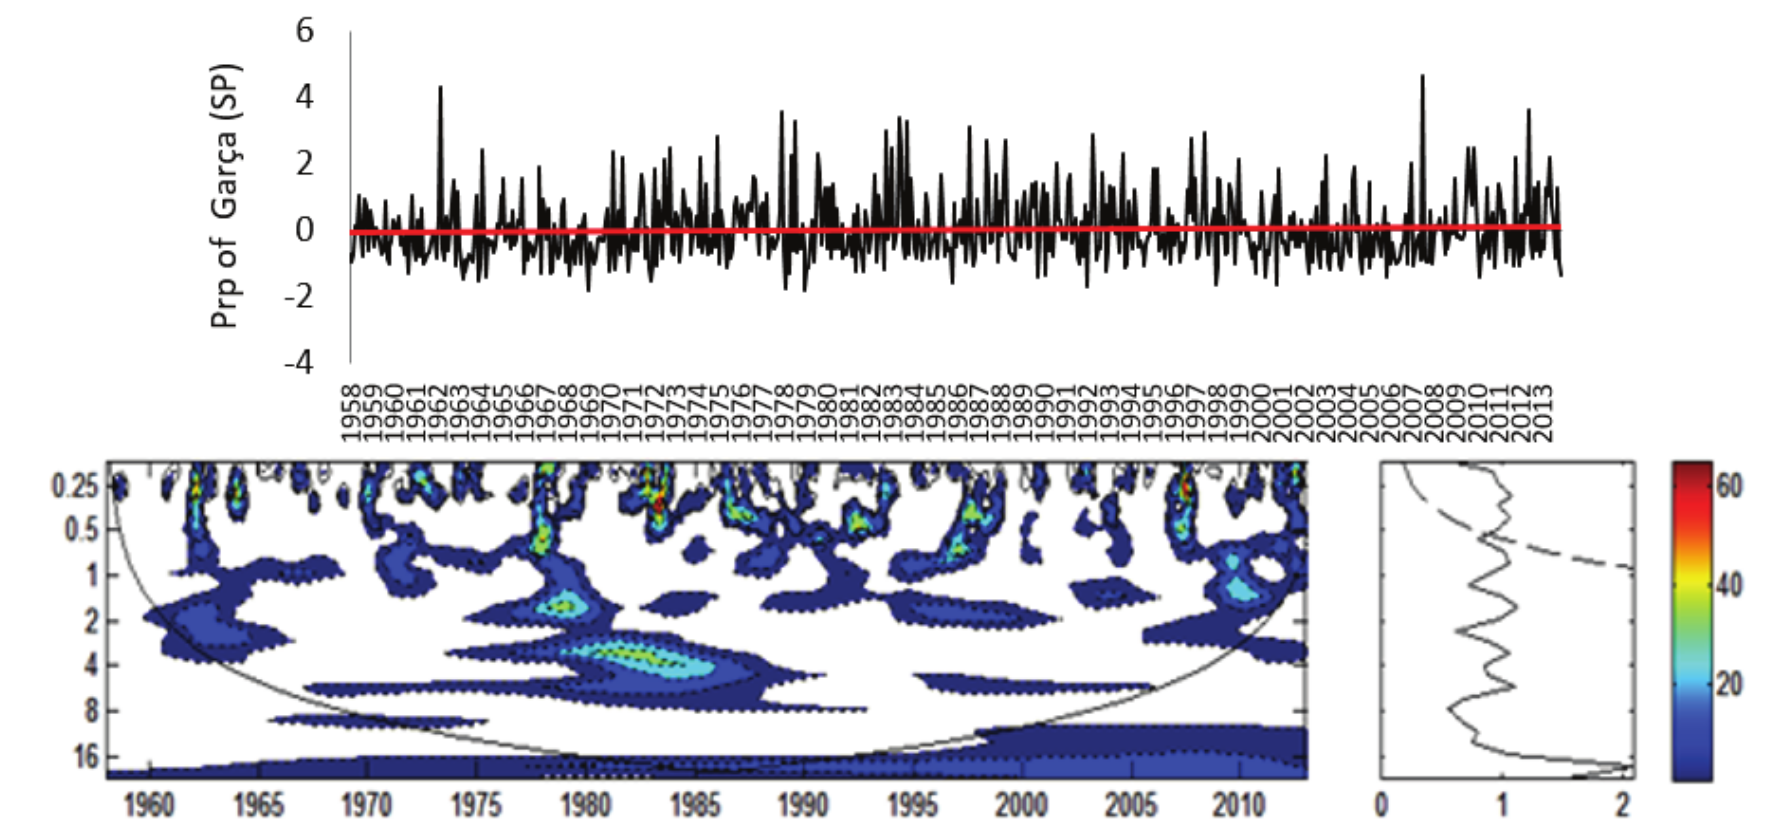
Figure 14.
a) Rainfall Index for Garça Rainfall Station (Prp) normalized by standard deviation; b) Local Energy Spectrum for Garça (Prp); Shaded contours correspond to normalized variances significant at the 5% level. The U-shaped curve represents the cone of influence, under which the edge effect is important. c) Wavelet Global Spectrum, the dashed contour indicates that the Wavelet Global Spectrum is significant at 95% level. Attention: In Figure B) Axis Y: Period (years); Axis X: Time (years); in Figure C) Axis X: Variance.
Positive rainfall indices associated with the interactions of the 22-year, 2-7 year and 0.25-0.5 year temporal scales were noted in the years 1964, 1972 and 1976; of the scales of 2-7 years and of 0.25-0.5 years for the years of 1986, 2007, 2008, 2009 and 2010; and of all scales, including that of 11 years, for 1998 and 2000. As studied by Gershunov and Barnett (1998), the association of scales with the same signals results in positive anomalies of rainfall contributing to the occurrence of extreme events. Similar results are also presented by Silva and Silva (2016).
The 22-year scale observed in the local energy spectrum from 1958 to 1992 (Figure 16b) was dominant for the rainfall station of Guaraçaí, but with no statistical significance (Figure 16c). The secondary scales acting were the 11-year scale, occurring between 1973 and 2006, the 2-7 year scale, between 1958 and 1982 and from 1988 to 2013, and the seasonal scale of 0.25-0.5 years.
In the interval between 1968 and 1970, there was a lack of available rainfall data in the rainfall station of Guaraçaí, requiring the application of normalized means since it is the prp index, so as not to underestimate or overestimate the results.
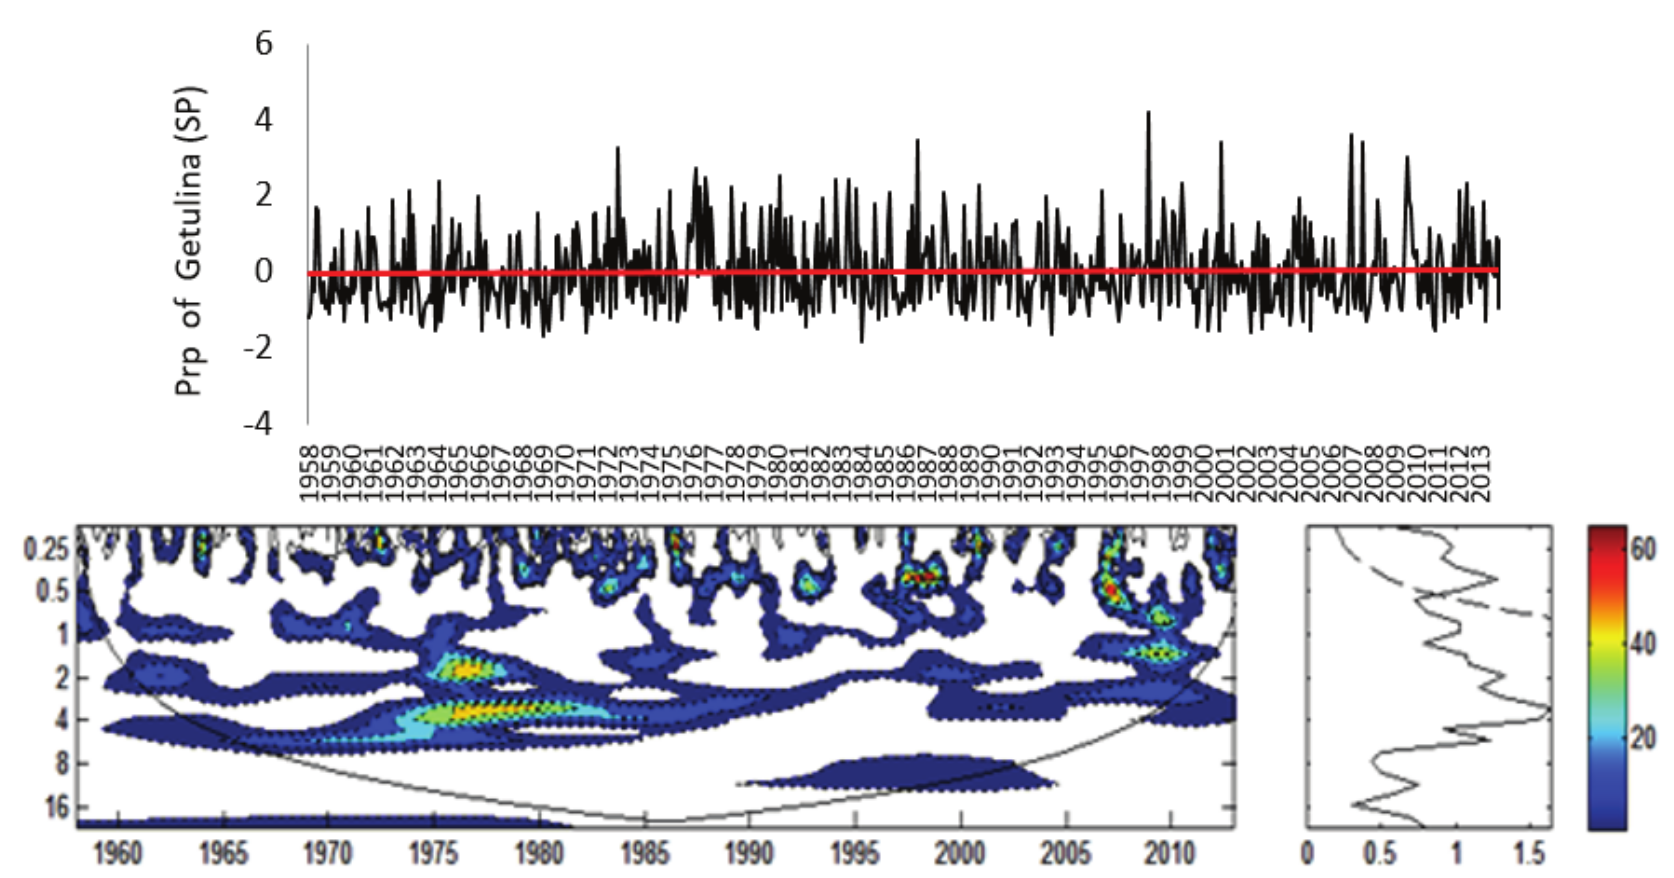
Figure 15.
a) Rainfall Index for Getulina Rainfall Station (Prp) normalized by standard deviation; b) Local Energy Spectrum for Getulina (Prp); Shaded contours correspond to normalized variances significant at the 5% level. The U-shaped curve represents the cone of influence, under which the edge effect is important. c) Wavelet Global Spectrum, the dashed contour indicates that the Wavelet Global Spectrum is significant at 95% level. Attention: In Figure B) Axis Y: Period (years); Axis X: Time (years); in Figure C) Axis X: Variance.
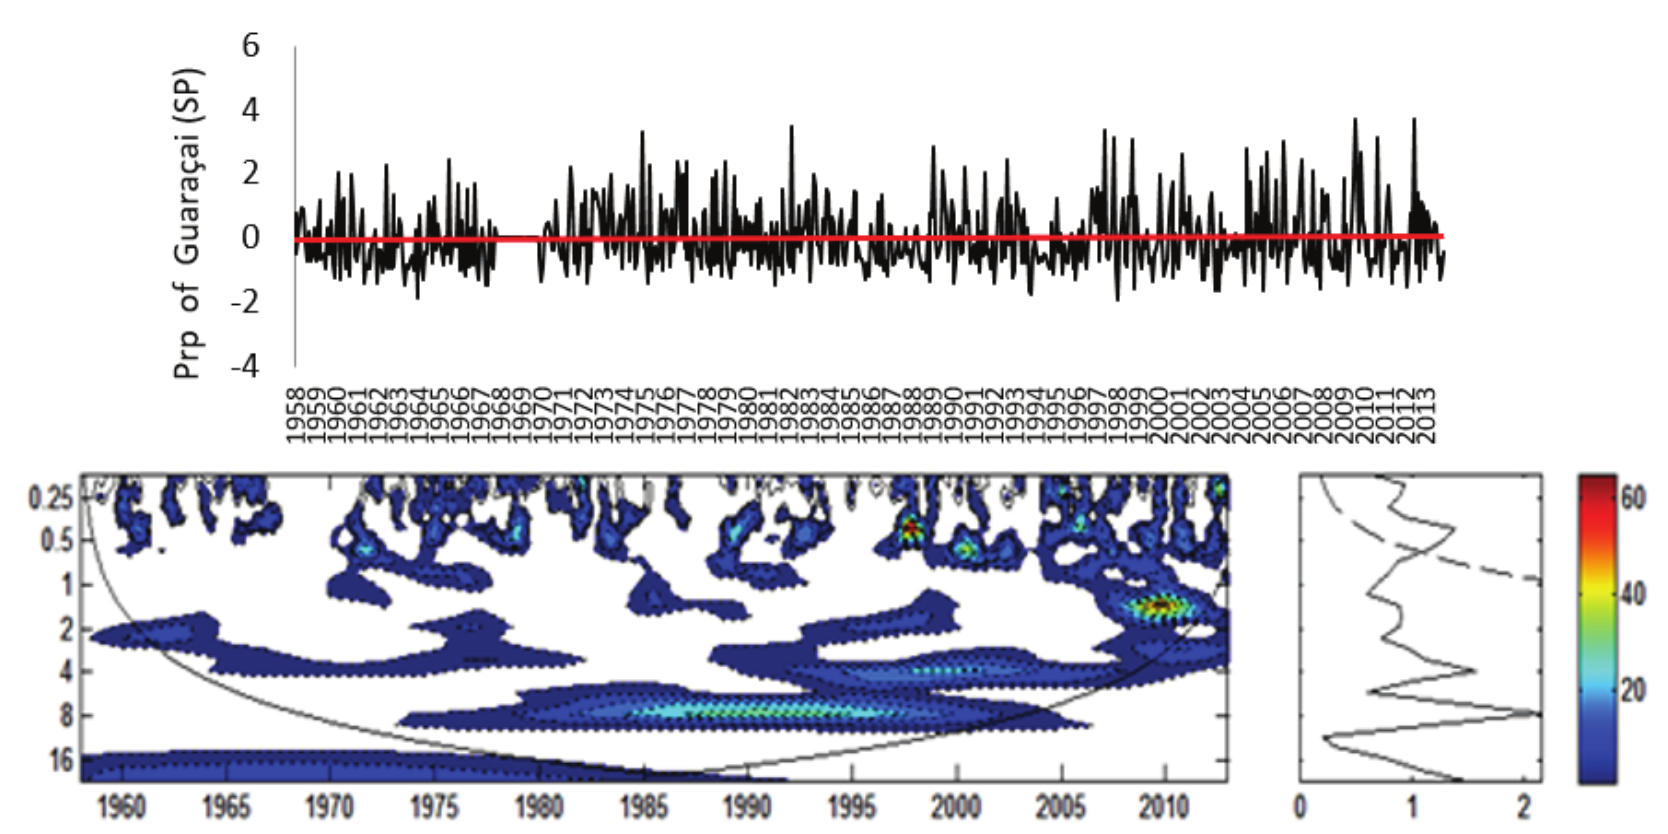
Figure 16.
a) Rainfall Index for Guaraçaí Rainfall Station (Prp) normalized by standard deviation; b) Local Energy Spectrum for Guaraçaí (Prp); Shaded contours correspond to normalized variances significant at the 5% level. The U-shaped curve represents the cone of influence, under which the edge effect is important. c) Wavelet Global Spectrum, the dashed contour indicates that the Wavelet Global Spectrum is significant at 95% level. Attention: In Figure B) Axis Y: Period (years); Axis X: Time (years); in Figure C) Axis X: Variance.
In the years of 1975, 1982, 1989, 1997, 2009 and 2012, high rainfall indices were verified, characterized by the association of temporal scales. In 1997, the scale of 0.25-0.5 years was more intense and in the years of 2009 and 2012 the scale of 2-7 years was more intense, also contributing to the increase in the rainfall index.
In the rainfall station of Guararapes, the dominant peak in the scale of 22 years occurred in the period from 1958 to 1989 (Figure 17b). We detected the presence of 11-year, 2-7 year and the 0.25-0.5 year scales, which were present throughout the series.
The highest rainfall indices were found in the years 1961, 1975, 1985, 1990, associated with the interaction of all temporal scales. Intense signs on the seasonal scale can be observed in the local energy spectrum (Figure 17b) in the years 1961 and 1997 and in the scale of 2-7 years for the year 2009.
The 22-year scale is dominant in the rainfall station of Monte Castelo, which remained persistent throughout the period in the local energy spectrum (Figure 18b). The 11-year scale was observed in the period from 1964 to 2004, we also observed the scale of 2-7 years occurring from 1960 to 2013 and the seasonal scale of 0.25-0.5 years.
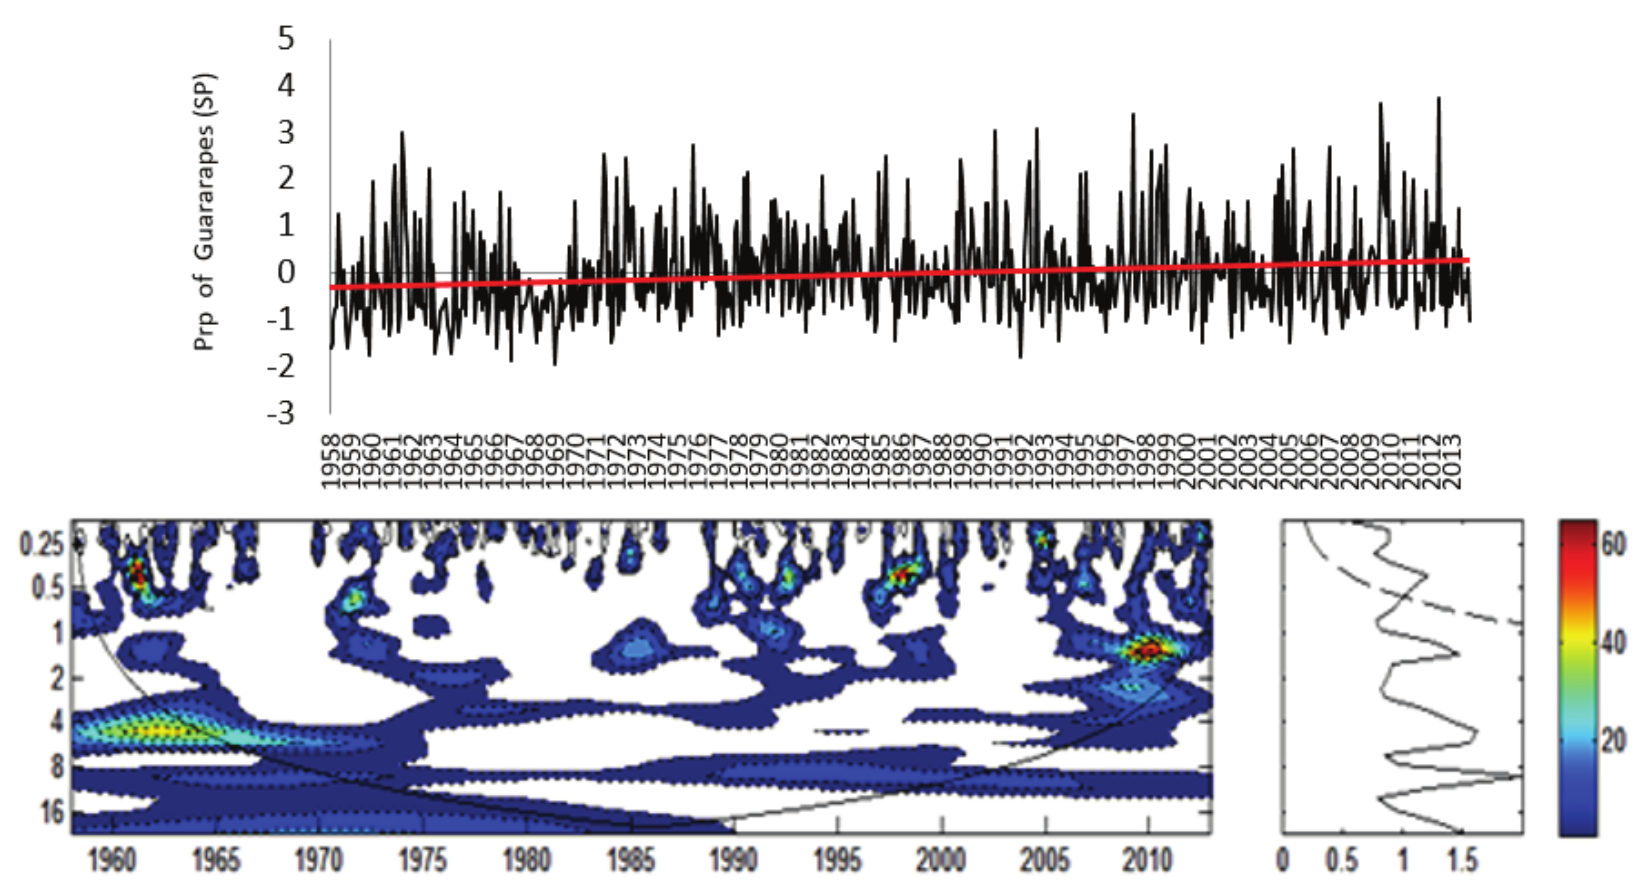
Figure 17.
a) Rainfall Index for Guararapes Rainfall Station (Prp) normalized by standard deviation; Local Energy Spectrum for Guararapes (Prp); Shaded contours correspond to normalized variances significant at the 5% level. The U-shaped curve represents the cone of influence, under which the edge effect is important. c) Wavelet Global Spectrum, the dashed contour indicates that the Wavelet Global Spectrum is significant at 95% level. Attention: In Figure B) Axis Y: Period (years); Axis X: Time (years); in Figure C) Axis X: Variance.
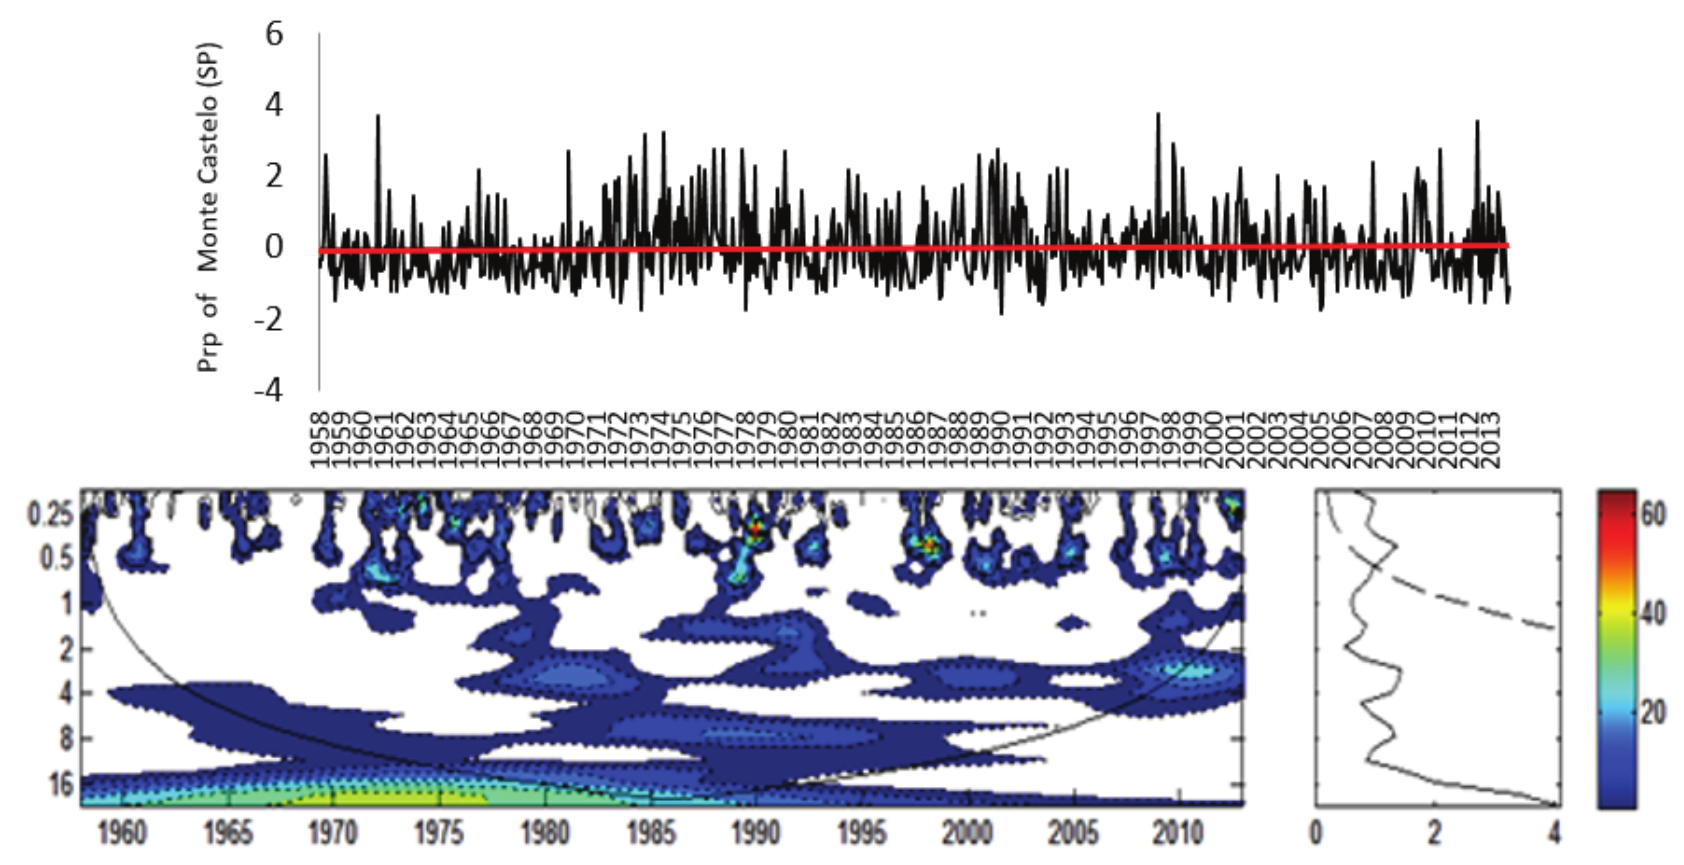
Figure 18.
a) Rainfall Index for Monte Castelo Rainfall Station (Prp) normalized by standard deviation; b) Local Energy Spectrum for Monte Castelo (Prp); Shaded contours correspond to normalized variances significant at the 5% level. The U-shaped curve represents the cone of influence, under which the edge effect is important. c) Wavelet Global Spectrum, the dashed contour indicates that the Wavelet Global Spectrum is significant at 95% level. Attention: In Figure B) Axis Y: Period (years); Axis X: Time (years); in Figure C) Axis X: Variance.
The association of scales with opposite signs can be observed in the years of 1973, 1978, 1990 and 2005, in which negative rainfall anomalies are observed. In 2005, the 11-year scale remained absent and Enos presented a normal year (Wolter & Timlin, 1998), contributing to the weakening of the seasonal scale. In the period from 1968 to 1978, when the dominant 22-year scale was shown to be more intense, positive rainfall anomalies became more frequent, with subsequent high peaks of rainfall.
In the rainfall station of Queiroz, the dominant 22-year scale was present throughout the period of the series (Figure 19b), but with no statistical significance (Figure 19c). The 11-year scale was also persistent throughout the series, the 2-7 year scale occurred from 1963 to 2013 and the seasonal scale of 0.25-0.5 years.
In the interval between 1967 and 1971, there was a lack of rainfall data available in the rainfall station of Queiroz, and it is necessary to apply normalized averages since it is the Prp index, so as not to underestimate or overestimate the results.
The union of the time scales can be observed in the Local Energy Spectrum (Figure 19b) influencing the increase of the rainfall index in the years of 1978, 1987, 1997/98, 2007, 2009 and 2012. For instance the year 2007, when it was associated the 22-year PDO-related scale, the 11-year sunspot cycle-related scale, the 2-7 year Enso-related scale and the seasonal scale, which was more intense.
The dominant 22-year scale was more intense in the period from 2002 to 2013 in which a higher frequency of positive rainfall anomalies can be observed. The combination of the temporal scales promotes high rainfall indices, supporting the results found by Rockwood and Maddox (1988), Gershunov and Barnett (1998), Silva et al. (2009) and Silva and Silva (2016).
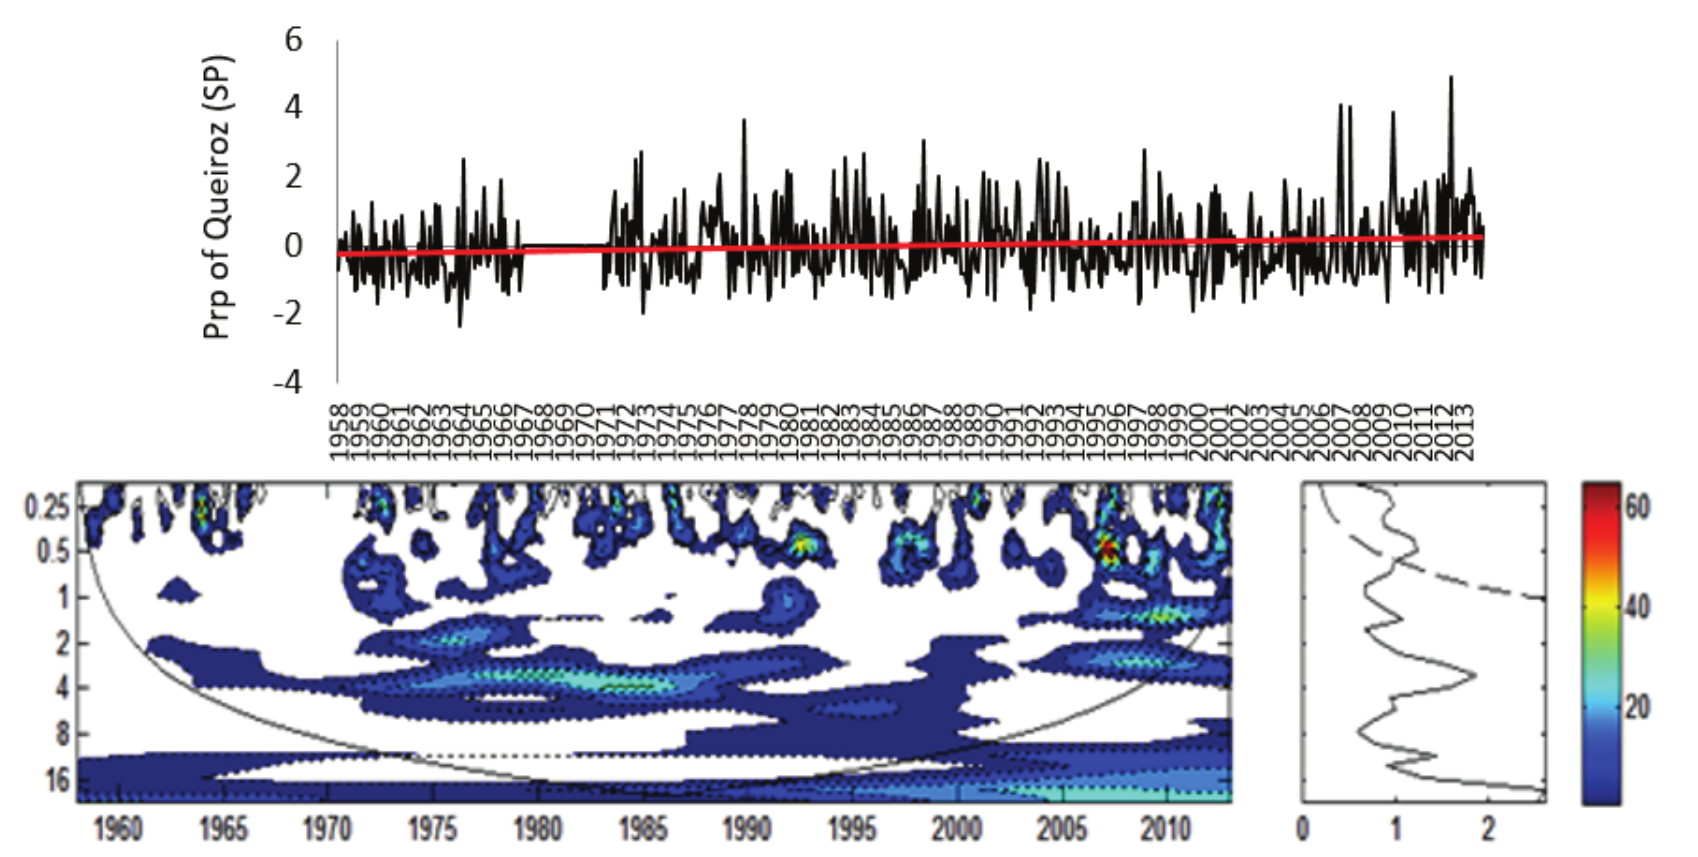
Figure 19.
a) Rainfall Index for Queiroz Rainfall Station (Prp) normalized by standard deviation; b) Local Energy Spectrum for Queiroz (Prp); Shaded contours correspond to normalized variances significant at the 5% level. The U-shaped curve represents the cone of influence, under which the edge effect is important. c) Wavelet Global Spectrum, the dashed contour indicates that the Wavelet Global Spectrum is significant at 95% level. Attention: In Figure B) Axis Y: Period (years); Axis X: Time (years); in Figure C) Axis X: Variance.
Conclusion
In the analysis of the 55 years of the rainfall data series of the Aguapeí-Peixe Basin, the years with extreme events were identified and the wavelet analysis suggested their climatic causes evidencing the Pacific Decadal Oscillation (PDO) as the dominant scale for the rainfall in the basin, in addition to the influence of the seasonal, Enso and sunspot cycle scales. The analysis of wavelets pointed out that the years with high rainfall indices are characterized by the association of different temporal scales and the lack of these are related to the years of low rainfall indices. Thus, the monitoring of these phenomena and climatic systems is of great importance for the management of water resources in the hydrographic basin studied.
References
Araya, E., Bonatti, J., & Fernandez, W. (2000). Solar activity and climate in Central America. Geofísica Internacional Mexico, 39(1), 97-102.
Gershunov, A., & Barnett, T. P. (1998) Interdecadal modulation of ENSO teleconnections. Bulletin of the American Meteorological Society, 79(12), 2715-2725. doi: 10.1175/1520-0477(1998)079<2715:IMOET>2.0.CO;2
Kerr, R. A. (1996). A now dawn for sun-climate links? Science, 271(5224), 1360-1361.
Mantua, N. J., Hare, S. R., Zhang, Y., Wallace, J. M., & Francis, R. C. (1997). A pacific interdecadal climate oscillation with impacts on salmon production. Bulletin of the American Meteorological Society, 78(6), 1069-1079. doi: 10.1175/1520-0477(1997)078<1069:APICOW>2.0.CO;2
Marengo, J. A., Schaeffer, R., Zee, D., & Pinto, H. S. (2009). Mudanças climáticas e eventos extremos no Brasil. Rio de Janeiro, RJ: FBDS.
Minuzzi, R. B., Sediyama, G. C., Costa, J. M. N., & Vianello, R. L. (2006) Influência do fenômeno climático El Nino no período chuvoso da Região Sudeste do Brasil. Geografia, 15(2), 5-19. doi: 10.5433/2447-1747.2006v15n2p5
Molion, L. C. B. (2005). Aquecimento global, El Niños, manchas solares, vulcões e oscilação decadal do Pacífico. Climanálise, 3(1), 1-5.
Njau, E. C. (2006). Solar activity, El Niño-Southern oscillation and rainfall in India. Journal of Meteorology, 3(6), p. 17-34.
Rocha, P. C., & Tommaselli, J. T. G. (2012). Variabilidade hidrológica nas bacias dos Rios Aguapeí e Peixe, Região Oeste Paulista. Revista Brasileira de Climatologia, 10(1), 69-84. doi: 10.5380/abclima.v10i1.30588
Rockwood, A. A., & Maddox, R. A. (1988). Mesoscale and synoptic scale interactions leading to intense convection: The case of 7 June 1982. Weather and Forecasting, 3(1), 51-68. doi: 10.1175/1520-0434%281988%29003<0051%3AMASSIL>2.0.CO%3B2
Servain, J., Wainer, I., Mccreary, J. P., & Dessier, A. (1999) Relationship between the equatorial and meridional modes of climatic variability in the Tropical Atlantic. Geophysical Research Letters, 26(4), 485-488. doi: 10.1029/1999GL900014
Silva, D. F., Souza, F. A. S., & Kayano, M. T. (2009). Uso de IAC e ondeletas para análise de influência das multi-escalas temporais na precipitação da bacia do Rio Mundaú. Revista Engenharia Ambiental, 6(1), 180-195.
Silva, G., & Silva, D. F. (2016). Análise da influência climática sobre a produção agrícola no semiárido cearense. Revista Brasileira de Geografia Física, 9(2), 643-657.
Trivellato, F. T., & Perez Filho, A. (2016). Bacia do Rio do Peixe – Planalto Ocidental Paulista: 90 anos de transformações do uso e ocupações das terras. Geonorte, 3(6), 656-666.
Weng, H., & Lau, K. M. (1994). Wavelets, period doubling, and time-frequency localization with application to organization of convection over the Tropical Western Pacific. Journal of the Atmospheric Sciences, 51(17), 2523-2541. doi: 10.1175/1520-0469(1994)051<2523:WPDATL>2.0.CO;2
Wolter, K., & Timlin, M. S. (1998). Measuring the strength of ENSO – How does 1997/98 rank? Weather, 53(9), 315-324. doi: 10.1002/j.1477-8696.1998.tb06408.x
Author notes
osmartoledob@gmail.com