Biotecnologia
Screening of fungal strains with potentiality to hydrolyze microalgal biomass by Fourier Transform Infrared Spectroscopy (FTIR)
Screening of fungal strains with potentiality to hydrolyze microalgal biomass by Fourier Transform Infrared Spectroscopy (FTIR)
Acta Scientiarum. Technology, vol. 41, 2019
Universidade Estadual de Maringá
Received: 26 September 2017
Accepted: 16 April 2018
Abstract: The use of fungi is a promising alternative for harnessing biomass after lipid extraction of microalgae since this biomass may contain relevant levels of carbohydrates that can be converted into other compounds of interest, such as sugars. Fourier Transform Infrared Spectroscopy (FTIR) has proved to be an efficient and environmentally less impacting tool for the selection of microorganisms with biotechnological potential. This study aimed to apply FTIR for the selection of fungal strains with potential to hydrolyze the biomass of the microalgae Desmodesmus subspicatus and Chlorella sp after lipid extraction. Eleven fungal strains were screened for residual biomass hydrolysis and FTIR was applied followed by multivariate analysis for the selection of filamentous fungi. The highest cell density was 28.7 × 10⁶ cells mL-1 for Chlorella sp. and 15.8 × 10⁶ cells mL-1 for D. subspicatus and the values of total carbohydrates content were 23.1 and 16.9%, respectively. Principal Component Analysis (PCA) and Hierarchical Cluster Analysis (HCA) were useful tools to screen fungal strains. After multivariate analysis, it was possible to observe that the fungi strains that presented the greatest ability to use microalgal biomass were Penicillium G12 due to the glucose and xylose sugars obtained after lipid extraction from D. subspicatus (with sugar yield of 9.4 and 6.6%, respectively) and Trichoderma auricularis for Chlorella sp. (with sugar yield of 12.9 and 9.6%, respectively). FTIR was successfully applied to screen fungal strains.
Keywords: Chlorella sp, Desmodesmus subspicatus, fungi, infrared spectroscopy.
Introduction
The constant increase in the demand for renewable energy and the concern for reducing environmental impacts are the primary reasons to intensify the search for new alternatives of renewable energy (Baicha et al., 2016). These efforts address the need for new technologies and reconcile environmental awareness on the use of waste materials for biofuel production (Singh & Gu, 2010; Daroch, Geng, & Wang, 2013). In this context, microalgae appear to be a promising alternative, considering the different applications that these micro-organisms can offer, such as bioremediation (Gressler et al., 2014; Raeesossadati, Ahmadzadeh, McHenry, & Moheimani, 2014), high value products (Koller, Muhr, & Braunegg 2014) and biofuel production (Özçimen, Gülyurt, & İnan, 2012; Hallenbeck, Grogger, Mraz, & Veverka, 2016; Milano et al., 2016; Chernova & Kiseleva, 2017).
The use of microalgae biomass as a feedstock for bioethanol production is becoming significant, particularly for such genera as Chlorella, Dunaliella, Chlamydomonas, Scenedesmus, and Spirulina. (John, Anisha, Nampoothiri, & Pandey, 2011). These microorganisms have a high photosynthetic rate and considerable biodiversity and variability in biochemical composition, accumulating considerable amounts of lipids and carbohydrates (Brennan & Owende, 2010; Khan, Lee, Shin, & Kim, 2017). Besides that, microalgae present efficient assimilation of cellulose and have high concentrations of starch. These characteristics are very suitable for the production of biofuels, such as bioethanol (Silva & Bertucco, 2016).
Microalgae hydrolysis is a plausible method to disrupt cell wall and convert poly-carbohydrates (starch, cellulose) into fermentable mono-sugars. The starch present in microalgae is stored in chloroplasts while cellulose, in the cell walls (Park et al., 2017). Nowadays, microalgae biomass is mainly applied to produce oil focusing on the development of biofuels, such as biodiesel (Song et al., 2016), or in animal and human nutrition (Esquivel‐Hernández et al., 2016). One of the most common process for lipid extraction was developed by Bligh and Dyer (1959), which uses methanol and chloroform as solvents and ultrasound for cell disruption. However, after this process there is still a remaining biomass which can be hydrolysed to obtain other products of commercial interest since this biomass can contain high levels of carbohydrates (Markou, Angelidaki, & Georgakakis, 2012).
In general, acid/enzymatic hydrolysis is the most common method for biomass saccharification. Acid hydrolysis is commonly faster, easier and cheaper than other types of hydrolysis, however the conditions may lead to sugar decomposition into unwanted compounds that can cause inhibition of fermentation (Silva & Bertucco, 2017). Enzymes used to hydrolyze cellulose and hemicellulose are environmentally acceptable, however, the high costs of enzyme production and the cost of hydrolysis are negative aspects that warrant improvement (Shokrkar, Ebrahimi, & Zamani, 2017).
Microbial bioconversion has been studied as a promising alternative, since the cellulose saccharification can release simple sugars for subsequent yeast fermentation. Conversely, hemicellulose saccharification releases five-carbon sugars able to be fermented (Rasmussen, Shrestha, Khanal, Pometto, & van Leeuwen, 2010). Fungi are microorganisms capable of degrading these carbohydrates as carbon and energy sources through an extracellular enzymatic system that produces hydrolases, which are responsible for polysaccharide degradation (Skory, Freer, & Bothast, 1997).
Thus, fungi hydrolysis is a relevant alternative because these microorganisms have a rapid metabolism for transforming cellulose and hemicellulose into pentoses and hexoses (Yoon, Cha, Kim, & Kim, 2008; Rasmussen et al., 2010; Okamoto, Nitta, Maekawa, & Yanase, 2011; Lee et al., 2015). The fungal-mediated hydrolysis of microalgae biomass is a technique that merits further investigation, and efficient methods must be developed to screen these microorganisms. The development of a rapid, low cost technique with less environmental impact for the selection of microorganisms that hydrolyze raw materials for conversion into biofuels has garnered considerable research attention (Baum, Hansen, Meyer, & Mikkelsen, 2013; Girard, Deschênes, Tremblay, & Gagnon, 2013; Wang, Yuan, Ji, & Li, 2013; Dong, Yang, Zhu, Wang, & Yuan, 2013). Fourier Transform Infrared Spectroscopy (FTIR) can be successfully applied for this purpose, as this technique is able to monitor enzymatic reactions, as well as changes in the structure of molecules, in real time. If the molecular structure is modified during the reaction, the infrared spectrum is able to monitor this variation (Kansiz et al., 1999; Pacheco, Karmali, Serralheiro, & Haris, 2005; Kumar & Barth, 2010; Santos, Fraga, Kozakiewicz, & Lima, 2010).
Considering the potential to obtain sugars through microalgae, the aim of the present study was to apply FTIR for selection of fungi strains to hydrolyze Desmodesmus subspicatus and Chlorella sp. biomass.
Material and methods
Microalgae and fungi strains cultivation
The microalgae strain D. subspicatus was provided by the laboratory of Ecotoxicology of the University of Santa Cruz do Sul (UNISC), State Rio Grande do Sul, Brazil. The microalgae strain of Chlorella sp. was generously provided by the Federal University of Santa Catarina (UFSC), State Santa Catarina, Brazil. D. subspicatus and Chlorella sp. were cultivated in photobioreactors and 1 L Erlenmeyer flasks, respectively. The strains were acclimated to a solution of 3 g L-1 of N:P:K (18:6:18) fertilizer (Gressler et al., 2014), and CO2 was supplied to the cultures through diaphragm pumps with a flow rate of 0.22 vvm. A solenoid valve was used to control the injection of CO2 into the system, which was interspersed in periods of 3 min. every 2 hours. Continuous artificial illumination with fluorescent light was applied (2500 lux, 24 hours day-1), and the temperature was maintained at 25°C. The cell density was monitored daily for each species through spectrophotoscopy at 682 nm, and the results were plotted as calibration curves. Experiments were conducted in triplicate.
Filamentous fungi strains examined in the present study were transferred from the Culture Collection of Microorganisms at Industrial Microbiology from UNISC. A total of 11 strains of filamentous fungi were grown on plates containing potato dextrose agar medium for 7 days at 25°C. The cultures were maintained in slants with Sabouraud agar medium.
Analysis of lipids and carbohydrates in microalgae biomass
The electroflotation method was applied for the biomass separation of D. subspicatus and Chlorella sp. A power supply with direct current (Instrutherm, FA – 3003) was used. The electrode was constructed using 6 iron plates (100 x 60 mm), 3 mm thickness; the distance between the plates was 0.4 mm, and the current density was 1.0 mA cm-2 as shown in previous work (Baierle et al., 2015). The biomass dry weight was measured for each microalgae species.
Lipids were extracted from the microalgae biomass using the method of Bligh and Dyer (1959) using chloroform: methanol (2:1, v v-1) as solvents and using ultrasound (Unique USC-1400) for cell disruption, carried out with 25 kHz and 4 cycles of 30 min. After extraction, the solvent was evaporated using a rotary evaporator (Quimis, Q344M), and the residual biomass was dried at 50°C. These residues were stored under refrigeration temperature for subsequent tests of fungal hydrolysis.
The carbohydrate content was determined in microalgae biomass after lipid extraction using the method described by Sluiter (2008). A portion of 300 mg of the residual biomass was weighed and placed into a pressure tube with 3 mL of 72% sulfuric acid. The tube was incubated for 60 min. in a water bath at 30°C, followed by the addition of 84 mL deionized water. The samples were then autoclaved at 121°C for 1 hour.
FTIR screening to evaluate the fungi ability to hydrolyze microalgae biomass
The dry biomass residue (20 mg) was placed in test tubes, and 2 mL deionized water was added. These mixtures were sterilized through autoclaving at 121°C for 20 min. The spores (approximately 1×10⁸ spores mL-1) of 11 fungal strains were inoculated, and the tubes were incubated at 30°C for 7 days. The fungal growth on microalgae biomass was monitored daily through visual evaluation and the fungi strains were identified as: (-) without micellar growth, (+) little micellar growth, and (++) high micellar growth.
The fungi mycelium was removed and aliquots of 100 µL of the supernatant from each culture were transferred to 1.5 mL microtubes containing 100 mg potassium bromide, lyophilized for 2 hours at 1.10-4 Torr (Labcomco) and ground with a pestle. The infrared spectrum was acquired in triplicate using a diffuse reflectance device (Pyke Technologies, Madison) coupled to a Fourier Transform Infrared Spectroscopy (FTIR; Perkin Elmer model 400) at a range of 4000 to 400 cm-1, with 16 scans and a resolution of 4 cm-1. The spectral data (intensity of absorbance for a given frequency associated with specific bands) were evaluated to check for the presence of characteristic bands that indicated that the hydrolysis step was effective with the selected fungal strains. The analysis was performed in order to observe the presence of FTIR bands that could reflects the potential of hydrolysis, such as the bands in approximately 3300 (O-H stretching vibrations), 733 (C=O stretching originating from esters or amides), 1100 (C-O-C indicating carbohydrates as saccharides and polysaccharides) and 1600 cm–1 (NH2 deformation corresponding to proteins or amino acids).
Multivariate analysis using PCA and HCA to select fungi strains
The normalized average spectra were pre-processed through mean centering, and subsequently analyzed for a hierarchical cluster analysis and principal component analysis using PIROUETTE 3.1 software (InfometrixTM). Fungi strains were chosen considering the results found through the analysis with FTIR and by the evaluation of the results obtained by PCA and HCA. The PCA was applied in the exploratory analysis to identify similarities and differences between different fungi strains species, after data compression. Hierarchical Cluster Analysis was applied to the auto-scaled data and the Euclidean distances generated a dendrogram for the samples.
Hydrolysis of microalgae biomass with selected fungal strains
For the assays, 1 g of residual biomass of both microalgae and 100 mL deionized water were added to 500 mL Erlenmeyer flasks and sterilized at 121°C for 20 min. The selected fungal strains were grown on Potato Dextrose Agar (PDA) at 25°C during 7 days. A saline solution containing the spores was analyzed on a Neubauer chamber and the inoculum was adjusted to 1×10⁸ spores mL-1, approximately. The samples were incubated for 7 days at 30°C in an orbital shaker (20 rpm). The hydrolysis reactions were performed in quintuplicate for all fungal strains selected.
Hydrolysate sugar determination
Sugar determination in the hydrolysates was conducted using an HPLC equipped with refractive index detector RID-20A, model LC-20AD from Shimadzu (USA). Software LabSolutions (Thermo Scientific, USA) was used for data acquisition and processing. The compounds from the sugar mixture (glucose and xylose) were separated in a Rezex RHM monosaccharide H+ column (8% cross-linked sulfonated styrene-divinylbenzene, 300 × 7.8 mm) from Phenomenex. The analysis was performed with isocratic flow using ultrapure water. The total chromatographic run time was 20 min. The optimum flow rate was 0.8 mL min.-1 and the injection volume was 20 μL. A standard solution at 10 mg mL-1 of each sugar was subjected to chromatographic analysis and the linearity was evaluated by the coefficient of determination (r2) from the analytical curves containing a mixture of the selected sugars at the levels 0.1; 0.2; 0.3; 0.4 and 0.5 mg mL-1.
Results and discussion
Microalgae and fungi cultivation
Microalgae cell density was evaluated as a function of days of cultivation, and D. subspicatus and Chlorella sp. presented similar growth, as shown in Figure 1. Chlorella sp. showed a slightly higher cell density (28.7×10⁶ cells mL-1) compared to Desmodesmus subspicatus (15.8×10⁶ cells mL-1) and the dry weight obtained was 0.36 and 0.28 g L-1, respectively. Coefficients of determination were satisfactory since both microalgae presented values of r² > 0.99. The maximum growth was observed on the 10th day of culture for both microalgae.
A visual analysis for the ability of 11 filamentous fungal strains to hydrolyze microalgae biomass in submerged culture was performed. As listed in Table 1, we assessed the development of 11 fungal strains with different rates of mycelial growth, indicating the consumption of the substrate compared with a control sample (B).
Analysis of lipids and carbohydrates in microalgae biomass
After lipid extraction, the lipid content obtained in the separation of biomass through electroflotation was 6.07% for D. subspicatus and 4.72% for Chlorella sp. Mallick, Bagchi, Koley, and Singh (2016), indicate that microalgae lipids can exceed 50-60% of dry cell weight. On the other hand, Silva and Bertucco (2016) describes levels in a range of 8-15%. According to Schneider et al. (2012), the lipid content can range from 7 to 77%, depending on the species and growth conditions. Considering that lipids can be used in biodiesel production (Doan, Sivaloganathan, & Obbard, 2011), we applied the biomass residue to examine the hydrolytic capacity of fungal strains using FTIR.
The total carbohydrate content was obtained considering the amount of microalgae biomass after lipid extraction. As a result, D. subspicatus and Chlorella sp. presented 16.9 and 23.1% of total carbohydrates, respectively.
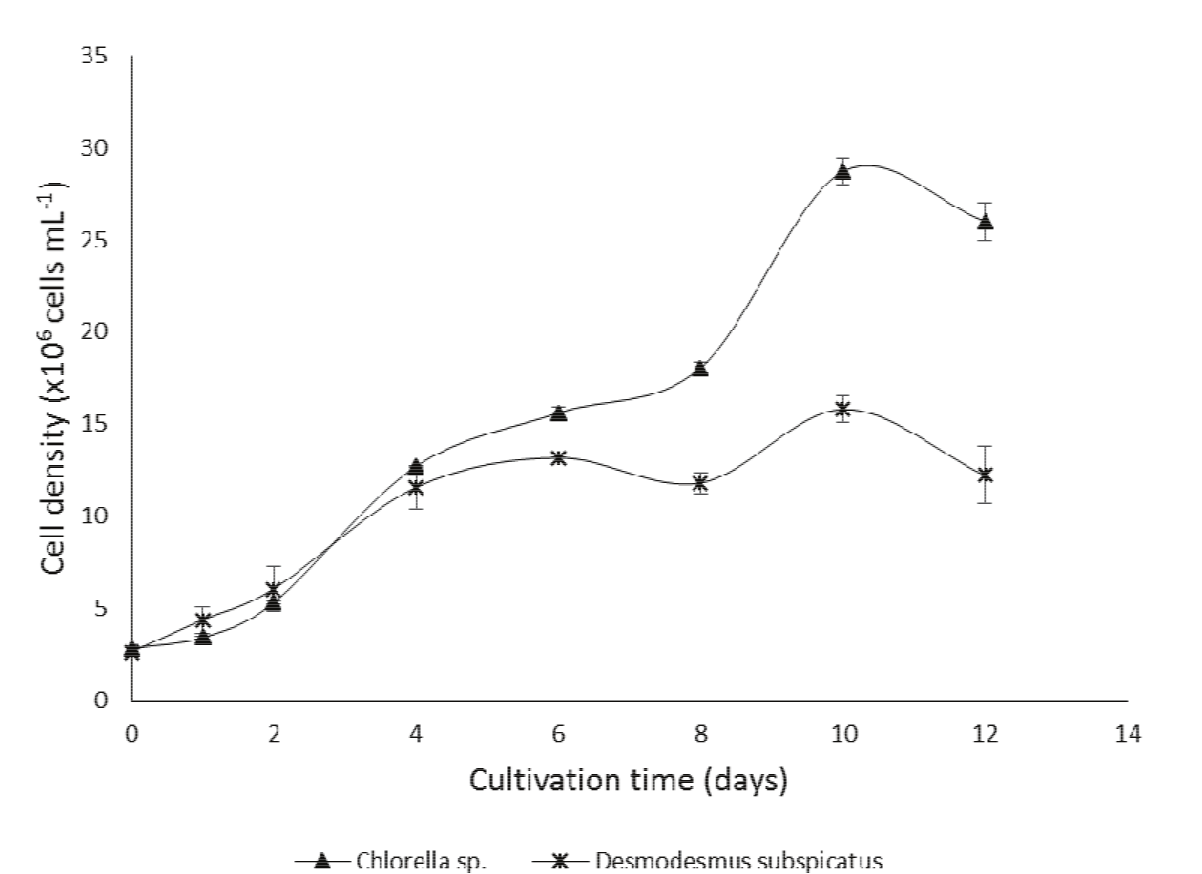
Figure 1.
Growth curve of Chlorella sp. and Desmodesmus subspicatus in N:P:K (3 g L-1) medium and CO2 supply during 12 days.
FTIR screening to evaluate the hydrolytic capacity of fungi strains on microalgae
After evaluating hydrolysis, the biomass of both microalgae was analyzed through infrared spectroscopy. The same profile was obtained for both microalgae, as illustrated in Figure 2.
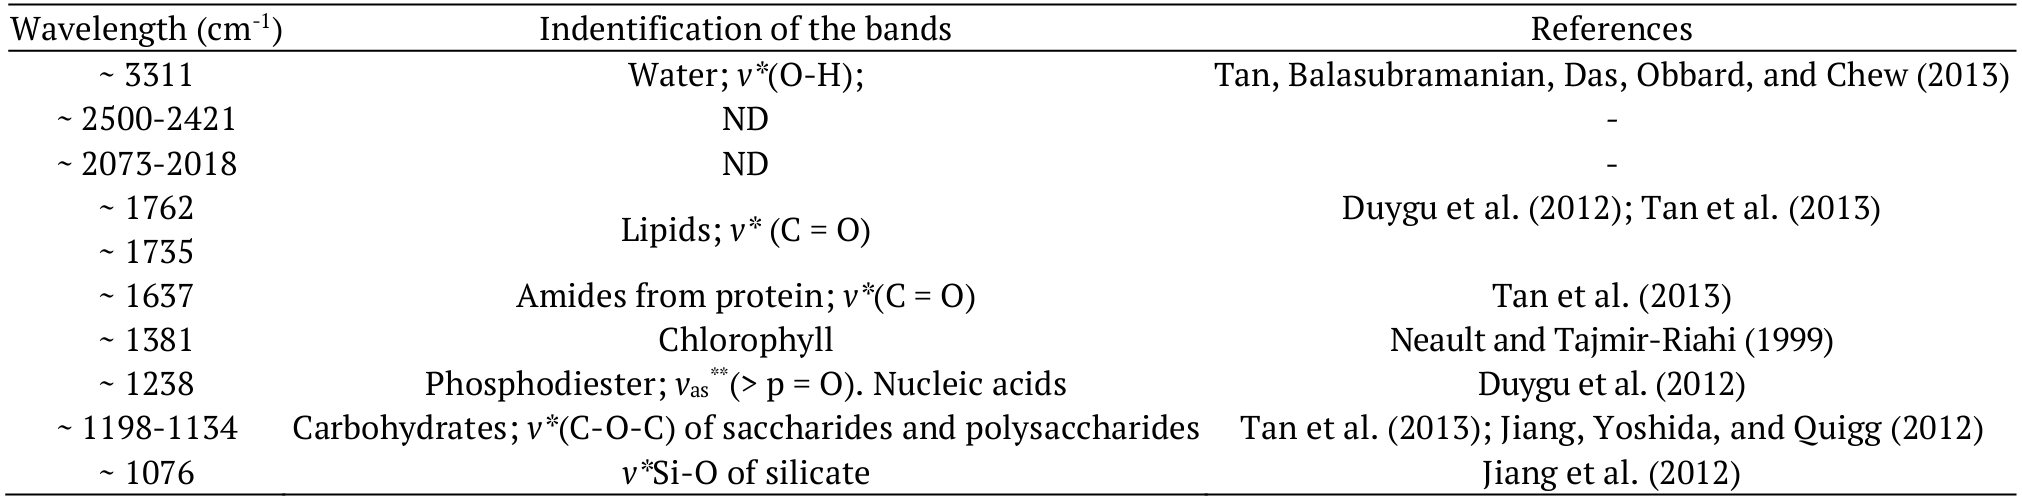
The vibration frequency depends on the linkage power involved in the functional groups. Most of the absorption bands observed in the hydrolysates reflect the presence of various functional groups in the medium (Giordano et al., 2001). The biomass hydrolysis produced a complex mixture of compounds derived from proteins, lipids, nucleic acids, and carbohydrates, such as carboxylic acids, amino acids and oligosaccharides (Stehfest, Toepel, & Wilhelm, 2005), which are observed as an increasing O-H band area. Despite the difficulty in distinguishing certain bands, characteristic stretches of microalgae composition have been observed in other studies. The corresponding wavelengths and bands found in microalgae under study are reported in Table 2. The spectra recorded for both microalgae in this study were identified using data reported in previous studies.
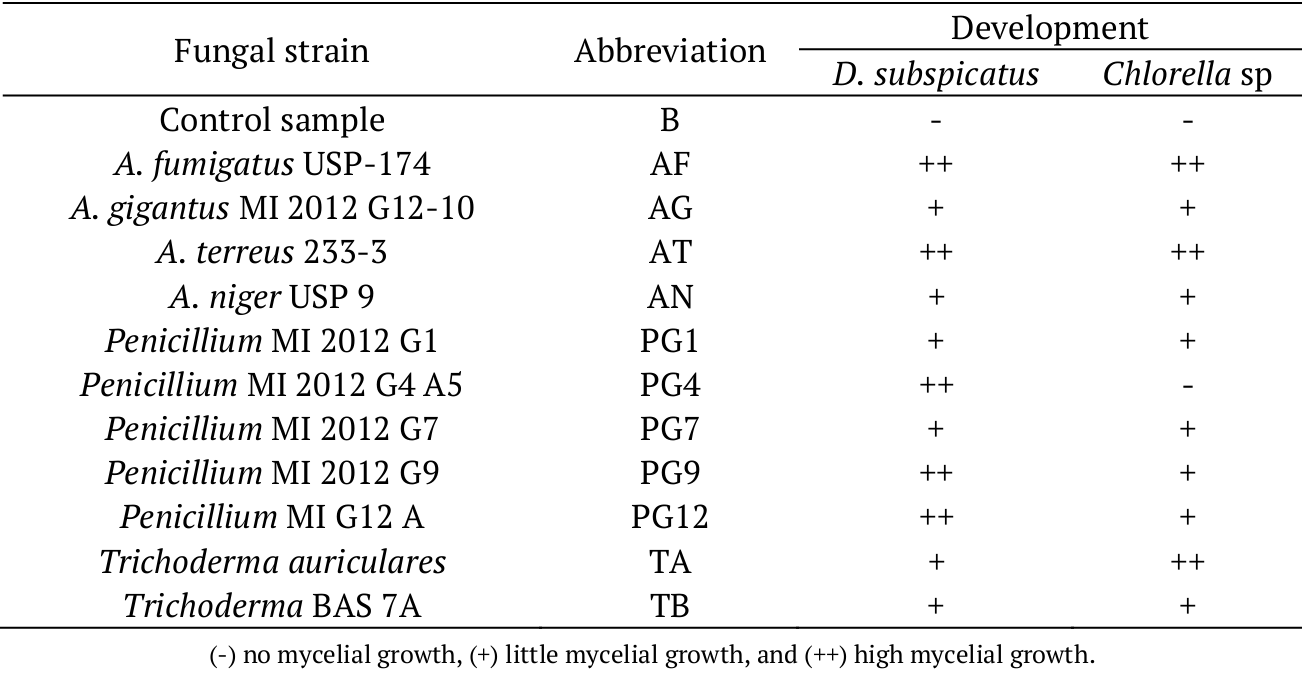
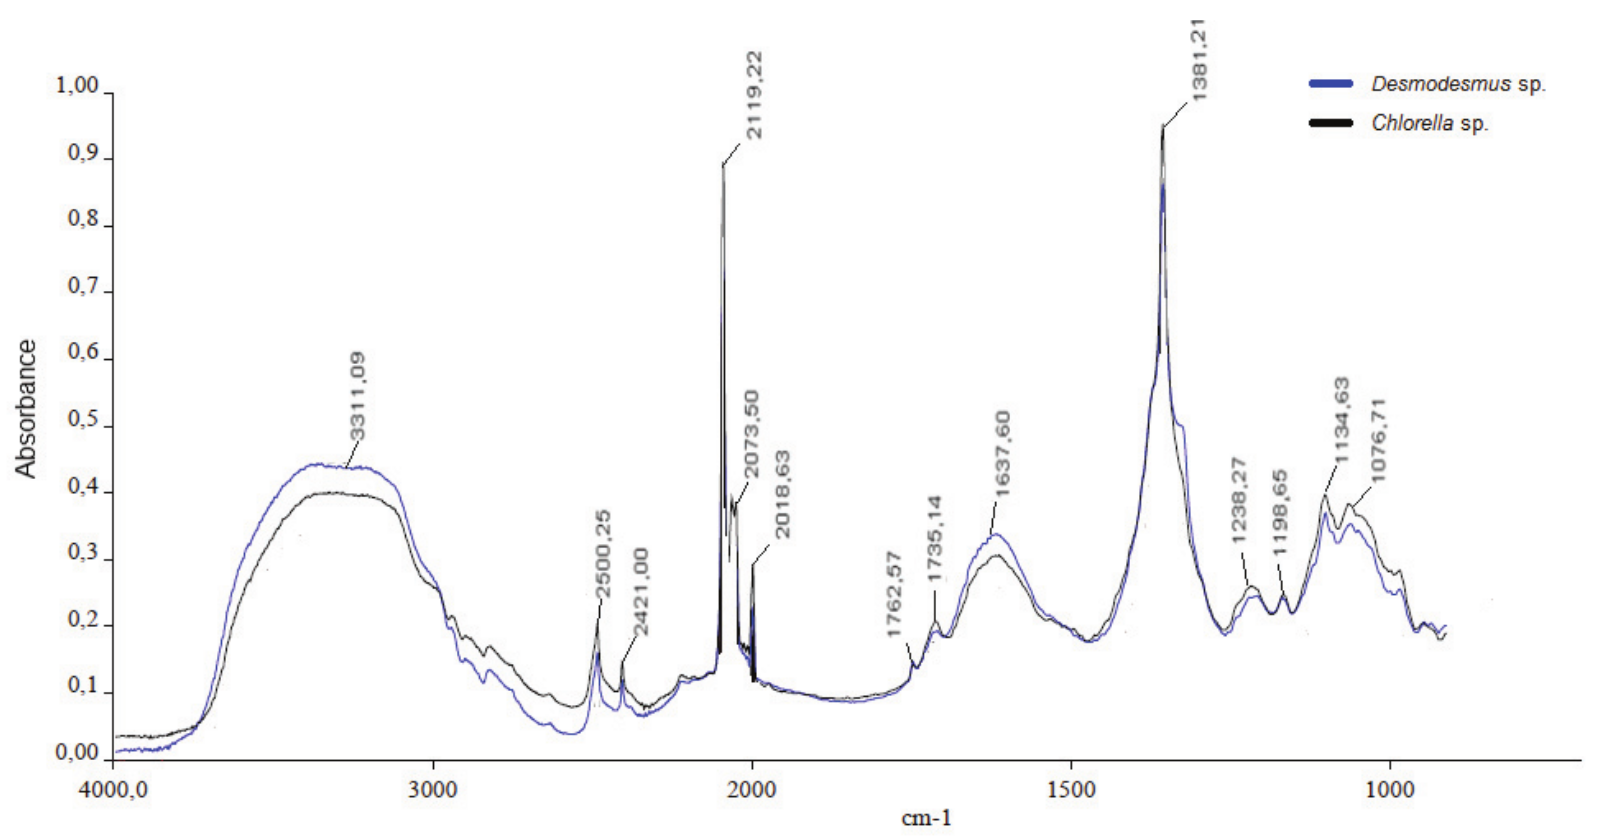
Figure 2.
Spectrum profile obtained after hydrolysis of Desmodesmus subspicatus and Chlorella sp.
In the present study, similarities between the microalgae compositions were observed after comparing the spectral profiles, highlighting the bands indicative of sugars (saccharides and polysaccharides), proteins and lipids. Indeed, spectroscopy is widely used for microalgae analysis, because this technique facilitates the characterization and quantification of the compounds present in the samples. Considering the main bands obtained through infrared spectroscopy (Table 2), the multivariate analysis was performed.
Multivariate analysis using PCA and HCA to select fungal strains
In this study, the analytical methods used were Principal Component Analysis (PCA) and Hierarchical Cluster Analysis (HCA) (Tan, Aziz, & Aroua, 2013; Liu, Mukherjee, Hawkes, & Wilkinson, 2013). After hydrolysis, the main components of the microalgae D. subspicatus and Chlorella sp. were assessed (Table 3).
The results showed that the first component described 99.22% of the data obtained for D. subspicatus. The analysis of the principal components of Chlorella sp. biomass showed a similar patterns of biomass uptake, where 99.5% of the data can be described using a single component.
PCA score plots were obtained for both microalgae to distinguish common parameters through an assessment of the similar components between samples. In this case, we used PCA analysis (PC1 x PC3) to demonstrate the grouping based on similarities between fungal strains as shown in Figure 3. In Desmodesmus subspicatus, the formation of three major distinct groups on the score graph was observed in Figure 3(1). In Chlorella sp., a better separation was achieved compared to D. subspicatus, with the distinction of two groups, as shown in Figure 3(2). This separation indicated that more fungal strains are useful for hydrolysis, considering that only one strain grouped with the control sample.
Subsequently, the HCA of the D. subspicatus and Chlorella sp. biomass was performed (Figure 4) to check for a profile consistent with the PCA results and determine which fungal strains were most favorable for the hydrolysis step. HCA was run in order to emphasize the natural clusters and similar patterns between the samples. The obtained dendrogram and the distance between the samples were performed to verify the similarity of fungal strains.
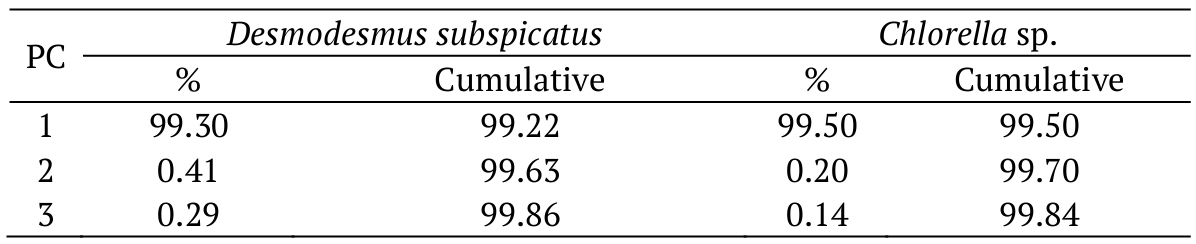
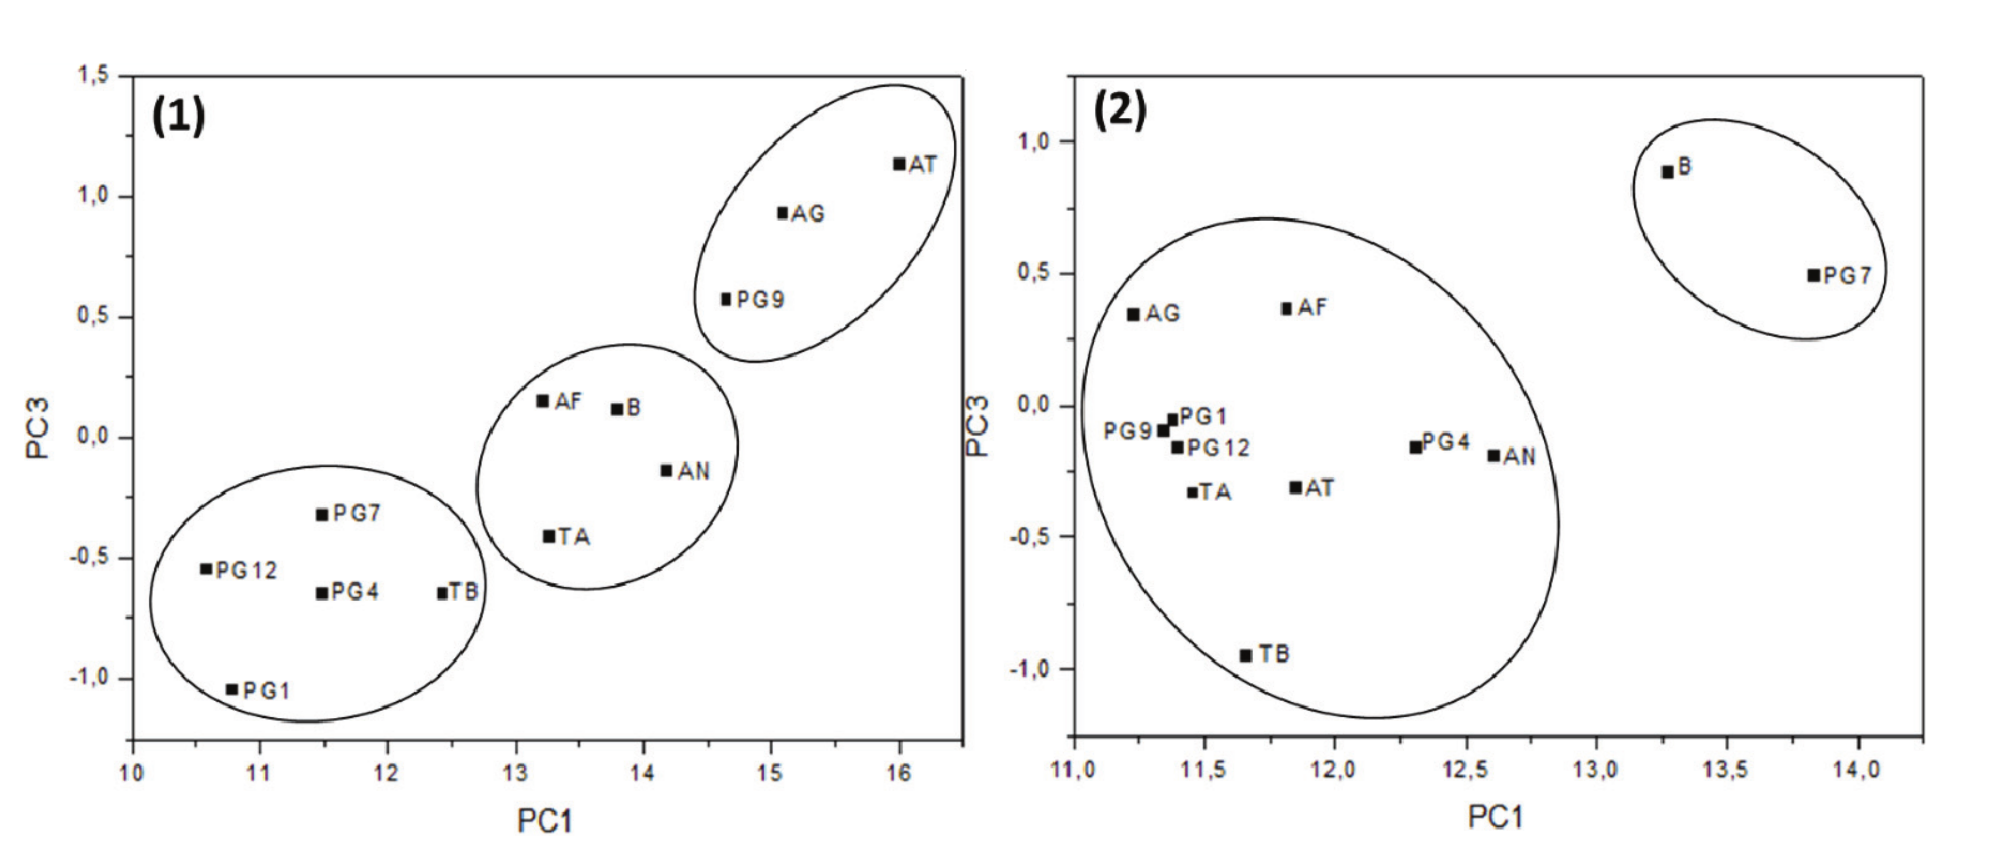
Figure 3.
Plots of PCA scores (PC1 x PC3) of (1) Desmodesmus subspicatus and (2) Chlorella sp., showing the best groups (not inserted in B group) of fungal strains to be selected for the hydrolysis step. B (control sample), AF (A. fumigatus USP-174), AG (A. gigantus MI 2012 G12-10), AT (A. terreus 233-3), AN (A. niger USP 9), PG1 (Penicillium MI 2012 G1), PG4 (Penicillium MI 2012 G4 A5), PG7 (Penicillium MI 2012 G7), PG9 (Penicillium MI 2012 G9), PG12 (Penicillium MI G12 A), TA (Trichoderma auriculares).
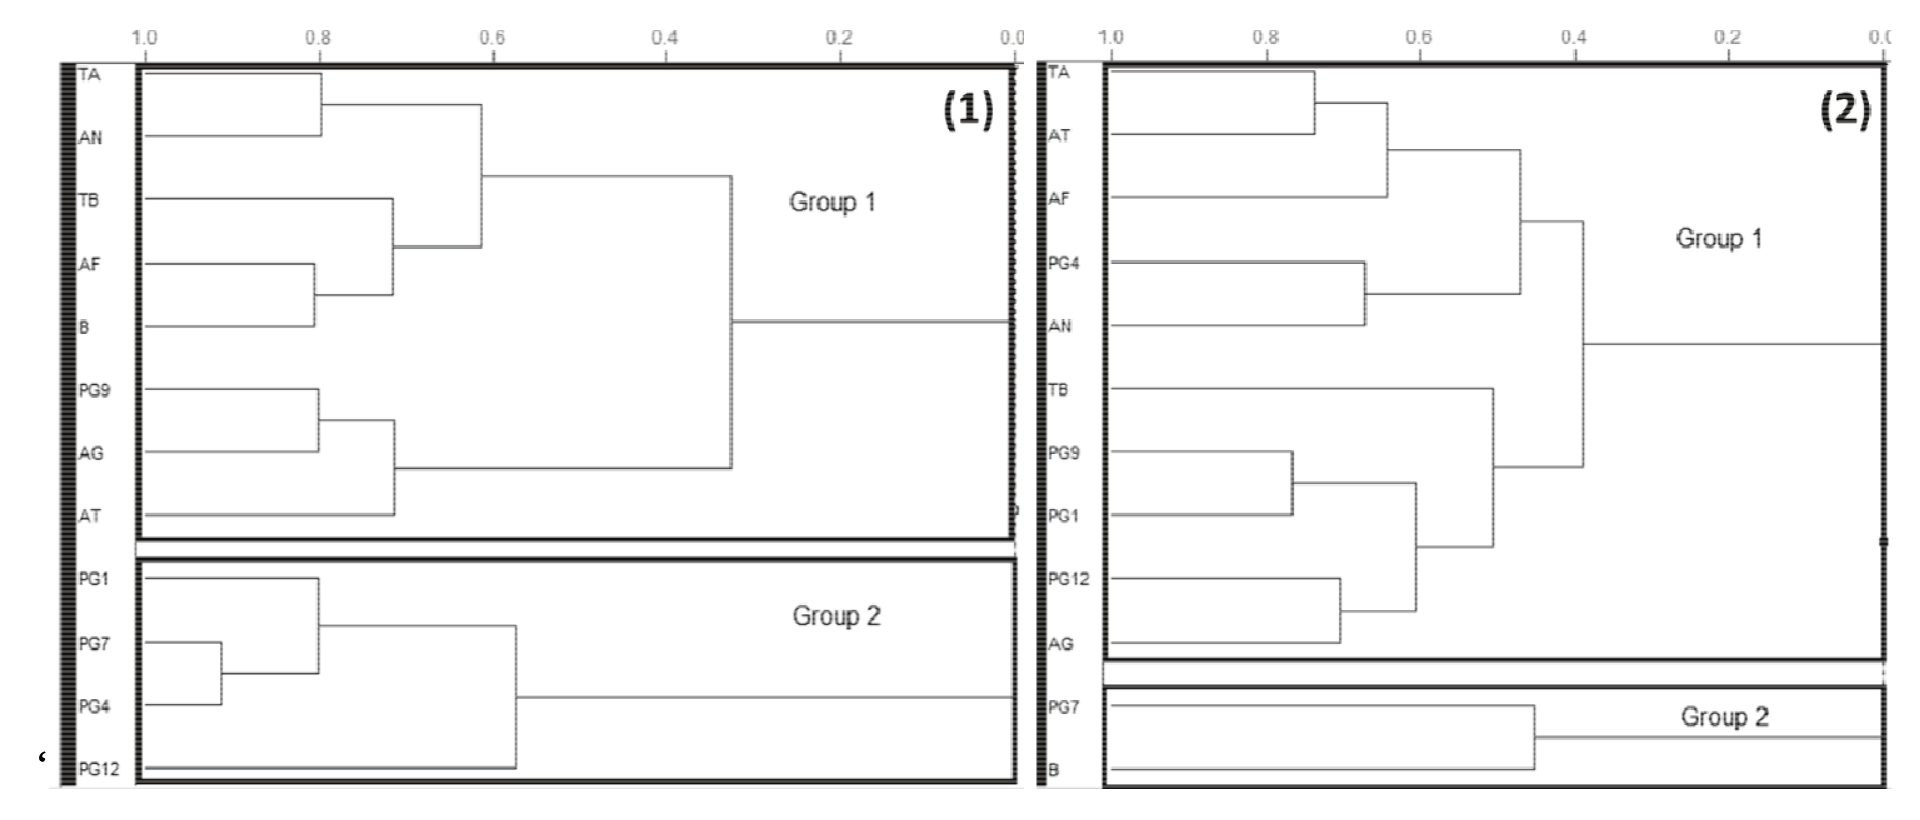
Figure 4.
Dendrogram generated from the analysis of (A) Desmodesmus subspicatus and (B) Chlorella sp. biomass hydrolyzed with different fungal strains showing two main groups. B (control sample), AF (A. fumigatus USP-174), AG (A. gigantus MI 2012 G12-10), AT (A. terreus 233-3), AN (A. niger USP 9), PG1 (Penicillium MI 2012 G1), PG4 (Penicillium MI 2012 G4 A5), PG7 (Penicillium MI 2012 G7), PG9 (Penicillium MI 2012 G9), PG12 (Penicillium MI G12 A), TA (Trichoderma auriculares).
The HCA analysis was useful to demonstrate that the fungi strains that were grouped together presented similar patterns of biomass uptake. The groups of fungi strains that resemble with the control sample (water and microalgae biomass, without fungi strains) were considered unsuitable to the further tests of hydrolysis. The dendrogram arrangement of Desmodesmus subspicatus in Figure 4(1) showed the formation of two distinct groups: Group 1, comprising the control and other fungal strains considered less favorable to interact with microalgal biomass; and Group 2, comprising only Penicillium strains, grouped according to similarities in the components present in this genus and showing a suitable profile for pretreatment considering the distance to the control sample.
For Chlorella sp., the HCA analysis in Figure 4(2) showed the distinction of two main groups: Group 1, containing most of the fungal strains capable of hydrolyzing biomass; and Group 2, containing only one fungal strain (Penicillium MI 2012 G7) and the control sample which, in this case, would not be useful for hydrolysis.
Hydrolysate sugars determination
To demonstrate the ability of the fungi examined and the efficiency of FTIR for screening, we selected two fungal strains from the dendrogram analysis. The Penicillium G12 strain was selected for the hydrolysis of D. subspicatus, and T. auriculares, for Chlorella sp.
The HPLC analysis was successfully applied and results demonstrated that analytical curves presented good linearity with r2 ≥ 0.99 for the evaluated sugars. The concentration of glucose and xylose per gram of biomass after lipid extraction and hydrolysis with fungal strains obtained by D. subspicatus was 1.9 and 1.3 mg mL-1, which represents a yield of 9.4 and 6.6%, respectively. For Chlorella sp., the concentration of glucose and xylose was 2.6 and 1.9 mg mL-1, which represents a yield of 12.9 and 9.6%, respectively.
The determination of sugars from raw materials demonstrated that pretreatment is crucial to improve the release of sugars, as this treatment effectively degrades complex carbohydrates (Sun & Cheng, 2002; Harun, Danquah, & Forde, 2010). In the present study, pretreatment was not performed, considering that several studies have revealed other alternatives for the release of sugars; for example, the addition of enzymes (Aikawa et al., 2013).
The use of different microorganisms for hydrolysis of biomass has primarily been evaluated at a low cost. The hydrolytic potential of microalgae biomass was identified in a group of fungi examined in the present study. Nevertheless, additional studies using commercial enzymes are required to optimize the hydrolysis conditions of these competitive strains with respect to time and rate of biotransformation.
The development of an easy and rapid method to select hydrolytic fungal strains is the main highlight of our research. FTIR followed by multivariate analysis was successfully applied to screen these microorganisms, distinguishing groups based on hydrolytic capacities.
Conclusion
FTIR followed by multivariate analysis was an efficient tool for screening fungi strains and could be considered environmentally friendly and a suitable alternative, since chemicals or commercial enzymes were not necessary for the hydrolysis step. Penicillium G12 and Trichodermaauriculares showed efficient performances to hydrolyze microalgal biomass. The full harnessing of microalgae biomass could be achieved, since the extracted lipids can be reserved for biodiesel production, while the remaining biomass can be used to obtain bioethanol. The application of FTIR for fungal strain selection to hydrolyze microalgae biomass of Chlorella sp. and Desmodesmus subspicatus to obtain sugars was successfully achieved.
Acknowledgements
The authors thank Capes Finance Code 001 and AES – Uruguaiana for scholarships to P.D.G, M.P.S, T.R.B and PNPD/CAPES – n. 1266911. Also to the Center for Research in Processes and Products Oleochemical and Biotechnological (MCTIC-01.0144.00/2010). This work was also financially supported by CNPq (09652/2016-2), Fapergs for the DOCFIX Scholarship and Productivity in research CNPq (306178/2012-5).
References
Aikawa, S., Joseph, A., Yamada, R., Izumi, Y., Yamagishi, T., Matsuda, F., ... Kondo, A. (2013). Direct conversion of Spirulina to ethanol without pretreatment or enzymatic hydrolysis processes. Energy and Environmental Science, 6, 1844-1849. doi: 10.1039/c3ee40305j
Baicha, Z., Salar-García, M., Ortiz-Martínez, V., Hernández-Fernández, F., Ríos, A., Labjar, N., ... Elmahi, M. (2016). A critical review on microalgae as an alternative source for bioenergy production: A promising low cost substrate for microbial fuel cells. Fuel Processing Technology, 154, 104-116. doi: 10.1016/j.fuproc.2016.08.017
Baierle, F., John, D. K., Souza, M. P., Bjerk, T. R., Moraes, M. S., Hoeltz, M., ... Schneider, R. C. S. (2015). Biomass from microalgae separation by electroflotation with iron and aluminum spiral electrodes. Chemical Engineering Journal, 267, 274-281. doi: 10.1016/j.cej.2015.01.031
Baum, A., Hansen, P. W., Meyer, A. S., & Mikkelsen, J. D. (2013). Simultaneous measurement of two enzyme activities using infrared spectroscopy: A comparative evaluation of PARAFAC, TUCKER and N-PLS modeling. Analytica Chimica Acta, 6(790), 14-23. doi: 10.1016/j.aca.2013.06.039
Bligh, E. G., & Dyer, W. J. (1959). A rapid method of total lipid extraction and purification. Canadian Journal of Biochemistry and Physiology, 37(8), 911-917. doi: 10.1139/o59-099
Brennan, L., & Owende, P. (2010). Biofuels from microalgae—a review of technologies for production, processing, and extractions of biofuels and co-products. Renewable and Sustainable Energy Reviews, 14(2), 557-577. doi: 10.1016/j.rser.2009.10.009
Chernova, N., & Kiseleva, S. (2017). Microalgae biofuels: Induction of lipid synthesis for biodiesel production and biomass residues into hydrogen conversion. International Journal of Hydrogen Energy, 42(5), 2861-2867. doi: 10.1016/j.ijhydene.2016.05.302
Daroch, M., Geng, S., & Wang, G. (2013). Recent advances in liquid biofuel production from algal feedstocks. Applied Energy, 102, 1371-1381. doi: 10.1016/j.apenergy.2012.07.031
Doan, T. T. Y., Sivaloganathan, B., & Obbard, J. P. (2011). Screening of marine microalgae for biodiesel feedstock. Biomass and Bioenergy, 35(7), 2534-2544. doi: 10.1016/j.biombioe.2011.02.021
Dong, X. Q., Yang, J. S., Zhu, N., Wang, E. T., & Yuan, H. L. (2013). Sugarcane bagasse degradation and characterization of three white-rot fungi. Bioresource Technology, 131, 443-451. doi: 10.1016/j.biortech.2012.12.182
Duygu, D., Udoh, A. U., Ozer, T., Akbulut, A., Erkaya, I., Yildiz, K., & Guler, D. (2012). Fourier transform infrared (FTIR) spectroscopy for identification of Chlorella vulgaris Beijerinck 1890 and Scenedesmus obliquus (Turpin) Kützing 1833. African Journal of Biotechnology, 11(16), 3817-3824. doi: 10.5897/AJB11.1863
Esquivel-Hernández, D. A., Ibarra-Garza, I. P., Rodríguez-Rodríguez, J., Cuéllar-Bermúdez, S. P., Rostro-Alanis, M. D. J., Alemán-Nava, G. S., ... Parra-Saldívar, R. (2016). Green extraction technologies for high-value metabolites from algae: a review. Biofuels, Bioproducts and Biorefining, 11(1), 215-231. doi: 10.1002/bbb.1735
Giordano, M., Kansiz, M., Heraud, P., Beardall, J., Wood, B., & McNaughton, D. (2001). Fourier transform infrared spectroscopy as a novel tool to investigate changes in intracellular macromolecular pools in the marine microalga Chaetoceros muellerii (Bacillariophyceae). Journal of Phycology, 37(2), 271-279. doi: 10.1046/j.1529-8817.2001.037002271.x
Girard, J. M., Deschênes, J. S., Tremblay, R., & Gagnon, J. (2013). FT-IR/ATR univariate and multivariate calibration models for in situ monitoring of sugars in complex microalgal culture media. Bioresource Technology, 144, 664-668. doi: 10.1016/j.biortech.2013.06.094
Gressler, P., Bjerk, T., Schneider, R. C. S., Souza, M. P., Lobo, E. A., Zappe, A. L., ... Moraes, M. S. A. (2014). Cultivation of Desmodesmus subspicatus in a tubular photobioreactor for bioremediation and microalgae oil production. Environmental Technology, 35(1-4), 209-219. doi: 10.1080/09593330.2013.822523
Hallenbeck, P. C., Grogger, M., Mraz, M., & Veverka, D. (2016). Solar biofuels production with microalgae. Applied Energy, 179, 136-145. doi: 10.1016/j.apenergy.2016.06.024
Harun, R., Danquah, M. K., & Forde, G. M. (2010). Microalgal biomass as a fermentation feedstock for bioethanol production. Journal of Chemical Technology & Biotechnology, 85(2), 199-203. doi: 10.1002/jctb.2287
Jiang, Y., Yoshida, T., & Quigg, A. (2012). Photosynthetic performance, lipid production and biomass composition in response to nitrogen limitation in marine microalgae. Plant Physiology and Biochemistry, 54, 70-77. doi: 10.1016/j.plaphy.2012.02.012
John, R. P., Anisha, G., Nampoothiri, K. M., & Pandey, A. (2011). Micro and macroalgal biomass: a renewable source for bioethanol. Bioresource Technology, 102(1), 186-193. doi: 10.1016/j.biortech.2010.06.139
Kansiz, M., Heraud, P., Wood, B., Burden, F., Beardall, J., & McNaughton, D. (1999). Fourier transform infrared microspectroscopy and chemometrics as a tool for the discrimination of cyanobacterial strains. Phytochemistry, 52(3), 407-417. doi: 10.1016/S0031-9422(99)00212-5
Khan, M. I., Lee, M. G., Shin, J. H., & Kim, J. D. (2017). Pretreatment optimization of the biomass of Microcystis aeruginosa for efficient bioethanol production. AMB Express, 7(1), 19-22. doi: 10.1186/s13568-016-0320-y
Koller, M., Muhr, A., & Braunegg, G. (2014). Microalgae as versatile cellular factories for valued products. Algal Research, 6(Part A), 52-63. doi: 10.1016/j.algal.2014.09.002
Kumar, S., & Barth, A. (2010). Following enzyme activity with infrared spectroscopy. Sensors, 10(4), 2626-2637. doi: 10.3390/s100402626
Lee, S. J., Lee, J. H., Yang, X., Kim, S. B., Lee, J. H., Yoo, H. Y., ... Kim, S. W. (2015). Phenolic compounds: Strong inhibitors derived from lignocellulosic hydrolysate for 2,3‐butanediol production by Enterobacter aerogenes. Biotechnology Journal, 10(12), 1920-1928. doi: 10.1002/biot.201500090
Liu, J., Mukherjee, J., Hawkes, J. J., & Wilkinson, S. J. (2013). Optimization of lipid production for algal biodiesel in nitrogen stressed cells of Dunaliella salina using FTIR analysis. Journal of Chemical Technology and Biotechnology, 88(10), 1807-1814. doi: 10.1002/jctb.4027
Mallick, N., Bagchi, S. K., Koley, S., & Singh, A. K. (2016). Progress and challenges in microalgal biodiesel production. Frontiers in microbiology, 7, 1-11. doi: 10.3389/fmicb.2016.01019
Markou, G., Angelidaki, I., & Georgakakis, D. (2012). Microalgal carbohydrates: an overview of the factors influencing carbohydrates production, and of main bioconversion technologies for production of biofuels. Applied Microbiology and Biotechnology, 96(3), 631-645. doi: 10.1007/s00253-012-4398-0
Milano, J., Ong, H. C., Masjuki, H., Chong, W., Lam, M. K., Loh, P. K., & Vellayan, V. (2016). Microalgae biofuels as an alternative to fossil fuel for power generation. Renewable and Sustainable Energy Reviews, 58, 180-197. doi: 10.1016/j.rser.2015.12.150
Neault, J. F., & Tajmir-Riahi, H. A. (1999). Structural analysis of DNA-chlorophyll complexes by Fourier transform infrared difference spectroscopy. Biophysics Journal, 76(4), 2177-2182. doi: 10.1016/S0006-3495(99)77372-8
Okamoto, K., Nitta, Y., Maekawa, N., & Yanase, H. (2011). Direct ethanol production from starch, wheat bran and rice straw by the white rot fungus Trametes hirsuta. Enzyme and Microbial Technology, 48(3), 273-277. doi: 10.1016/j.enzmictec.2010.12.001
Özçimen, D., Gülyurt, M. Ö., & İnan, B. (2012). Algal biorefinery for biodiesel production. In Z. Fang (Ed.), Biodiesel-feedstocks, production and applications (p. 25-57). Rijeka, HR: InTech DTP team.
Pacheco, R., Karmali, A., Serralheiro, M., & Haris, P. I. (2005). Application of fourier transform infrared spectroscopy for monitoring hydrolysis and synthesis reactions catalyzed by a recombinant amidase. Analytical Biochemistry, 346(1), 49-58. doi: 10.1016/j.ab.2005.07.027
Park, S., Kim, J., Park, Y., Son, S., Cho, S., Kim, C., & Lee, T. (2017). Comparison of batch cultivation strategies for cost-effective biomass production of Micractinium inermum NLP-F014 using a blended wastewater medium. Bioresource Technology, 234, 432-438. doi: 10.1016/j.biortech.2017.03.074
Raeesossadati, M., Ahmadzadeh, H., McHenry, M., & Moheimani, N. (2014). CO2 bioremediation by microalgae in photobioreactors: impacts of biomass and CO2 concentrations, light, and temperature. Algal Research, 6(Part A), 78-85. doi: 10.1016/j.algal.2014.09.007
Rasmussen, M., Shrestha, P., Khanal, S., Pometto, A., & van Leeuwen, J. H. (2010). Sequential saccharification of corn fiber and ethanol production by the brown rot fungus Gloeophyllum Trabeum. Bioresource Technology, 101(10), 3526-3533. doi: 10.1016/j.biortech.2009.12.115
Santos, C., Fraga, M. E., Kozakiewicz, Z., & Lima, N. (2010). Fourier transform infrared as a powerful technique for the identification and characterization of filamentous fungi and yeasts. Research in Microbiology, 161(2), 168-175. doi: 10.1016/j.resmic.2009.12.007
Schneider, R. C., Bjerk, T. R., Gressler, P. D., Souza, M. P., Corbellini, V. A., & Lobo, E. A. (2012). Potential production of biofuel from microalgae biomass produced in wastewater. In Z. Fang (Ed.), Biodiesel-feedstocks, production and applications (p. 4-24). Rijeka, HR: InTech DTP team.
Shokrkar, H., Ebrahimi, S., & Zamani, M. (2017). Bioethanol production from acid and enzymatic hydrolysates of mixed microalgae culture. Fuel, 200, 380-386. doi: 10.1016/j.fuel.2017.03.090
Silva, C. E. F., & Bertucco, A. (2016). Bioethanol from microalgae and cyanobacteria: a review and technological outlook. Process Biochemistry, 51(11), 1833-1842. doi: 10.1016/j.procbio.2016.02.016
Silva, C. E. F., & Bertucco, A., (2017). Dilute acid hydrolysis of microalgal biomass for bioethanol production: an accurate kinetic model of biomass solubilization, sugars hydrolysis and nitrogen/ash balance. Reaction Kinetics, Mechanisms and Catalysis, 122(2), 1095-1114. doi: 10.1007/s11144-017-1271-2
Singh, J., & Gu, S. (2010). Commercialization potential of microalgae for biofuels production. Renewable and Sustainable Energy Reviews, 14(9), 2596-2610. doi: 10.1016/j.rser.2010.06.014
Skory, C. D., Freer, S. N., & Bothast, R. J. (1997). Screening for ethanol-producing filamentous fungi. Biotechnology Letters, 19(3), 203-206. doi: 10.1023/A:1018337003433
Sluiter, A. (2008). Determination of sugars, byproducts, and degradation products in liquid fraction process samples. Golden, CO: Laboratory Analytical Procedure (LAP)/Technical Report.
Song, C., Liu, Q., Ji, N., Deng, S., Zhao, J., Li, S., & Kitamura, Y. (2016). Evaluation of hydrolysis-esterification biodiesel production from wet microalgae. Bioresource Technology, 214, 747-754. doi: 10.1016/j.biortech.2016.05.024
Stehfest, K., Toepel, J., & Wilhelm, C. (2005). The application of micro-FTIR spectroscopy to analyze nutrient stress-related changes in biomass composition of phytoplankton algae. Plant Physiology and Biochemistry, 43(7), 717-726. doi: 10.1016/j.plaphy.2005.07.001
Sun, Y., & Cheng, J. (2002). Hydrolysis of lignocellulosic materials for ethanol production: a review. Bioresource Technology, 83(1), 1-11. doi: 10.1016/S0960-8524(01)00212-7
Tan, H., Aziz, A. A., & Aroua, M. (2013). Glycerol production and its applications as a raw material: A review. Renewable and Sustainable Energy Reviews, 27, 118-127. doi: 10.1016/j.rser.2013.06.035
Tan, S. T., Balasubramanian, R. K., Das, P., Obbard, J. P., & Chew, W. (2013). Application of mid-infrared chemical imaging and multivariate chemometrics analyses to characterise a population of microalgae cells. Bioresource Technology, 134, 316-323. doi: 10.1016/j.biortech.2013.01.060
Wang, Y., Yuan, B., Ji, Y., & Li, H. (2013). Hydrolysis of hemicellulose to produce fermentable monosaccharides by plasma acid. Carbohydrate Polymers, 97(2), 518-522. doi: 10.1016/j.carbpol.2013.05.017
Yoon, J. J., Cha, C. J., Kim, Y. S., & Kim, W. (2008). Degradation of cellulose by the major endoglucanase produced from the brown-rot fungus Fomitopsis pinicola. Biotechnology Letters, 30(8), 1373-1378. doi: 10.1007/s10529-008-9715-4
Author notes
michelehoeltz@gmail.com