Biotechnology
Analysis of leaflet flutter in biological prosthetic heart valves using PIV measurements
Analysis of leaflet flutter in biological prosthetic heart valves using PIV measurements
Acta Scientiarum. Technology, vol. 42, 2020
Universidade Estadual de Maringá

This work is licensed under Creative Commons Attribution 4.0 International.
Received: 18 February 2018
Accepted: 20 June 2018
Abstract: The use of biological prosthetic valves has increased considerably in recent decades since they have several advantages over mechanical ones, but they still possess the great disadvantage of having a relatively short lifetime. An understudied phenomenon is the flutter effect that causes oscillations in the cusps, which is associated with regurgitation, calcification and fatigue, which can reduce even more the lifetime of bioproteses. In an experimental bench that simulates the cardiac flow, the behavior of a porcine and a bovine pericardium valves was recorded by a high-speed camera to quantify the oscillations of the cusps and an experiment using particle image velocimetry was conducted to study the velocity profiles and shear stresses and their relations with flutter. Results showed that the pericardial valve has lower values of frequencies and amplitudes compared to the porcine valve. Lower velocity values were found in the cusps that did not have flutter, but no relationship was observed between shear stress values and leaflet vibrations. These results may assist in future projects of biological prosthetic valves that have less flutter and longer lifespan.
Keywords: cardiovascular engineering, prosthetic cardiac valves, flutter, bioengineering.
Introduction
The number of adults with heart valve malfunctions and diseases increase every year due to global population aging. The replacement of the biological heart valves with artificial ones has been used to solve part of the cardiovascular problems, such as valve regurgitation, stenosis, among others. Every year, approximately 290,000 patients undergo cardiac valve replacement surgery, a number that is projected to reach 850,000 by the year 2050 (Hasan et al., 2014). However, artificial valves still cause innumerous implications and patients have to deal with problems like calcification, possible infections, thrombosis, angina, and others (Dasi, Simon, Sucosky, & Yoganathan, 2009; Nachlas, Li, & Davis, 2017; Motta, Lintas, Fioretta, Hoerstrup, & Emmert, 2018). Studies on valve dynamics can help manufacturers to understand and solve future problems.
An understudied condition is the phenomenon of flutter of heart valve cusps. Flutter is a phenomenon in physics that consists of a structural vibration caused in objects by the interaction with a fluid stream. Oscillations generated in the cusps of cardiac valves work in the same dynamics, the vibration is induced by the energy exchanged between the blood flow and the leaflet (Avelar, Stófel, Canestri, & Huebner, 2017b). The fluttering of leaflets is associated with calcification, hemolysis, regurgitation and especially fatigue (Louie, Mason, Sha, Bienarz, & Moore, 1988; Peacock, 1990; Grigioni, Daniele, D’avenio, & Barbaro, 2001; Hsu, 2001; De Hart, Peters, Schreurs, & Baaijens, 2004) and is considered more destructive than any other mechanism (Ionescu, 2014). However, flutter is still not completely understood and there is little literature relating the oscillation in leaflets and its risks to prosthetic heart valves lifetime.
Particle image velocimetry (PIV) is a procedure that can be applied to analyze the fluid motion through image processing, which is frequently used in analysis of fluid dynamics in prosthetic valves (Moore & Dasi, 2014; Bazan, Ortiz, Fukumasu, Pacifico, & Yanagihara, 2016; Del Gadio, Gasbarroni, & Romano, 2016). Since blood cell damage is directly induced by shear stresses and the time which they are exposed to it, PIV analysis can be of extreme importance for the understanding of some complications such as thromboembolism and hemolysis (Lim, Chew, Chew, & Low, 1998).
Prosthetic valves have been largely studied and it is possible to find different models in the market. Materials such as porcine and bovine pericardium are commonly used in biological prosthetic valves (Hasan et al., 2014; Ionescu, 2014; Nachlas et al., 2017; Motta et al., 2018). These valves have the advantage of slightly changing the hemodynamics and have the smallest chance of clot formation among the other valves (Motta et al., 2018). Recent work have studied experimentally frequencies and amplitudes of flutter in biological heart valves, acquiring a dimensionless curve to predict the onset of the oscillations based on mechanical and geometric properties of prosthetic tissues (Avelar, Canestri, Bim, Huebner, & Pinotti, 2017a). Another study created a mathematical model based on eingenvalues to predict system instabilities caused by fluid flow and start of vibrations, and results were compared to experimental data, finding analytical response below experimental ones, an outcome usually found in flutter analytical theories (Avelar et al., 2017b). Yet, still no work was found in the literature relating flutter with the risk of platelet activation and hemolysis. Therefore, this paper presents an investigation of the flow field structure comparing velocity profiles and shear stress distribution on the fluid in one porcine and one bovine pericardium valves when flutter is acting in the leaflets.
Material and methods
Two newly acquired biological valves, one porcine and one bovine pericardial, were studied. Both were from Braile Biomédica (Braile Biomédica Ind., São José do Rio Preto, Brazil). Table 1 lists the specifications of the employed valves from their datasheets. The average thickness of each leaflet was measured with a micrometer (Mitutoyo, Kawasaki, Japan).
Test bench
The test bench employed meets the ISO 5840-2005 standard. It is able to perform tests involving direct continuous, reverse continuous and pulsatile flow. In continuous mode, it is able to perform tests in the range of 5.0 to 25.0 L min.-1.
A schematic drawing of the bench is illustrated in Figure 1. Pneumatic valves are used to select the test mode. For continuous flow, valves 1 and 2 are opened, and the others are closed; the centrifugal pump is then actuated, and fluid is pumped from the reservoir, through the cardiac valve and back to the reservoir. Sensor elements include a pressure transducer and electromagnetic flowmeters. Subsystem consists of a frequency inverter, centrifugal pump and three-phase motor. More details of the test bench can be found in other references (Avelar et al., 2017b; 2017a).
The fluid used in the experiment was a mixture by mass of glycerin/water (40/60), with a density (ρ) of 1099.3 kg m-3 and dynamic viscosity (μ) of 3.72 mPa.s, the solution was chosen for having a kinematic viscosity analogue to blood.
Continuous flow was the only mode chosen for this study, with various tests in flow increments of 5.0 L min.-1 to obtain multiple data from different stages in the cardiac cycle. The maximum flow rate was 25.0 L min.-1, a value consistent with peak systolic rate (Zeidan et al., 2003; Mahnken et al., 2006).
Leaflet tracking
For flutter measurement a high-speed camera and computer algorithms to process the videos were employed to quantify the leaflet oscillation frequencies. A Phantom v7.3 camera (Vision Research, Wayne, U.S.A.) was used to film the leaflets movements. The camera, which recorded videos with a resolution of 800 x 600 pixels and a frame-rate of 2000 fps, was positioned in front of the test bench and obtained a front view of the attached valve (Figure 2). For proper lighting, four 12.0 V LED lamps running at their maximum power were installed.
| Model | Material | Valve type | Annular diameter | Internal diameter | Mean thickness | Protrusion height | Source |
| (mm) | (mm) | (mm) | (mm) | ||||
| A19-8316 | Bovine Pericardium | Aortic | 19.0 | 14.0 | 0.221 | 7.0 | Braile Biomédica |
| A19-8431 | Porcine | Aortic | 19.0 | 15.0 | 0.154 | 9.0 | Braile Biomédica |
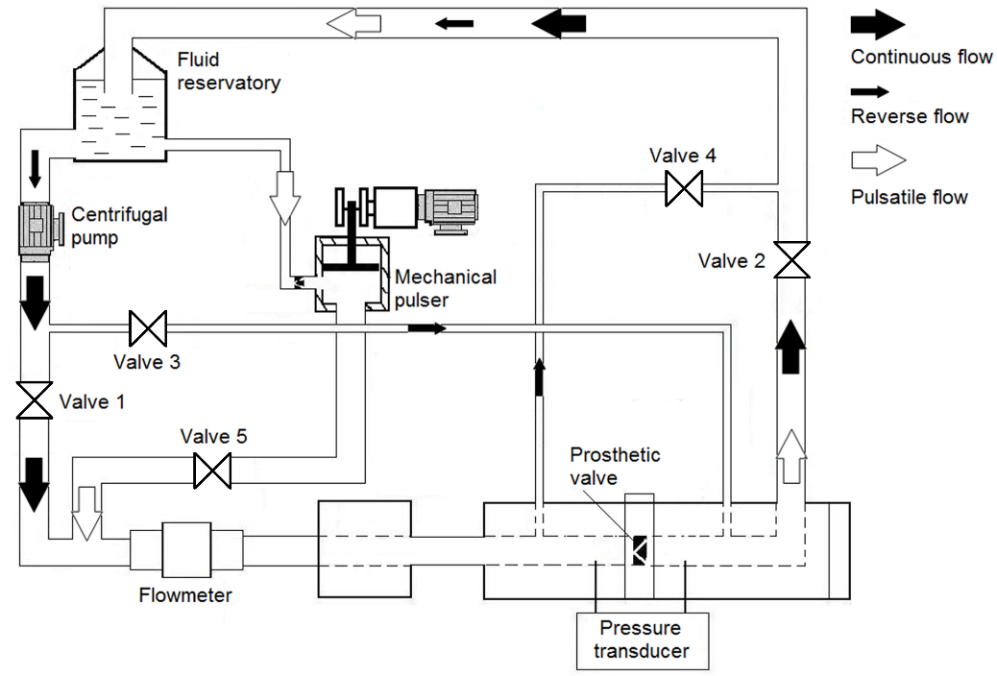
Figure 1.
Schematic diagram of the experimental bench. Continuous mode performs tests from 5.0 to 25.0 L min.-1 and pulsatile mode performs tests from 30.0 to 120.0 bpm.
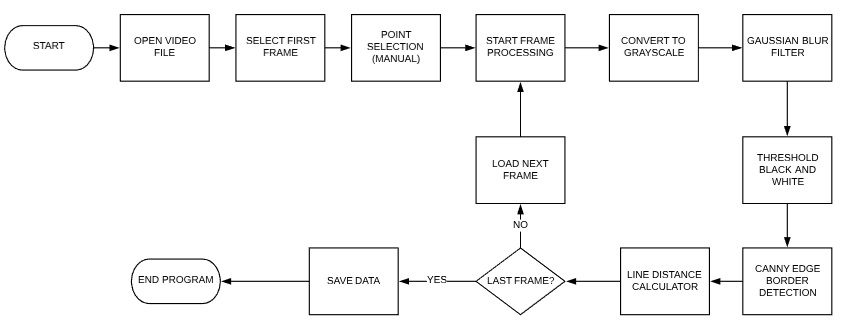
Figure 2.
Workflow of the algorithm used for flutter quantification
A C++ algorithm, shown as a workflow in Figure 2, was used to perform the flutter quantifications. It uses a method of measuring line lengths for the calculation of various degrees of freedom at each cusp. First, a circular region of interest is manually selected, corresponding to the valve annular diameter, and three points where the leaflets meet in the annular support edge are then marked by the operator. The program then automatically joins the circle center with these points and divides the region for each cusp. For each frame, a conversion to grayscale is made, followed by a Gaussian blur filter and black and white threshold for image noise reduction (Gonzalez & Woods, 2002), and Canny edge border detection, all of which are available as C++ libraries. Lines are drawn from the center of the circle to the edge of the leaflet, and the algorithm measures the lengths of these lines for each frame, making it possible to measure the variation of this parameter for the entire video. Nine equally angularly spaced lines are drawn to measure several degrees of freedom for each leaflet, as shown in Figure 3. Calibration is subsequently done in an image editor from the measurement of the internal diameter of the valve holder which is visible in the videos. A Fast Fourier Transform (FFT) finds the frequency of the length of each line’s oscillation in the obtained signal. The algorithm was validated by measuring different circles of known diameters and inspecting for the center being correctly found and all lines having equal lengths. Ten videos were made, each consisting of 1.25 s of flow and 1.0 GB of storage.
PIV measurements
The commercial PIV software, DynamicStudio (Dantec Dynamics, Skovlunde, Denmark) was used for data acquisition and processing (Figure 4A). Velocity vectors were calculated using adaptive cross-correlation approaches from a 24 x 24 pixel interrogation area. This area size was compatible with the interval between laser pulses, since it minimized the loss of particles between frames leading to a good correlation between images. A number of 50 pair of images with a resolution of 2048 x 2048 pixels was collected for each experiment; post-processing was performed using adaptive median filtering to obtain an average of all information to create vector plots along with standard deviations. The effective spatial resolution was 15 μm per pixel, and the temporal resolution was 16 Hz. Quantitative vector plots were created for all flow rates. Alumina was used as the inseminating particles.
Post-processing focused on the velocity profiles downstream of the valves and its shear stress. (τxy), given as Equation 1:
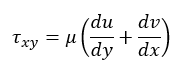 (1)
(1)where:
u and v are the velocities in the x and y directions, respectively. Viscous stress was chosen instead of Reynolds stress because the PIV frequency is too low to find significant variations in velocities, in addition to studies arguing that the Reynolds stress is not a proper measurement for the mechanical load in the fluid, while the viscous stress is instantaneous and gives more significant results (Ge, Dasi, Sotiropoulos, & Yoganathan, 2008).
The valve was positioned with its cusp facing upward in order to evaluate the oscillation perturbation in the flow along the laser plane, each valve was rotated 120° twice for the study of each of the three cusps, labeled A, B And C. The laser plane was positioned according to Figure 4B and the image was calibrated from the bench internal diameter of 35.0 mm.
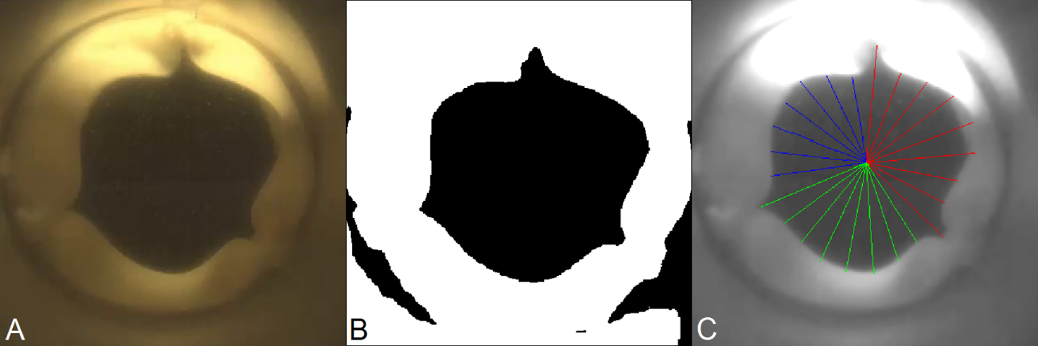
Figure 3.
Different moments of signal processing. (A) Original video, (B) threshold showing the leaflets edges, (C) lines created using software to measure the oscillations
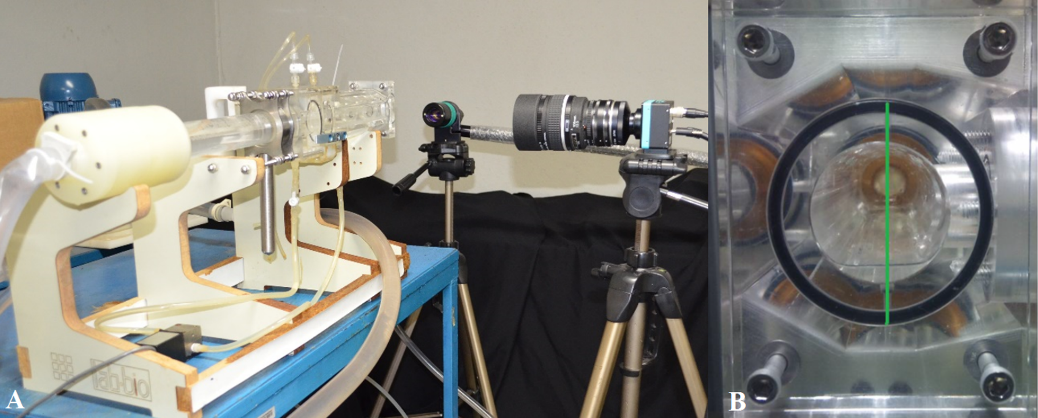
Figure 4.
PIV experiment. A) Camera and laser positioning. B) Laser plane positioned in the center of the flow duct.
Results
Table 2 list the dominant frequencies and amplitudes of cusp vibrations measured in the experiment. For both valves, two cusps began showing oscillations in the flow of 15 L min.-1 and one began in 20 l min.-1. On average, the porcine valve had higher frequencies and amplitudes than the bovine pericardium, although both presented vibrations of the same magnitude. At maximum flow rate, the porcine valve frequency was 286.8 ± 80.6 Hz and amplitude was 0.85 ± 0.56 mm, while in the bovine pericardium valve, the frequency was 202.8 ± 92.1 Hz and amplitude was 0.33 ± 0.34 mm.
The highest velocities found in the porcine valve at the flow rate of 15 L min.-1 at each cusp were 2.75 at A (Figure 5A); 1.82 in B (Figure 5D); and 2.52 m s-1 in C (Figure 5G). In this flow, the lowest maximum velocity was found in cusp B, which had not yet begun fluttering. In the flow rate of 20 L min.-1, the maximum velocities were similar, being 3.62 in cusp A (Figure 5B); 3.65 in B (Figure 5E); and 3.78 m s-1 in C (Figure 5H). In the flow rate of 25 L min.-1, the highest velocities were 3.60 in cusp A (Figure 5C); 4.16 in B (Figure 5F); and 4.35 m s-1 in C (Figure 5I). Standard deviations in velocity profiles ranged from 0.47 in the lowest flow rate to 2.0 m s-1 in the highest flow rate.
In the bovine pericardium valve, at a flow rate of 15 L min.-1, the highest velocities were 1.78 in the cusp A (Figure 6A); 1.57 in B (Figure 6D); and 1.72 m s-1 in C (Figure 6G). The lowest maximum velocity occurred again at cusp B, where flutter had not yet started. At the flow rate of 20 L min.-1, the maximum velocities were 2.66 in cusp A (Figure 6 B); 2.26 in B (Figure 6E); and 2.36 m s-1 in C (Figure 6 H). At the flow rate of 25 L min.-1, the highest velocities were 2.82 in cusp A (Figure 6 C); 2.06 in B (Figure 6 F); and 2.41 m s-1 in C (Figure 6 I). Standard deviations in velocity profiles ranged from 0.49 in the lowest flow rate to 1.6 m s-1 in the highest flow rate.
| Porcine | Bovine Pericardium | |||||
| Flow rate (L min.-1) | 15 | 20 | 25 | 15 | 20 | 25 |
| Leaflet | Frequency (Hz) | Frequency (Hz) | ||||
| A | 203.8 | 191.9 | 324.3 | 88.8 | 99.1 | 97.5 |
| B | - | 172.9 | 194.3 | - | 217.3 | 243.0 |
| C | 228.4 | 310.9 | 341.8 | 200.6 | 241.9 | 268.0 |
| Amplitude (mm) | Amplitude (mm) | |||||
| A | 1.44 | 0.47 | 1.49 | 0.25 | 0.24 | 0.73 |
| B | - | 0.17 | 0.58 | - | 0.09 | 0.13 |
| C | 0.69 | 0.52 | 0.48 | 0.13 | 0.15 | 0.14 |
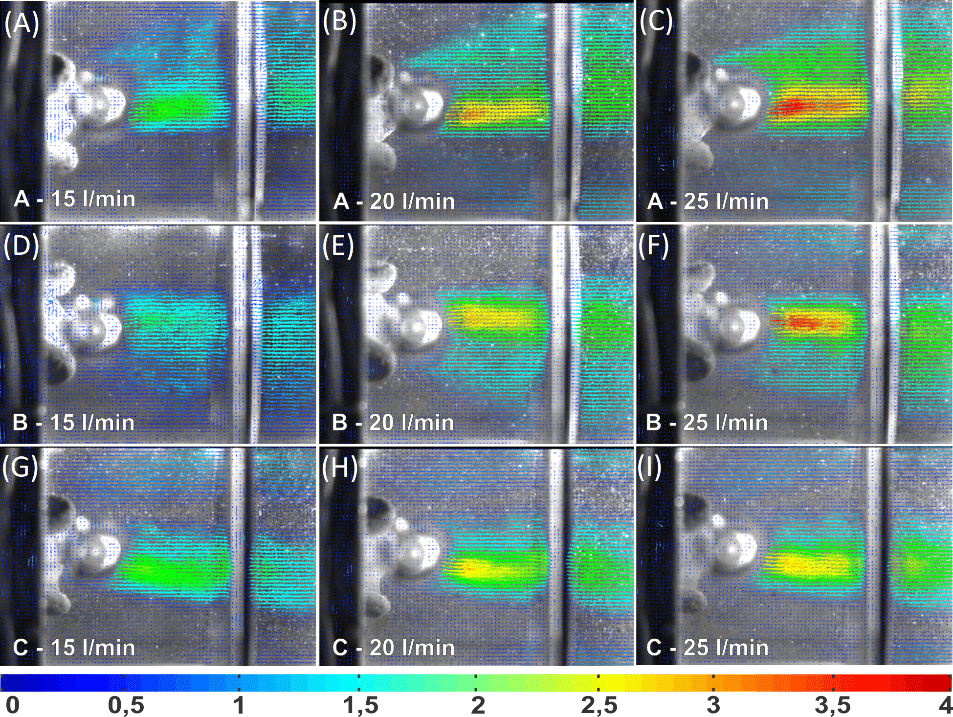
Figure 5.
Velocity profiles for the porcine valve.
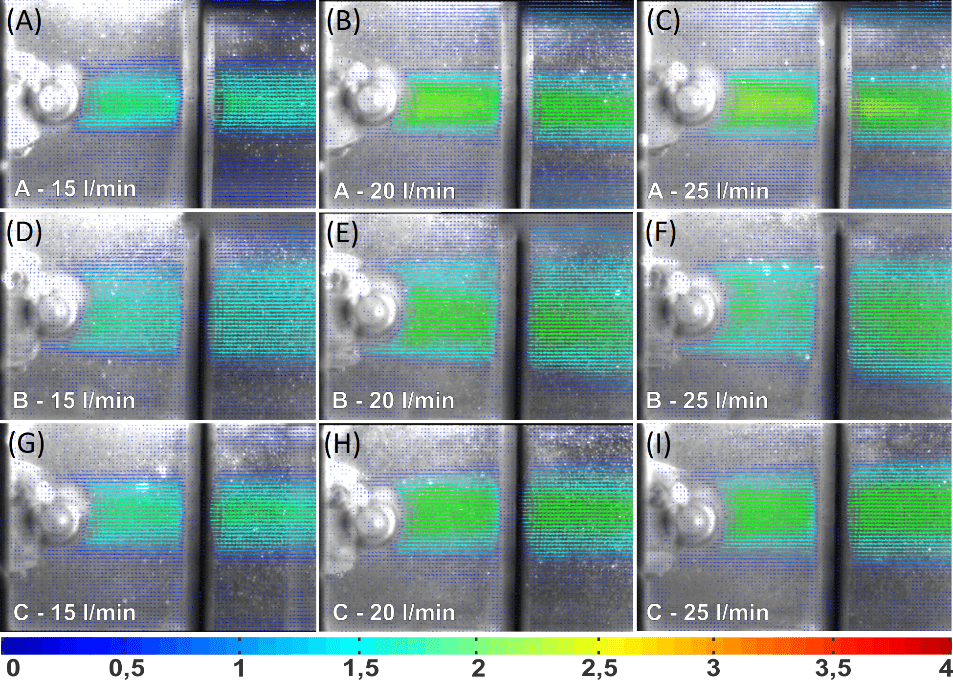
Figure 6.
Velocity profiles for the bovine pericardium valve.
The highest velocities and deviations were found in the porcine valve, besides obtaining a less uniform flow field than the pericardium valve. Figure 5 shows that the cusps A and B have a divergent flow with velocity components in the vertical plane, whereas the pericardium valve has a more homogeneous and parallel profile to the flow. Similar results for porcine and bovine pericardium valves are found in the literature (Yoganathan, He, & Jones, 2004; Bazan et al., 2016).
For the shear stress in the porcine valve, the highest values were 3.62 in cusp A (Figure 7A); 3.26 in B (Figure 7D); and 2.84 N m-2 in C (Figure 7G). The lowest maximum stress did not occur at cusp B, where flutter had not yet begun, but at cusp A where it already had oscillations. At the flow rate of 20 L min.-1, the maximum stresses were 4.77 on cusp A (Figure 7B); 4.55 in B (Figure 7E); and 3.62 N m-2 in C (Figure 7H). At the flow rate of 25 L min.-1, the highest stresses were 5.55 in cusp A (Figure 7C); 4.89 in B (Figure 7F); and 3.61 N m-2 in C (Figure 7I).
For the shear stress in the pericardium valve, the highest values were 2.16 in cusp A (Figure 8A); 2.11 in B (Figure 8D); and 2.00 N m-2 in C (Figure 8G). The lowest maximum stress did not occur at cusp B, where flutter had not started, but at cusp A, which had oscillations. At the flow rate of 20 L min.-1, the maximum stresses were 3.53 at cusp A (Figure 8B); 2.76 in B (Figure 8E); and 2.17 N m-2 in C (Figure 8H). At the flow rate of 25 L min.-1, the highest stresses were 3.28 at cusp A (Figure 8C); 2.21 in B (Figure 8F); and 2.17 N m-2 in C (Figure 8I).
Discussion
In most cases, cusps frequencies and amplitudes increased with increasing flow rate, reaching its maximum value in the 25 L min.-1 flow. This increase is in accordance with the general theory of flutter found in the literature (Watanabe, Suzuki, Sugihara, & Sueoka, 2002; Virot, Amandolese, & Hémon, 2013; Avelar et al., 2017a). Flutter started from a critical speed and frequencies appeared suddenly in a high order of magnitude, not increasing from lower to higher values. Thus, even if flutter occurs in the short time of the peak systolic flow, it is expected that a significant number of oscillations will occur for each heartbeat.
Table 2 shows that the bovine pericardium valve has mean frequencies and amplitudes lower than the porcine one. These findings in bovine pericardium are in agreement with other studies that found no oscillations at various flows (Rainer, Christopher, Sadler, & Hilgenber, 1979; Ionescu, 2014) or lower frequency vibrations (Louie et al., 1988; Avelar et al., 2017a).The higher thickness of the cusps, as verified in Table 1, besides higher values of elastic modulus may explain the greater resistance to flutter of the bovine pericardium (Patterson, Howard, & Thornton, 1996; Kalejs et al., 2009; Xiong et al., 2010; Avelar et al., 2017a). However, results differ from the findings of Moore and Dasi (2014), in which flutter was not found in a porcine valve in a similar glycerin solution, although the authors studied a 25 mm valve with larger effective orifice area and, consequently, a smaller systolic peak velocity at 25 L min.-1, which may have caused the difference in results.
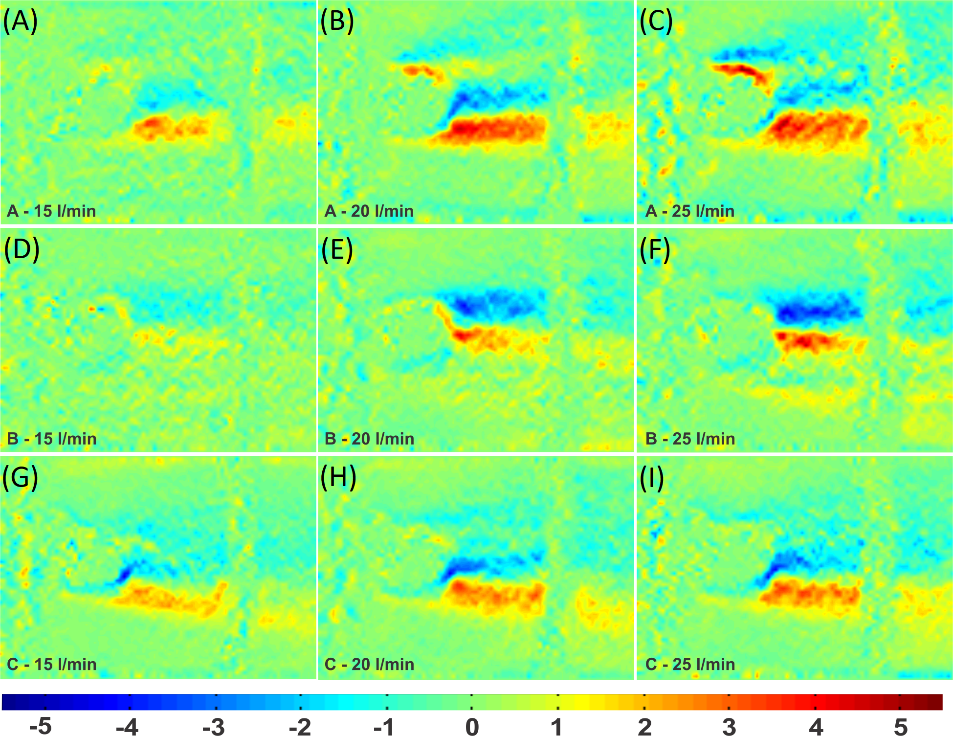
Figure 7.
Viscous shear stress in the porcine valve.
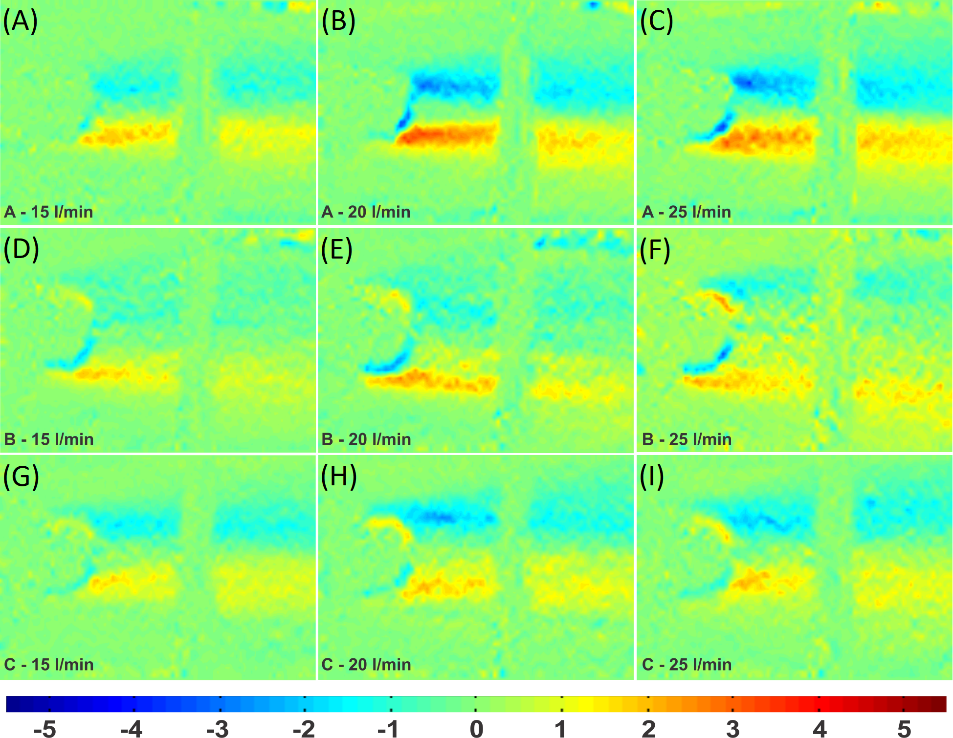
Figure 8.
Viscous shear stress in the bovine pericardium valve.
The PIV measurements showed that, for the lowest flow, the smallest velocity values were found in the cusps that did not have flutter. However, it is not yet possible to make any assertion regarding velocity components when all cusps present vibrations at higher flows, since higher velocities are not associated with higher frequencies or amplitudes. Furthermore, no high amplitude vortex was detected in both valves for any of the flows. Nevertheless, the hypothesis that there is a relationship between vortices and flutter should not yet be discarded in a future study with a greater number of valves and use of a high frequency PIV.
The velocity profiles for all cusps of the pericardium valve were more uniform and with lower shear stress values than those of the porcine, results in accordance with the literature (Yoganathan et al., 2004). The instantaneous shear stress was between -5.5 and 5.5 N m-2, lower than the limits of 10 N m-2 found in other studies, which may cause platelet activation, and much lower than the limits of hemolysis (Ge et al., 2008; Bark et al., 2017).
Although flutter is detrimental to cusp fatigue, no interference was found among the oscillations in the shear stress, since at a flow rate of 15 L min.-1, in which some cusps presented flutter and others did not, the lowest stress values did not belong to the leaflets, which did not oscillate. Still further studies should be done with a higher frequency PIV equipment to discard the hypothesis that flutter affects the possibility of hemolysis and platelet activation.
Although there is no consensus as to which biological valve is better, with several studies reporting that they have statistically similar performance in respect to lifespan, thromboembolism, among others (Gao, Wu, Grunkemeier, Furnary, & Starr, 2004; Yap, Murphy, Devbhandari, & Venkateswaran, 2013), a study which takes into consideration the resistance of these prostheses to flutter and its consequences in the long term remains to be done.
The greatest limitation of the study was the use of a low-frequency PIV. For the magnitude of oscillation frequencies, the PIV experiments may not have verified subtle variations in velocity and stress profiles. A larger number of valves for testing are also required to achieve further results about the flutter influence on velocities and shear stresses.
Nevertheless, the present work gave new perspectives for the study of flutter in biological valves. The quantification of the oscillations is the first step for future heart valve studies, which could have lower vibration frequencies and, consequently, less fatigue effects. The lower frequencies and amplitudes found in the pericardial valve are another positive aspect for the good results already found in relation to the more homogeneous velocity profile and lower shear stresses. The characteristics that provide better results to the pericardium valve can help in the design of new porcine bioprostheses that are more resistant to flutter and that possibly have a longer lifetime.
Conclusion
The present work focused on the study of flutter in the cusps of a porcine and a bovine pericardium valve and its consequences on the flows in an experimental bench. No differences were detected in the onset velocity of oscillations in both valves, but the pericardial valve had lower frequencies and amplitudes than porcine. The PIV measurements showed that the bovine pericardium valve has more homogeneous velocity profiles and lower viscous shear stress values than the porcine valve, in addition, it was verified that flutter alters the maximum velocity values of the flow, but no disturbance was verified in the viscous shear stress, possibly due to the frequency limitations of the PIV equipment used. While it is known that flutter is detrimental to valve lifetime, few existing studies focus on this problem. The effect is related to calcification, regurgitation and fatigue failure. The quantification of vibration and its consequences in the flow is an important step to research a way to manufacture biological valves that do not suffer from flutter and are less likely to have clot formation. The relatively short lifespan of biological prosthetic valves is the greatest current limitation, and the consequent flutter reduction can increase their durability and get closer to the ideal prosthetic valve.
Acknowledgements
The authors would like to acknowledge Braile Biomédica Ind. for the donations of the cardiac valves used in this study.
References
Avelar, A. H. F., Canestri, J. A., Bim, C., Huebner, R., & Pinotti, M. (2017a). Quantification and analysis of leaflet flutter on biological prosthetic cardiac valves. Artificial Organs, 41(9), 835-844. doi: 10.1111/aor.12856
Avelar, A. H. F., Stófel, M. A. G. E., Canestri, J. A., & Huebner, R. (2017b). Analytical approach on leaflet flutter on biological prosthetic heart valves. Journal of the Brazilian Society of Mechanical Sciences and Engineering, 39(12), 4849-4858. doi: 10.1007/s40430-017-0908-4
Bark Jr., D. L., Vahabi, H., Bui, H., Movafaghi, S., Moore, B., Kota, A. K., … Dasi, L. P. (2017). Hemodynamic performance and thrombogenic properties of a superhydrophobic bileaflet mechanical heart valve. Annals of Biomedical Engineering, 45(2), 452-463. doi: 10.1007/s10439-016-1618-2
Bazan, O., Ortiz, J. P., Fukumasu, N. K., Pacifico, A. L., & Yanagihara, J. I. (2016). Influence of tricuspid bioprosthetic mitral valve orientation regarding the flow field inside the left ventricle: in vitro hydrodynamic characterization based on 2D piv measurements. Artificial Organs, 40(2), 175-179. doi: 10.1111/aor.12515
Dasi, L. P., Simon, H. A., Sucosky, P., & Yoganathan, A. P. (2009). Fluid mechanics of artificial heart valves. Clinical and Experimental Pharmacology and Physiology, 36(2), 225-237. doi: 10.1111/j.1440-1681.2008.05099.x
De Hart, J., Peters, G. W. M., Schreurs, P. J. G., & Baaijens, F. P. T. (2004). Collagen fibers reduce stresses and stabilize motion of aortic valve leaflets during systole. Journal of Biomechanics, 37(3), 303-311. doi: 10.1016/S0021-9290(03)00293-8
Del Gadio, C., Gasbarroni, P. L., & Romano, G. P. (2016). Experimental investigations on the fluid-mechanics of an electrospun heart valve by means of particle image velocimetry. Journal of the Mechanical Behavior of Biomedical Materials, 64, 229-239. doi: 10.1016/j.jmbbm.2016.07.030
Gao, G., Wu, Y., Grunkemeier, G. L., Furnary, A. P., & Starr, A. (2004). Durability of pericardial versus porcine aortic valves. Journal of the American College of Cardiology, 44(2), 384-388. doi: 10.1016/j.jacc.2004.01.053
Ge, L., Dasi, L. P., Sotiropoulos, F., & Yoganathan, A. J. (2008). Characterization of hemodynamic forces induced by mechanical heart valves: reynolds vs. viscous stresses. Annals of Biomedical Engineering, 36(2), 276-297. doi: 10.1007/s10439-007-9411-x
Gonzalez, R. C., & Woods, R. E. (2002). Digital image processing (2nd ed.). Upper Saddle River, GB: Prentice Hall.
Grigioni, M., Daniele, C., D’avenio, G., & Barbaro, V. (2001). Laser doppler anemometry study of bidimensional flows downstream of three 19 mm bileaflet valves in the mitral position, under kinematic similarity. Annals of Biomedical Engineering, 28(2), 194-203. doi: 10.1114/1.244
Hasan, A., Ragaert, K., Swieszkowki, W., Selimović, Š., Paul, A., Camci-Unal, G., … Khademhosseini, A. (2014). Biomechanical properties of native and tissue engineered heart valve constructs. Journal of Biomechanics, 47(9), 1949-1963. doi: 10.1016/j.jbiomech.2013.09.023
Hsu, C. H. (2001). Numerical study and dynamic behaviour analysis of mechanical heart valve. Biomedical Engineering-Applications Basis Communications, 13(6), 283-295. doi: 10.4015/S1016237201000364
Ionescu, M. I. (2014). In the beginning: conception, construction and clinical use of the first pericardial valve. In Graham, T. Society of cardiothoracic surgery in great britain and ireland, the pericardial heart valve, the odyssey of a continuously evolving concept (p. 1-34). London, GB: CPL Associates.
Kalejs, M., Stradinsa, P., Lacisa, R., Ozolantab, I., Pavarsa, J., & Kasyanovb, V. (2009). St Jude Epic heart valve bioprostheses versus native human and porcine aortic valves - comparison of mechanical properties. Interactive CardioVascular and Thoracic Surgery, 8(5), 553-557. doi: 10.1510/icvts.2008.196220
Lim, W. L., Chew, Y. T., Chew, T. C., & Low, H. T. (1998). Steady flow dynamics of prosthetic aortic heart valves: a comparative evaluation with PIV techniques. Journal of Biomechanics, 31(5), 411-421. doi: 10.1016/S0021-9290(98)00026-8
Louie, E. K., Mason, T. J., Sha, R., Bienarz, T., & Moore, A. M. (1988). Determinants of anterior mitral leaflet fluttering in pure aortic regurgitation from pulsed doppler study of the early diastolic interaction between the regurgitant jet and mitral inflow. American Journal of Cardiology, 61(13), 1085-1091. doi: 10.1016/0002-9149(88)90131-2
Mahnken, A. H., Mühlenbruch, G., Koos, R., Stanzel, S., Busch, P. S., Niethammer, M., … Wildberger, J. E. (2006). Automated vs. manual assessment of left ventricular function in cardiac multidetector row computed tomography: comparison with magnetic resonance imaging. European Radiology, 16(7), 1416-1423. doi: 10.1007/s00330-006-0226-1
Moore, B., & Dasi, L. P. (2014). Spatiotemporal complexity of the aortic sinus vortex. Experiments in Fluids, 55(7), 1770. doi: 10.1007/s00348-014-1770-0
Motta, S. E., Lintas, V., Fioretta, E. S., Hoerstrup, S. P., & Emmert, M. Y. (2018). Off-the-shelf tissue engineered heart valves for in situ regeneration: current state, challenges and future directions. Expert Review of Medical Devices, 15(1), 35-45. doi: 10.1080/17434440.2018.1419865
Nachlas, A. L. Y., Li, S., & Davis, M. E. (2017). Developing a clinically relevant tissue engineered heart valve - a review of current approaches. Advanced Healthcare Materials, 6(24), 1700918. doi: 10.1002/adhm.201700918
Patterson, E. A., Howard, I. C., & Thornton, M. A. (1996). A comparative study of linear and nonlinear simulations of the leaflets in a bioprosthetic heart valve during the cardiac cycle. Journal of Medical Engineering & Technology, 20(3), 95-108. doi: 10.3109/03091909609008387
Peacock, J. A. (1990). An in vitro study of the onset of turbulence in the sinus of Valsalva. Circulation Research, 67(2), 448-460. doi: 10.1161/01.RES.67.2.448
Rainer, W. G., Christopher, R. A., Sadler, T. R., & Hilgenber, A. D. (1979). Dvnamic behaviour of prosthetic aortic tissue valves as viewed by high-speed cinematography. The Annals of Thoracic Surgery, 28(3), 274-280. doi: 10.1016/S0003-4975(10)63120-7
Virot, E., Amandolese, X., & Hémon, P. (2013). Fluttering flags: an experimental study of fluid forces. Journal of Fluids and Structures, 43, 385-401. doi: 10.1016/j.jfluidstructs.2013.09.012
Watanabe, Y., Suzuki, S., Sugihara, M., & Sueoka, Y. (2002). An experimental study of paper flutter. Journal of Fluids and Structures, 16(4), 529-542. doi: 10.1006/jfls.2001.0435
Xiong, F. L., Goetz, W. A., Chong, C. K., Chua, Y. L., Pfeifer, F., Wintermantel, E., & Yeo, J. H. (2010). Finite element investigation of stentless pericardial aortic valves: relevance of leaflet geometry. Annals of Biomedical Engineering, 38(5), 1908-1918. doi: 10.1007/s10439-010-9940-6
Yap, K. H., Murphy, R., Devbhandari, M., & Venkateswaran, R. (2013). Aortic valve replacement: is porcine or bovine valve better? Interactive CardioVascular and Thoracic Surgery, 16(3), 361-373. doi: 10.1093/icvts/ivs447
Yoganathan, A. J., He, Z., & Jones, S. C. (2004). Fluidmechanics of heart valves. Annual Review of Biomedical Engineering, 6(1), 331-362. doi: 10.1146/annurev.bioeng.6.040803.140111
Zeidan, Z., Erbel, R., Barkhausen, J., Hunold, P., Bartel, T., & Buck, T. (2003). Analysis of global systolic and diastolic left ventricular performance using volume–time curves by real-time three-dimensional echocardiography. Journal of the American Society of Echocardiography, 16(1), 29-37. doi: 10.1067/mje.2003.40