Technological Information
Short-term forecasting models for automated data backup system: segmented regression analysis
Short-term forecasting models for automated data backup system: segmented regression analysis
Acta Scientiarum. Technology, vol. 42, e46073, 2020
Universidade Estadual de Maringá

Esta obra está bajo una Licencia Creative Commons Atribución 4.0 Internacional.
Recepción: 02 Enero 2019
Aprobación: 17 Julio 2019
Abstract: The Information and Communication Technology (ICT) becomes a critical area to business success; organizations need to adopt additional measures to ensure the availability of their services. However, such services are often not planned, analyzed and monitored, which impacts the assurance quality to customers. The backup is the service addressed in this study, with the object of study of the automated data backup systems in operation at the Federal University of Itajuba - Brazil. The main objective of this research was to present a logical sequence of steps to obtain short-term forecast models that estimate the point at which each recording media reaches its storage capacity limit. The input data was collected in the metadata generated by the backup system, with 2 years data window. For the implementation of the models, the simple univariate linear regression technique was employed in conjunction, in some cases, with the simple segmented linear regression. In order to discover the breakpoint, a targeted approach to residual analysis was applied. The results obtained by the iterative implementation of the proposed algorithm showed adherence to the characteristics of the analyzed series, with accuracy measures, regression significance, normality residual through control charts, model adjustment, among others. As a result, an algorithm was developed for integration into automated backup systems using the methodology described in this study.
Keywords: data backup, short term forecast, segmented single linear regression.
Introduction
High availability to systems, applications and services are critical to the organizations, so the ICT increasingly becomes a critical area to business success, and additional measures have to be addressed. Several factors such as cyber-attacks, network failures, hardware failure, among others, could jeopardize the continuity of businesses that depend entirely or partially on ICT (Laudon & Laudon, 2012).
Lucio-Nieto, Colomo-Palacios, Soto-Acosta, Popa, and Amescua-Seco (2012) argue that organizations are demanding for more efficient methods for managing services in order to offer high quality for internal and external customers. According to Owens, Wilson, and Abell (2019), information is increasingly seen as a valuable asset of an organization and as an example, we have: customer information, financial records, business processes, functional records, among others. The global consumption of data stored by users, businesses and governments are increasing; a market analysis shows that the overall revenue data storage connected to the business may reach $6.5 billion in 2015 (Pamies-Juarez, Datta, & Oggier, 2013) and the information technology costs constitute a significant component for information technology dependence for organizations (Kwiatkowski & Verhoef, 2013).
The data stored in databases continue to grow as a result of the need that organizations have to obtain, store and generate more information constantly. Much of the costs of maintaining such large amounts of recorded data with security is present in the storage media and resources used in the system management (Muthukumar & Ravichandran, 2012).
The backup consists in a redundant data copy, so the information can be restored if there is any kind of data lost (Wolff, 2007). This is a service of security in information technology area. According to Burgess and Reitan (2007), disk backups are an important area for system policy, deciding when to schedule data archiving, in order to protect against data loss. Generally, the data may be lost due to accidental or intentional deletion, physical and logical failures of information systems or natural disasters (Saxena, Claeys, Bruneel, & Walraevens, 2019). In recent years, natural disasters, terrorist attacks, civil wars have increased worldwide. Such disasters not only cause damage to infrastructure, but important information and data may be lost (Couto, Secci, Campista, & Costa, 2015).
Ntalampiras (2016) points to the importance of system availability under the new smart electrical grids, which encompass information and communication technologies; the cyber-attacks could bring unfortunate consequences to all connected systems. Chen (2016) provided metrics to assess system vulnerability and algorithms to identify critical nodes, which can be applied in information systems.
However, the data backup is intended to ensure business continuity. Laudon and Laudon (2012) include backup as one of the items of the disaster recovery plan, made up of strategies to restore ICT services after disruptions caused by uncontrollable variables. The backup is also defined by ISO/IEC 17799:2005 as important part for maintaining the integrity and availability of information and processing resources. The importance of data backup service for organizations is highlighted by Fu, Xiao, Liao, and Liu (2013), Laudon and Laudon (2012), Pamies-Juarez et al. (2013) and Xia, Yin, Lopez, Machida, and Trivedi (2014).
Corporations need to maintain stored data for corporate governance, regulatory compliance, legal support and assistance to various strategic management actions. The storage level is one of the quantitative metrics used in the evaluation of backup strategies. This metric evaluates the probability of the storage system to operate without fail (Tallon, 2013;Sengupta & Annervaz, 2014).
In the literature, there are numerous studies that adopt forecasting approach in various areas of knowledge: prices, stock market, consumer demands, etc. Furthermore, few studies employing any quantitative approach based on modeling and statistical tools applied to quality ICT services are found, among which we can highlight the work of Herbst, Huber, Kounev, and Amrehn (2012), Xia et al. (2014) and Lee, Cho, Hong, and Yoon (2016).
However, an applied short-term forecasting methodology based on historical data using the storage system can be considered a decision-making support tool, assisting the monitoring capacity so that no errors occur due to lack of media with space available for data recording.
The object of study in this work was an automated data backup system in the Federal University of Itajuba data center. Its overall objective was to design a logical sequence of steps in order to obtain short-term forecasting models able to estimate at which point each recording media reaches its storage capacity limit. In this way, the proposed algorithm was applied and validated through the collected records (backup metadata), and then a generic pseudo-code was designed, so the process can be automated.
Material and methods
The ICT subject is still little explored in studies that make use of any forecasting methodology, as a support tool, for planning, monitoring and decision making. The historical data on system activity are very valuable because they can be analyzed to assist in planning the future growth of the system. Chamness (2014) describes the architecture of a forecasting capability tool for backup systems. Also, according to the author, the error rate of a linear regression model can be significantly reduced with the application of regression on a subset (or segment) of data representing the latest best behavior of the series.
According to Nisbet, Miner, and Elder (2009) segmented linear regression performs a pre-processing of the series, when knots or breakpoints are primarily determined, where there are perceptible changes of the slope, as shown in Figure 1.
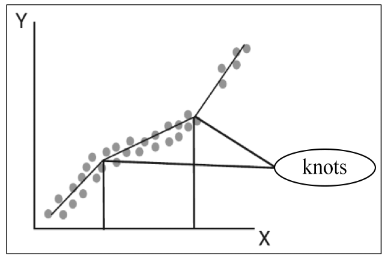
Figure 1.
Knots and breakpoints determination (Nisbet, Miner, & Elder, 2009).
In a second step, the linear regression is applied to each segment obtained, and if necessary, the combined results ratio is presented. To find the breaking point, Chamness (2014) uses a technique based solely on searching for the highest R2 value (coefficient of determination). R2 is an accuracy measure with an amplitude ranging between 0 and 1, as stated in Equation 1.
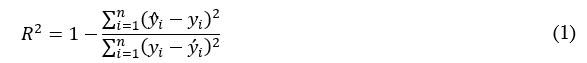
The calculation is made by dividing the sum of squared residuals  by the total sum of squares
  , which is the sum of the squared differences between the mean and each observed value. So, the model selection with higher R2 is equivalent to selecting the model that minimizes the sum of squared residuals. According to Montgomery, Jennings, and Kulahci (2011), high values of R2 suggest a good fit to the historical data, but do not guarantee that the forecast errors are reduced. The technique to find the Chamness (2014) breakpoint performs successive analysis of a set of close observations (X0, Y0) to the beginning (Xn, Yn) of the series to find the highest value of R2.
The prediction model is selected by the results of linear regression in the segments where by trial and error it comes to the set with the highest value of R2. In Figure 2, there is an example of how a breakpoint is found with this approach.
The approach of segmented linear regression proposed by Chamness (2014) to obtain the breakpoint does not take into account other model of accuracy measures such as residual analysis. However, according to Mahmoud, Parker, Woodall, and Hawkins (2007), many authors have studied the breakpoint problem in the regression context on different objects of study. There is in the literature other ways to estimate the breakpoint adjusted to each specific case. Examples of the application of segmented regression in other areas of knowledge can be seen in Muggeo (2003), Malash and El-Khaiary (2010), Shao, Li, and Xu (2009), Lavazza and Morasca (2011) and Jin and Shi (2012).
According to Chatterjee and Hadi (2013), Montgomery et al. (2011) and Chamness (2014) regarding the regression analyses and the methodological application context, this work proposes the implementation of an algorithm to be applied as a backup forecast in automated backup systems. The flow chart in Figure 3 shows the regression model analysis steps.
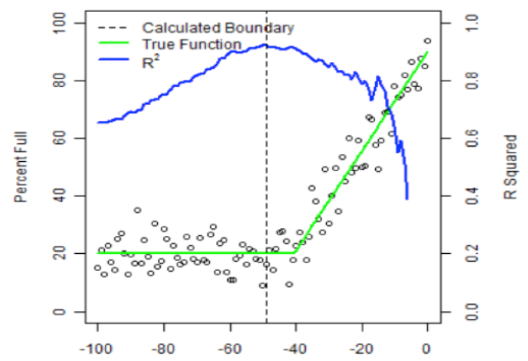
Figure 2.
Finding breakpoint (Chammes, 2014).
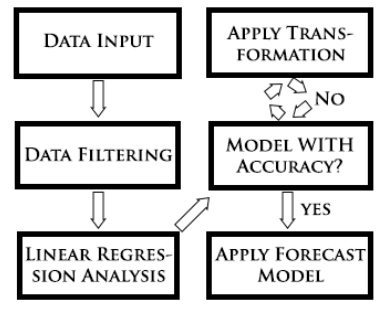
Figure 3.
Regression model analysis steps.
Data input
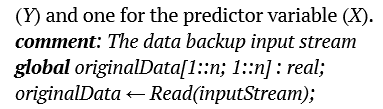
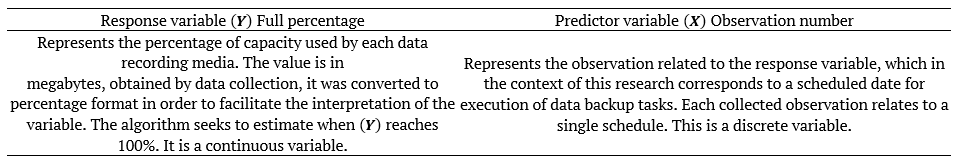
At this early stage, the process is fed with data collected through the preliminary treated records in each series. The data must be arranged in matrix form, with a column for observations of the response variable (Y) and one for the predictor variable (X).
The variables used for this regression analysis are described in Table 1.
Data filtering
The purpose of this step is to remove data that contain registry errors. According to Chatfield (2003), it is essential to make a careful evaluation of all available data collected. Responding to three primary issues: a) were the variables recorded with the necessary precision? b) how is the data useful and usable? c) are there obvious input errors, outliers, or missing data? The quality of the analysis depends on how appropriate the data filtering was done.

In the context of the Algorithm part 2, the filter function will receive the original data and will eliminate the observations equals to zero and the repeated observations, these that represent errors in the execution of the backup job service.
Linear regression analysis
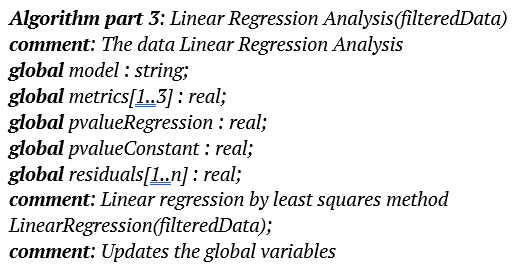
In this step the prediction model is obtained. Regression analysis is a statistical tool widely used and considered a more parsimonious method in the investigation of the functional relationship between variables, being applied in many areas of knowledge. The relationship is expressed as an equation or model that connects the response or dependent variable (Y) to the predictor (explanatory) variables (X). Regression analysis can be viewed as an iterative process, in which the outputs are used to diagnose, validate, criticize, and possibly modify the entries. The process must be repeated until a satisfactory output is obtained (Chatterjee & Hadi, 2013). In the Algorithm part 3, the simple linear regression model function is used, and can be observed in Equation 2.

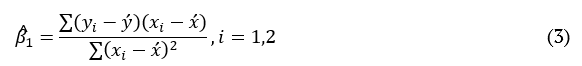
In Equation 2, the (Y) variable is the response, X1 is the predictor, b0 and b1 are the model parameters (regression coefficients) and Î is an error term. The coefficient b1, called the slope, can be interpreted as the change in Y influenced by the amount of change in X. The coefficient b0, called constant, is the expected value of Y when X = 0. To estimate the unknown parameters b0 and b1, the method of least squares can be employed. This method aims to calculate a line that minimizes the sum of squares of the vertical distance between each point on the line, which is the error in the response variable (Chatterjee & Hadi, 2013). Equation 3 and 4 represent the formulation to estimate the parameters:

Model accuracy
At this stage, the accuracy of the obtained model must be analyzed to check the possibility to improve it through metrics and appropriate tests, validating it before application. Starting with the iterative process proposed in Algorithm part 4, with the analysis of the model residual through control charts as a key point.
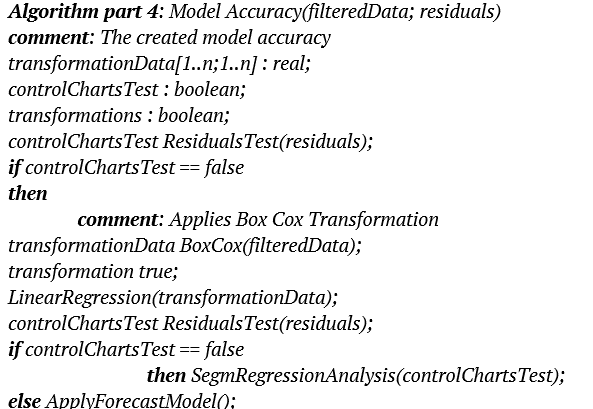
In this context, if the residual is out of control, step ‘Apply Transformation’ of the flowchart will be triggered to correct or minimize the points. By being more parsimonious and effective, this algorithm applies only an individual test for the verification of residual, considering outside upper control limit (UCL), the residual over 3 standard deviations se, and for lower control limit (LCL), the residual bellow 3 standard deviations s e of the me axis, as in Equation 5, 6 and 7 and the example in Figure 4.


It is necessary to secondarily analyze through the p-value the significance test of regression and the constant term significance test (b0). In a small percentage of the series analyzed in this paper, it was necessary to remove the term (b0) to improve the model. It was considered significant the term with p-value < 0.05.
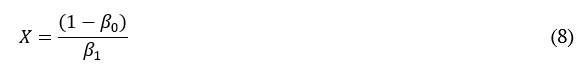
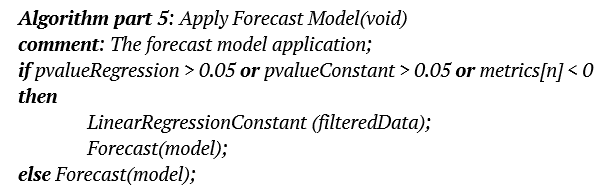
Apply forecast model
Once the model is satisfactory in the analysis provided in step ‘Model With Accuracy’, the model can be applied to answer the research question: at what point the backup media will reach 100% capacity? i.e., to find the value of (X) to the intended point (Y = 1), according to Equation 8 and the Algorithm part 5.

Changes in the number and/or segmented regression analysis
In this iterative process step, the model which failed in step ‘Model With Accuracy?’ will be adapted through changes in the data series and, if necessary, a segmented regression analysis will be applied. The first corrective action is the transformation of the data series. However, even if the model has been approved in step ‘Model With Accuracy?’, it is possible to apply transformations in the series (step ‘Apply Transformation’) in order to consider a possible improvement in the model before sending it to step ‘Apply Forecast Model’.
Transformations in series
A strategy usually adopted when out of control residual is found is to apply transformations in the series. According to Montgomery et al. (2011), data transformations are often useful to stabilize the variance of the data, since the inconstant variance is quite common in time series. A commonly applied approach for the correction is the box-cox transformation. As Samagaio and Wolters (2010) stated, box-cox transformation can be useful to correct the non-normality and residual variation. In this approach, data is processed in accordance with Equation 9 and 10.


The W variable receives the transformed value of the response variable Y by the λ parameter. For the implementation, the Minitab software was used to obtain the optimal value of λ. Obtaining the optimal value takes into account the analysis of the range points with the smallest standard deviation, as observed in Figure 5. After processing, steps ‘Linear Regression Analysis’ and ‘Model With Accuracy’ are performed again, if the model is still not satisfactory, a segmented regression analysis will be applied to the series.
Segmented regression analysis
The regression analysis is only applied in the current segment of the series, i.e., which better represents the latest change of data behavior. Segmentation will occur after discovering the breakpoint. For the determination of the breakpoint, the technique based on the analysis of the model residual will be employed. Throughout the tests, it was observed that a change in the slope of the line had a start point observation that showed the highest residual value set outside the control limits (LCL and UCL). That is, when applying the linear regression again in the data segment from this observation, it was found significant improvements in the model. The improvement is especially regarding the residual, that is often under control after the regression analysis only in the segment. In Figure 7 to 9, it is possible to observe the application in real data. Note that the observation X = 30 has the highest residual value set outside the control limits. When applying linear regression analysis only in the segment from observation X = 30, it is noted that residual was under control, representing more faithfully the new behavior of the series until its end. In some conditions, the process need to be redone iteratively again and again until the residual is under control or, depending on the case, with the smallest possible number of failed points in the test, according to a sequential order of actions by trial and error for breakpoint selection as the following restrictions:
i) Residual farther from the LCL or UCL;
ii) Next residual in descending distance order from LCL or UCL;
iii) With no more residual out of control, follow the chronological order.
So that there is no possibility of infinite loop in any case, it is essential to establish a stop condition to the process. Then, a minimum of 5 observations (in the segment) as a stopping parameter to the regression analysis is defined, as stated in Algorithm part 6.
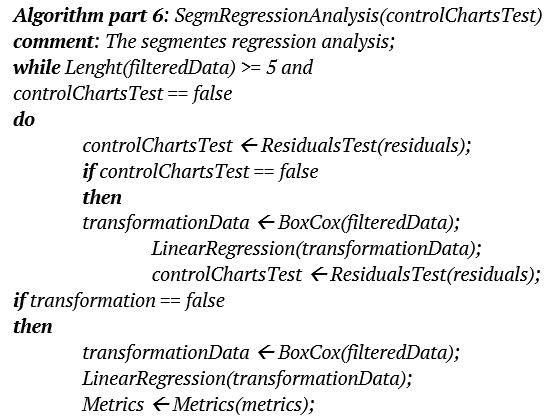
Figure 6 to 9 describe a detailed case of application of the breakpoint discovery process:
- Through the scatter plot, containing all observations, it is possible to notice the detachment of the regression line in relation of the points due to the number of behaviors change in a given time, observed in Figure 6;
- The individual control chart of residual presents several points out of control, suggesting that the model is not yet satisfactory. The points around x = 30 indicates the farthest residue UCL, as can be observed in Figure 7;
- Scatter plot with a regression line more adjusted to each segment, emphasizing the second segment representing the most recent behavior of the series, as can be observed in Figure 8;
- Individual control chart of the most recent residual segment that passed the test, i.e. those under control, as can be observed in Figure 9.
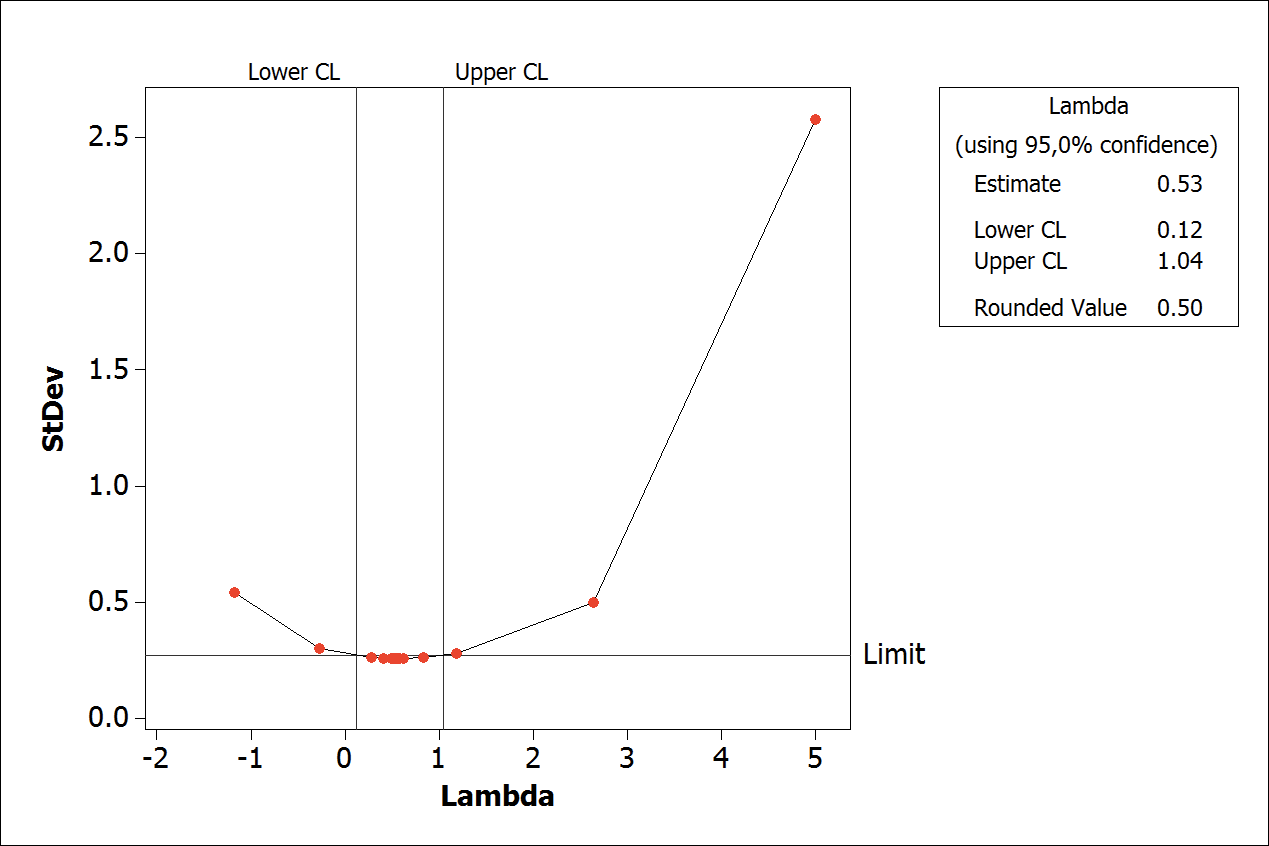
Figure 5.
Example of best value of Lambda (l).
All this iterative process that seeks the most adjusted model runs along the algorithm repeatedly from step ‘Model with Accuracy?’ of the Figure 3. The choice of the most appropriate forecast method depends largely on the nature of the time series, the a priori knowledge, the accuracy required, in addition to available computing resources (Le Borgne, Santini, & Bontempi, 2007). Currently in the literature there is a continuous search for the best method. However, according to Chatfield (2003), it is clear that no single method can overcome all other methods in all situations, i.e., any case depends on what is expected for better results, the context is always crucial.
Results and discussion
Object of study
In this study, each series of collected data represents the write cycle in a backup media (data cartridge), from the beginning of the recording, to the depletion of storage capacity. Data collection was conducted from metadata recorded by the automated system backup from Federal University of Itajuba, Brazil. Altogether, 98 series containing 2,647 observations from 2 years were collected. The distribution of the number of observations for each group is shown in Figure 10 and much of the observed series exhibit short-term feature.
Results
The results presented and discussed below were obtained by the execution of the proposed algorithm and detailed in material and methods. In total, 98 series were analyzed, but the algorithm could be used only in 83, as shown in Figure 11. In the other 15 series, the reason that the algorithm could not be used was:
- Series containing less than 5 observations: such occurrence is justified by the fact that some backup jobs service demanded large amount of data recorded in a short time. A behavior that resulted in the use of the full capacity of the recording media almost immediately, preventing any predictive analysis.
- Write Failure: as the backup job service starts, the system detects failures (physical or logical errors) and aborts the task in the current media, and the next task is performed in the adjacent available media.
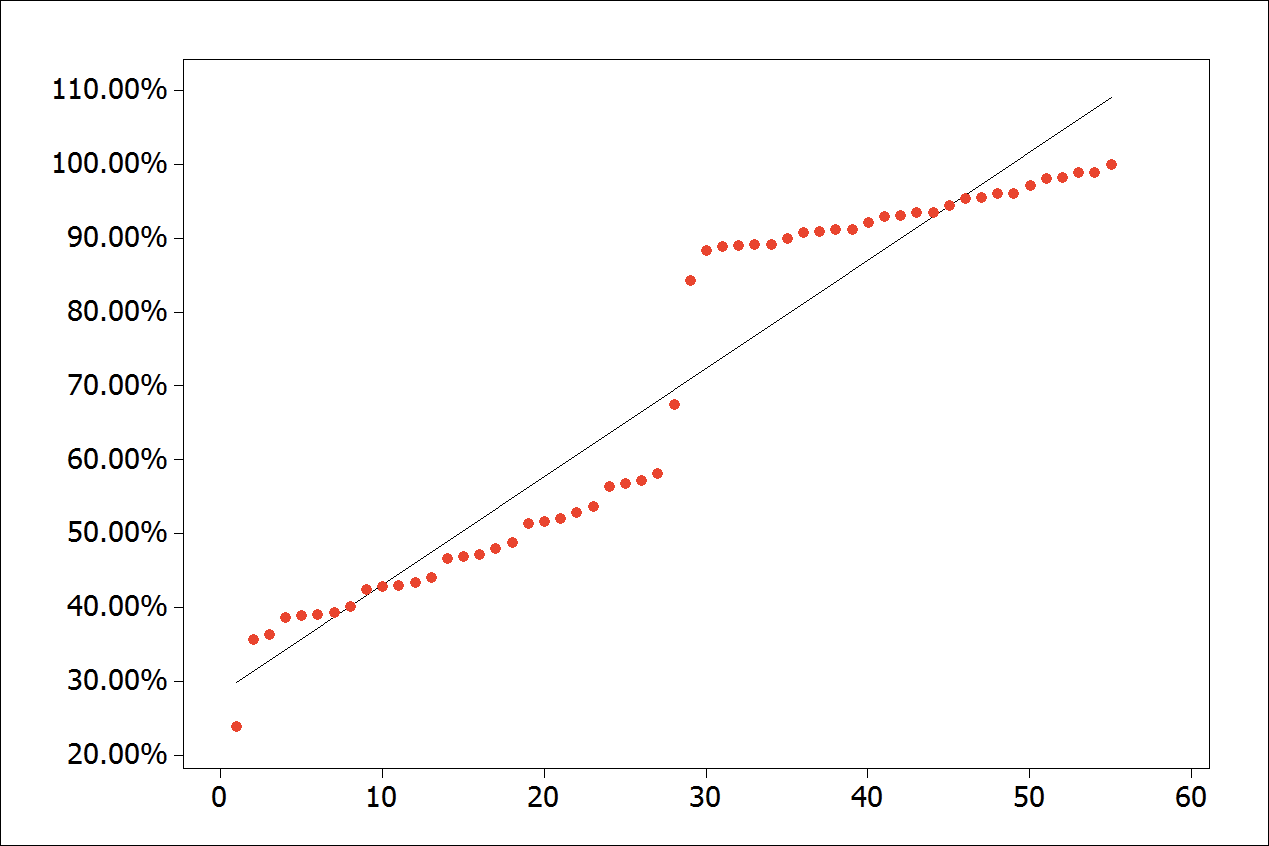
Figure 6.
Scatter plot with all observations.
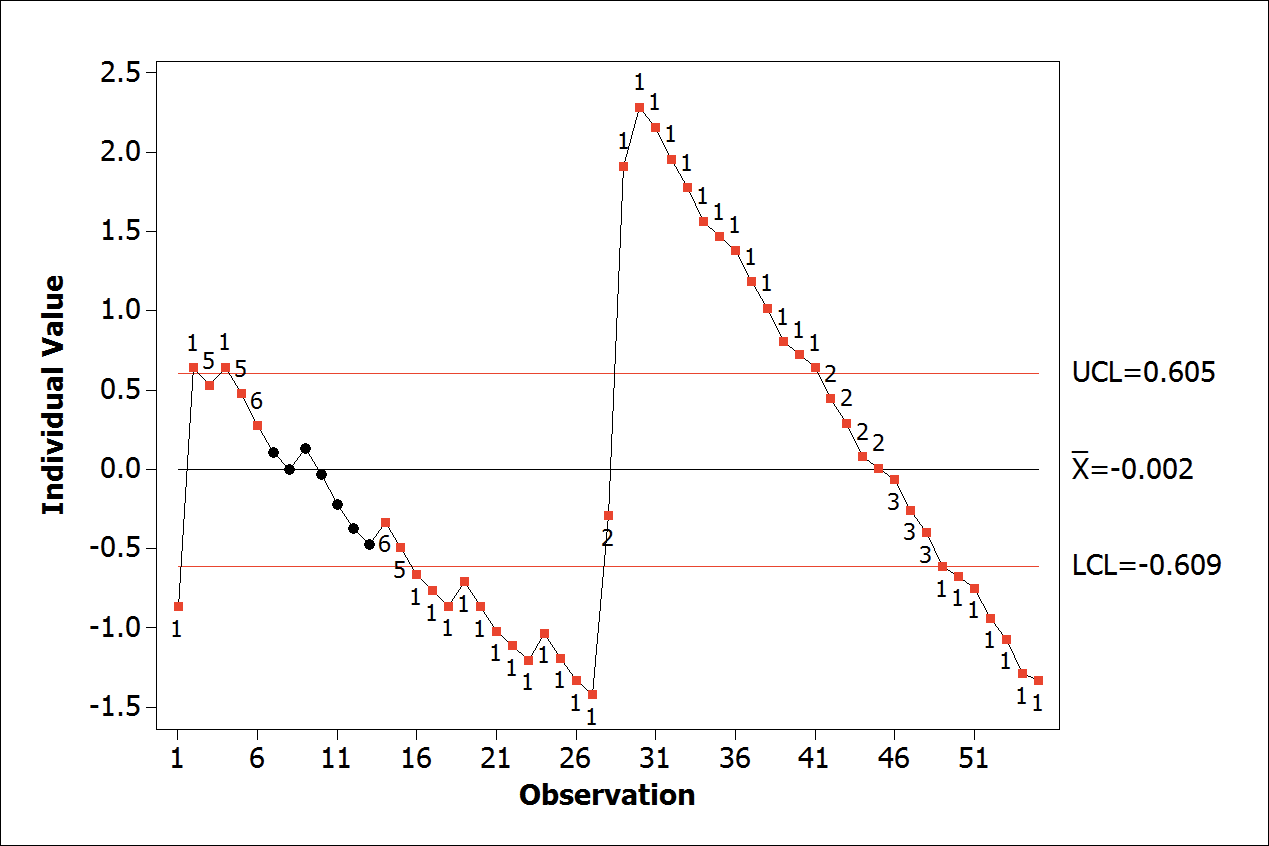
Figure 7.
Individual control chart of residual.
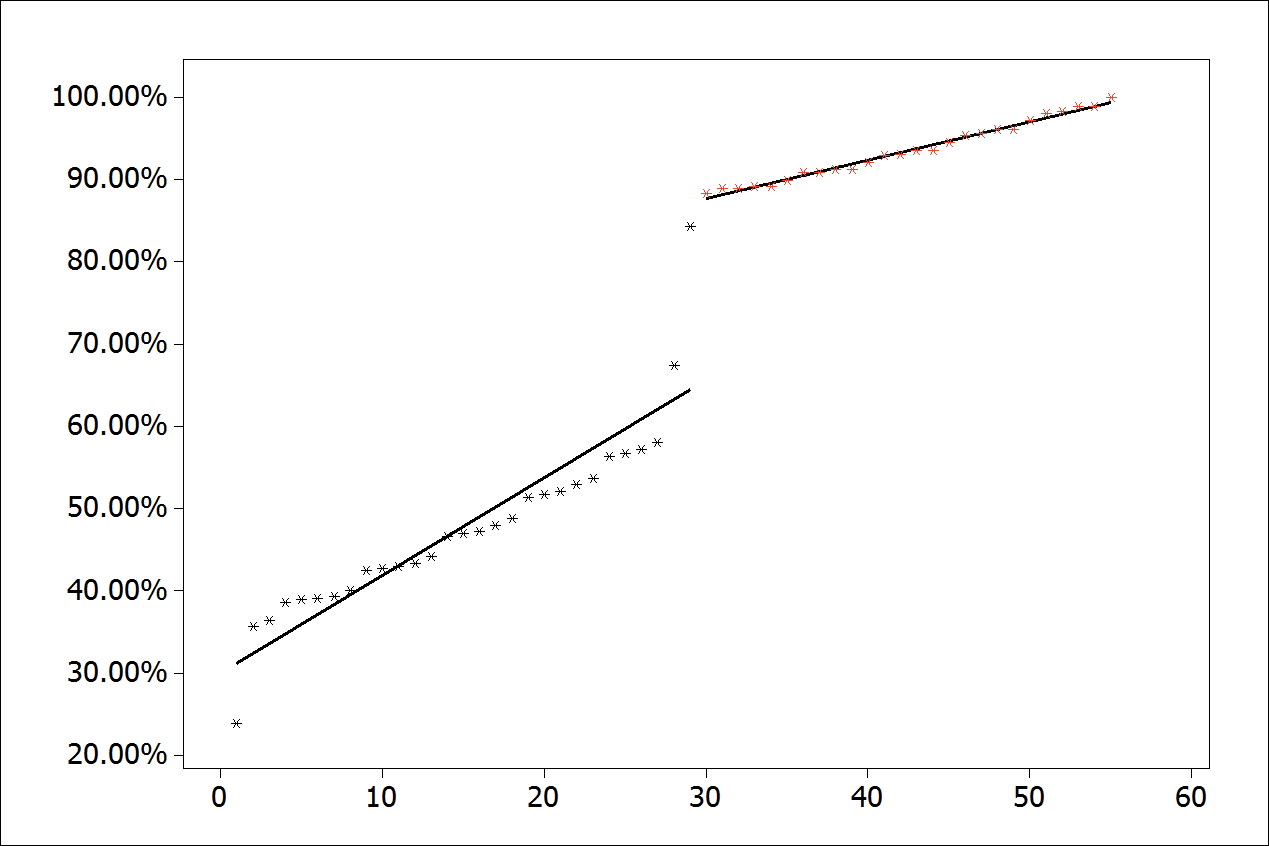
Figure 8.
Scatter plot with an adjusted regression line.
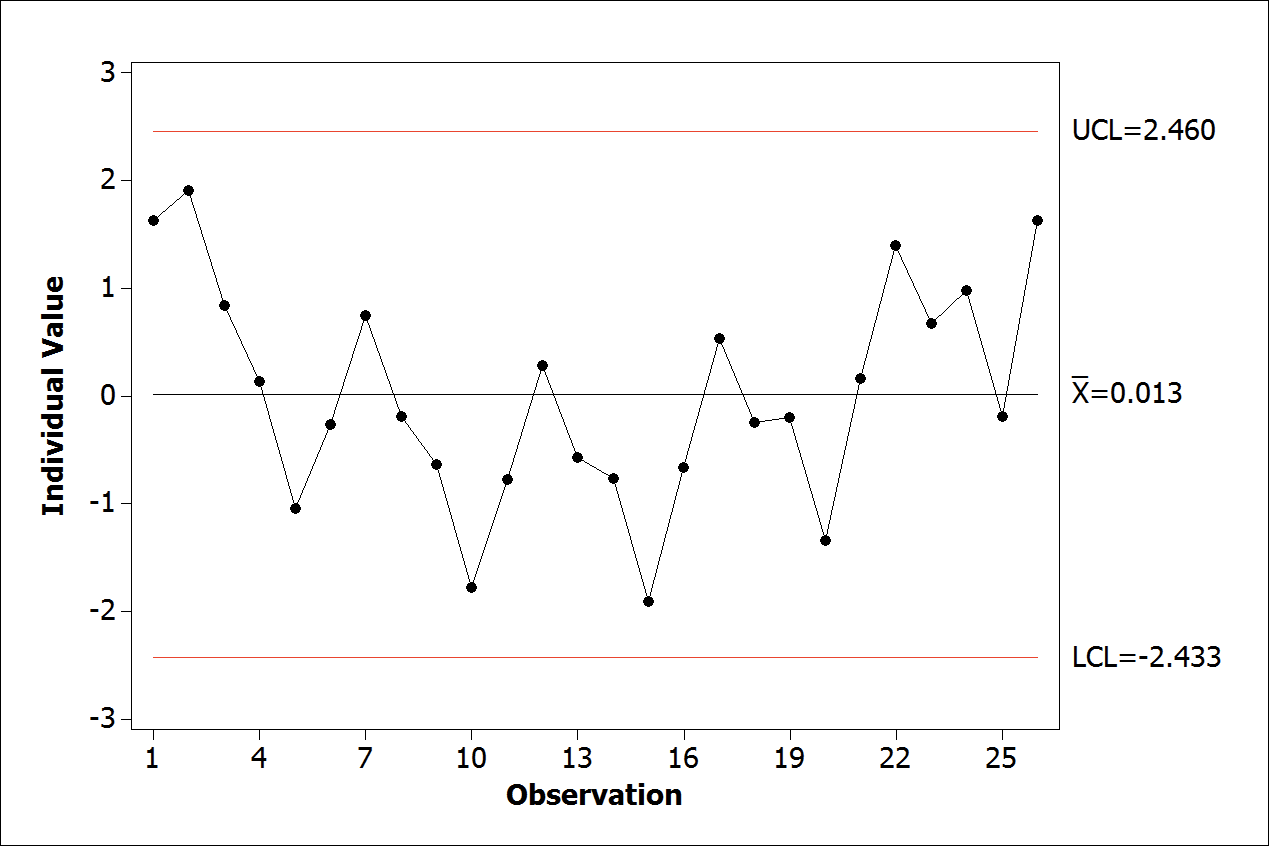
Figure 9.
Individual control chart - residual under control.
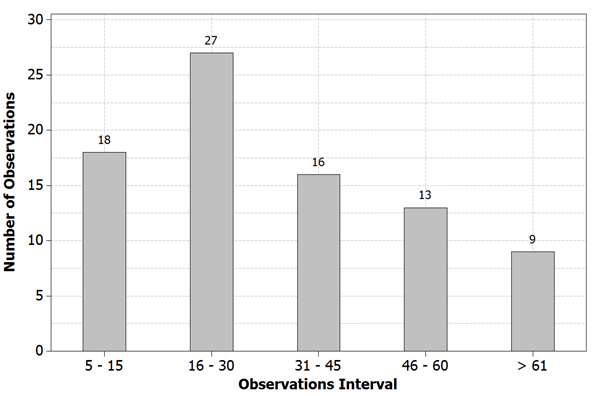
Figure 10.
Series observations distribution.
In this way, the proposed algorithm was executed iteratively in 83 series of the collected data. Note in Figure 11 that in 9 out of the 83 regression models, the obtained residuals were not under control. By analyzing the characteristics of these series, some causes of the problem with residual were identified:
- Abrupt pattern changes at the end of the series: observed when the last recorded data volume is much larger compared to the initial standards. This behavior decreases the model fit accuracy and increases the differences. Such data behavior is illustrated in Figure 12 representing the analyzed backup media. The segmented linear regression was effective for cases of sudden change in the regression line slope.
However, for this application, it is necessary that the change occur in a less advanced stage of the records, as seen in Figure 13.
- Few observations in the series: in some analyses, the few media records (usually less than 10 observations) made it difficult to obtain more adjusted models and without out of control residuals.
Regarding the model fit with the goal of finding the value of X to Y = 1 in 82 out of the 83 models, the set of X values were within the confidence interval (95%). However, in some cases a wider confidence interval was obtained, due to the characteristics of the analyzed series. The model accuracy metrics were also analyzed, the metric values indicate the adjustment of the models. Figure 14 illustrates a comparison of R2 values, adjusted R2 and predicted R2.
Pseudocode
One of the specific objectives of this research is to conceive a pseudocode or generic algorithm to be used in automated backup systems. A similar approach can be found in Le Borgne et al. (2007). Pseudocode can be understood as a generic form of writing an algorithm using a more informal and parsimonious language without the need to know the syntax of any formal programming language (Roy, 2006).
The logical sequence of steps of the Algorithms part 1 to 6 represents the pseudocode and can be implemented in any programming language, to aid any automated backup tool. In order to minimize the amount of code, some of the procedures were encapsulated as functions.
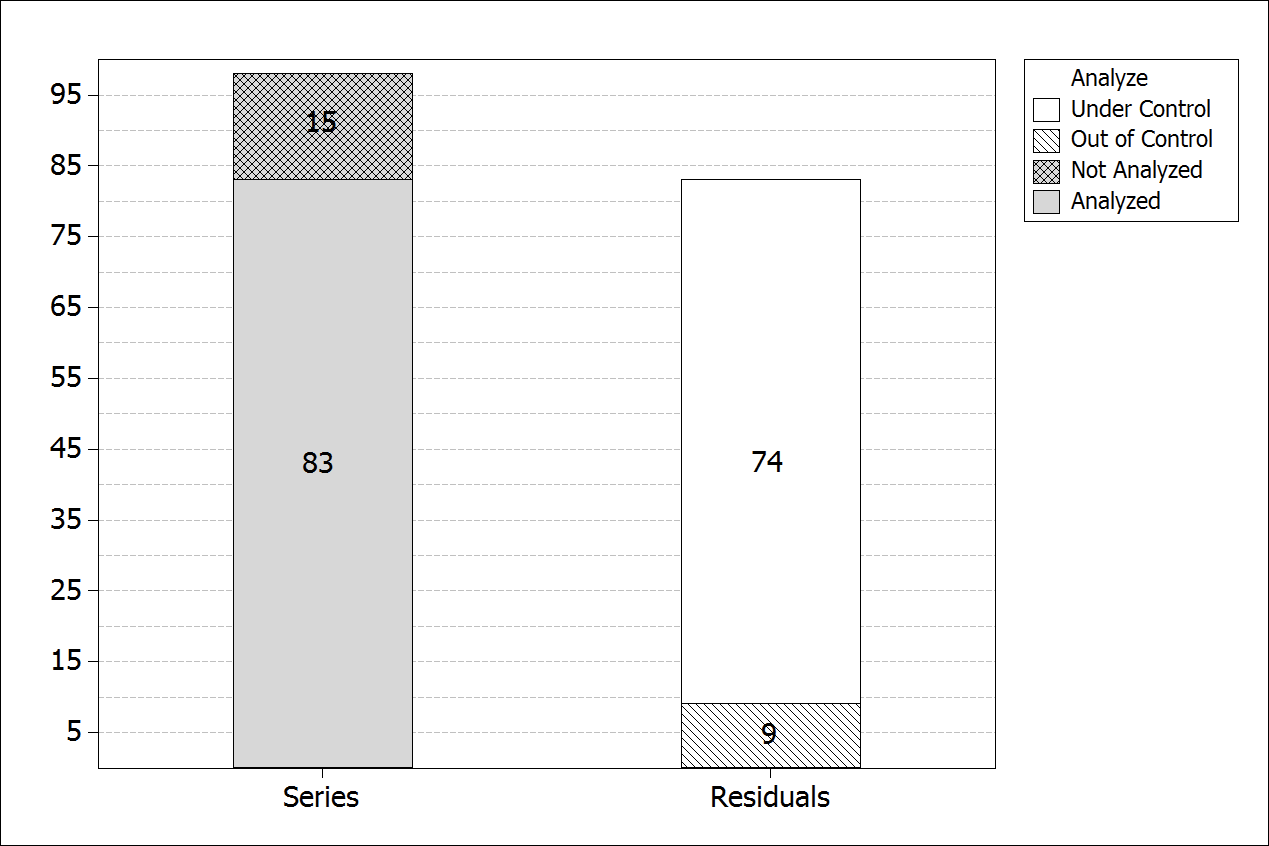
Figure 11.
Summarized chart of analysis
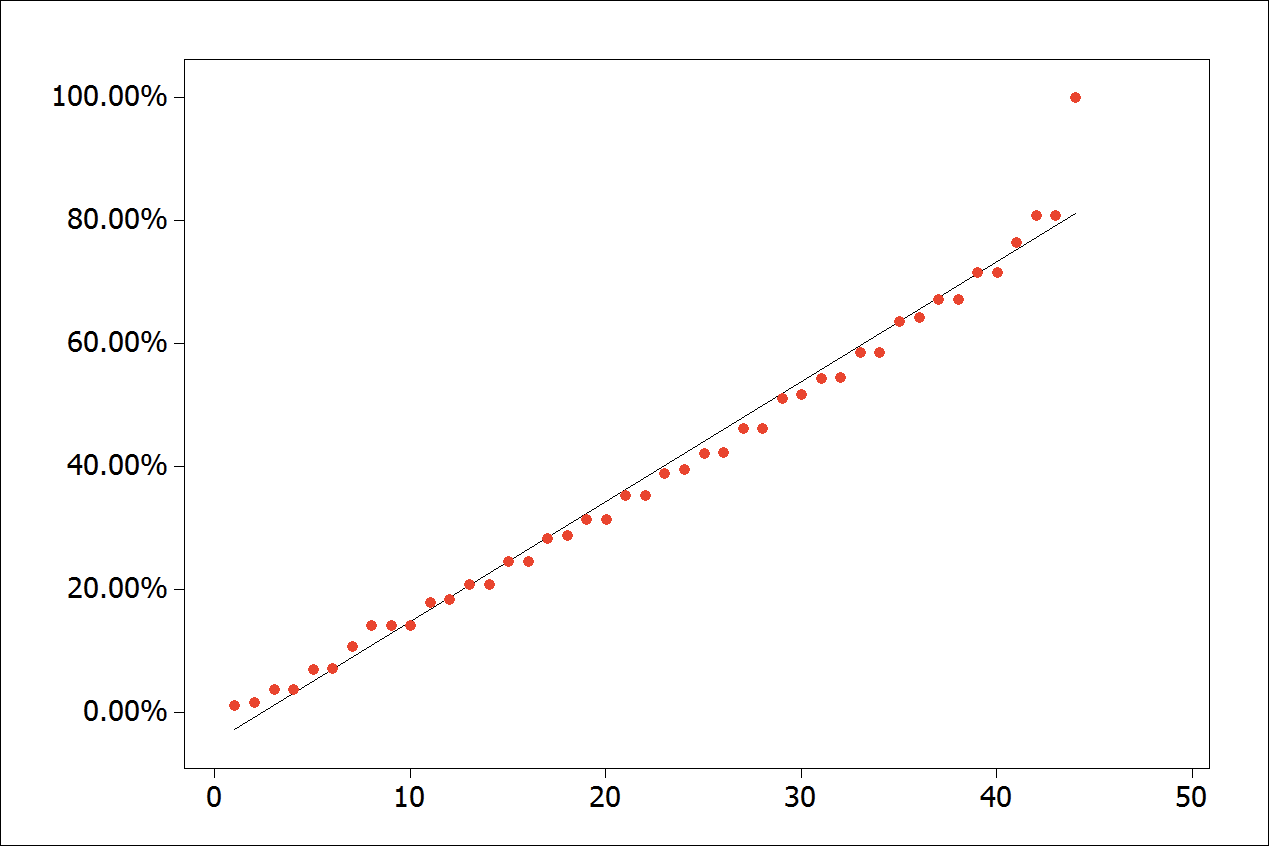
Figure 12.
Abrupt pattern change at the end of the series.
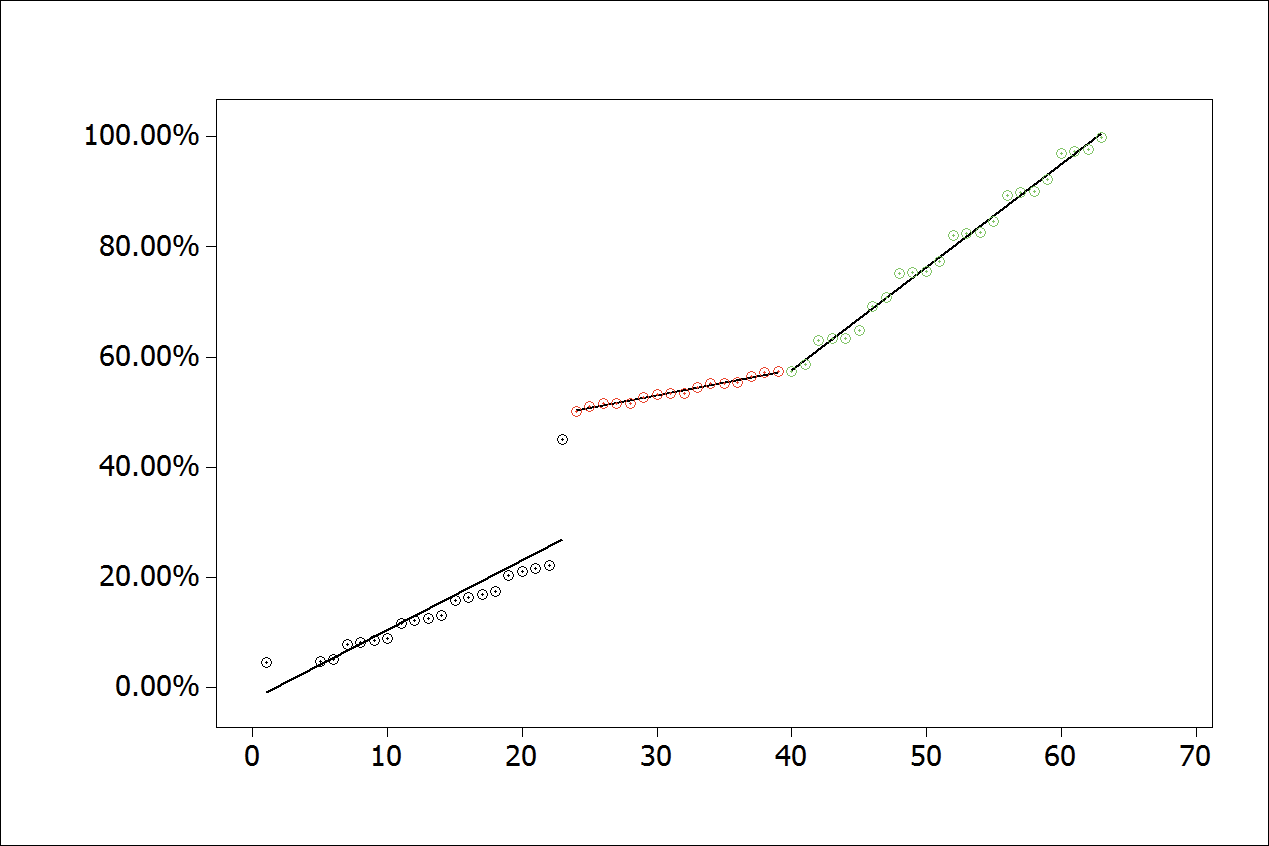
Figure 13.
Adjusted standard changes for segmented linear regression
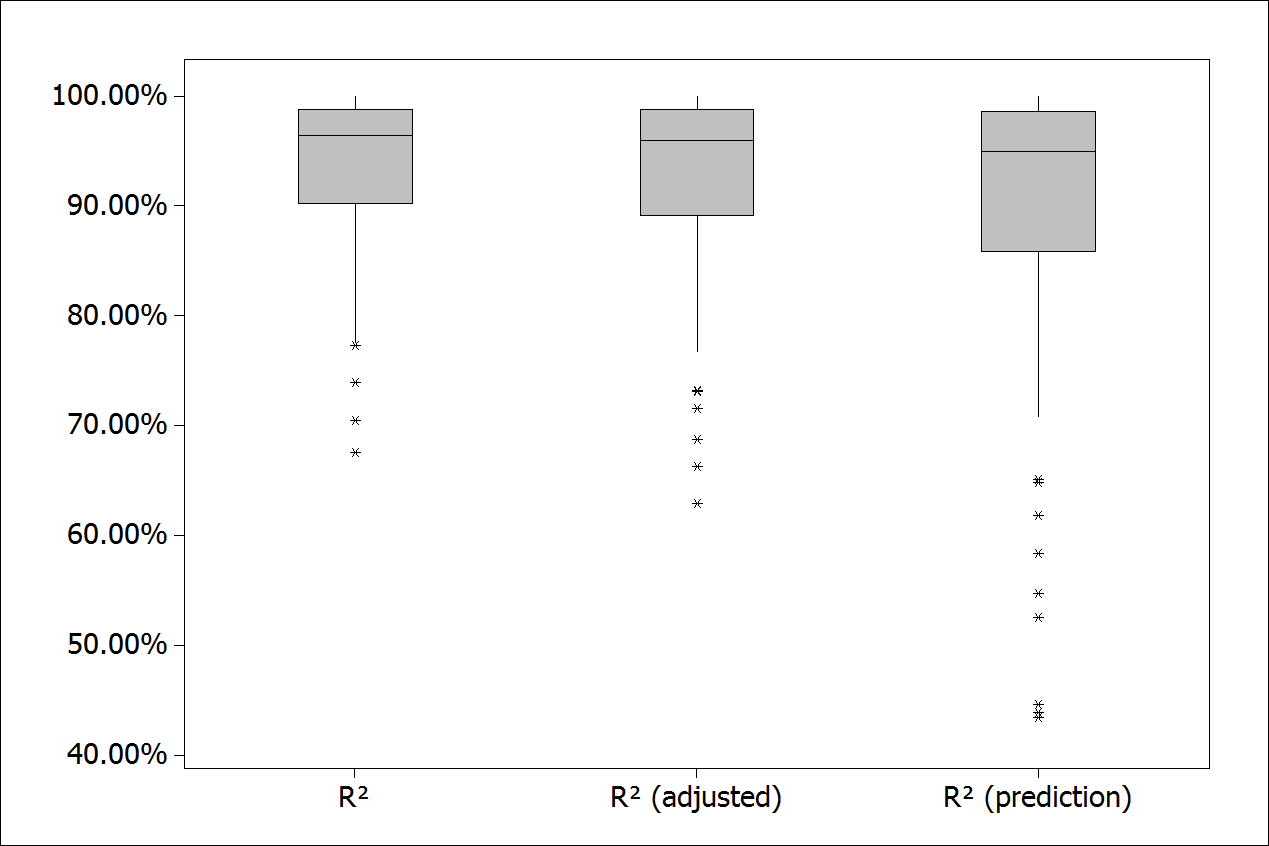
Figure 14.
Models accuracy measures.
Conclusion
With the focus on improving automated processes of a data backup system in operation, quantitative tools applied to quality were used. Based on observations and interpretations of results that encompass the total amount of analyzed series, residual, fit and accuracy measures, it was possible to verify the compliance of the analyzed data with the proposed generic algorithm that implements a logical sequence of steps.
Obtaining short-term forecasting models aims to estimate when each recording media reach its storage capacity limit, thus serving as a tool for decision making and monitoring systems.
The approaches presented herein may be replicated in similar set of data in series to present a positive linear relationship, and wherein a given moment occurs a change of pattern behavior causing changes in the line slope. However, systems that aims to provide full depletion by demands (represented by the dependent variable) can be also adapted to this methodology.
However, it is not the central focus of this research to define an innovative technique of segmented linear regression to search the breaking point. The main objective achieved and justified by both the literature and the results of practical application consists in getting a parsimonious algorithm able to model and forecast demand for a data backup system through analysis from the collected metadata.
Organizations have to adopt additional measures to ensure the availability of systems and applications. A monitoring tool that provides the system administrator with data backup can be considered one of additional parts that are intended to ensure the availability of data backup service.
There are still vast subareas of ICT that can be explored by studies addressing some methodology with both qualitative and quantitative quality-oriented processes. In the quality engineering area, it is possible to apply several tools that contribute to the continuous improvement of various ICT services. Within the context of this research, we suggest the following additional propositions:
- The application of the proposed algorithm to other automated data backup systems and/or different institutions and evaluation of the results.
- Propose a wider forecast horizon of study (medium or long term) focused to help the planning of investments and contracts and not only the operational area.
- Perform predictive analysis with different techniques, whether involving greater complexity in order to check the accuracy of the most parsimonious approach proposed in comparison with new techniques.
- Apply the proposed algorithm to forecast the capacity demand with similar behavior data sets, but from other productive areas, such as: infrastructure, supplies, inventory, among others
Acknowledgements
The authors thanks Capes, CNPq, Fapemig and Federal University of Itajuba Data Center staff for all the support provided to this research.
References
Burgess, M., & Reitan, T. (2007). A risk analysis of disk backup or repository maintenance. Science of Computer Programming, 64(3), 312-331. doi: 10.1016/j.scico.2006.06.003
Chamness, M. (2014). Capacity forecasting for a deduplicating storage system. Recuperado de http://www.freepatentsonline.com/8751463.html
Chatfield, C. (2003). The analysis of time series: An introduction (6th ed.). Boca Raton, FL: Taylor&Francis Group.
Chatterjee, S., & Hadi, A.(2013). Regression analysis by example (5th ed.). Hoboken, NJ: John Wiley & Sons, Inc.
Chen, X. (2016). System vulnerability assessment and critical nodes identification. Expert Systems with Applications, 65, 212-220. doi: 10.1016/j.eswa.2016.08.051
Couto, R. S., Secci, S., Campista, M. E. M., & Costa, L. H. M. K. (2015). Server placement with shared backups for disaster-resilient clouds. Computer Networks, 93(3), 423-434. doi: 10.1016/j.comnet.2015.09.039
Fu, Y.-J., Xiao, N., Liao, X.-K., & Liu, F. (2013). Application-aware client-side data reduction and encryption of personal data in cloud backup services. Journal of Computer Science and Technology, 28(6), 1012-1024. doi: 10.1007/s11390-013-1394-5
Herbst, N. R., Huber, N., Kounev, S., & Amrehn, E. (2012). Self‐adaptive workload classification and forecasting for proactive resource provisioning. International Conference on Performance Engineering, 26(12), 2053-2078. doi: 10.1002/cpe.3224
Jin, R., & Shi, J. (2012). Reconfigured piecewise linear regression tree for multistage manufacturing process control. IIE Transactions, 44(4), 249-261. doi: 10.1080/0740817X.2011.564603
Kwiatkowski, L., & Verhoef, C. (2013). Recovering management information from source code. Science of Computer Programming, 78(9), 1368-1406. doi: 10.1016/j.scico.2012.07.016
Laudon, K. C., & Laudon, J. P. (2012). Management information systems: Managing the digital firm (12th ed.). Upper Saddle River, NJ: Pearson Education, Inc.
Lavazza, L., & Morasca, S. (2011). Convertibility of function points into COSMIC function points: A study using piecewise linear regression. Information and Software Technology, 53(8), 874-884. doi: 10.1016/j.infsof.2011.02.005
Le Borgne, Y.-A., Santini, S., & Bontempi, G. (2007). Adaptive model selection for time series prediction in wireless sensor networks. Signal Processing, 87(12), 3010-3020. doi: 10.1016/j.sigpro.2007.05.015
Lee, S., Cho, C., Hong, E. K., & Yoon, B. (2016). Forecasting mobile broadband traffic: application of scenario analysis and delphi method. Expert Systems with Applications, 44, 126-137. doi: 10.1016/j.eswa.2015.09.030
Lucio-Nieto, T., Colomo-Palacios, R., Soto-Acosta, P., Popa, S., & Amescua-Seco, A. (2012). Implementing an it service information management framework: the case of cotemar. International Journal of Information Management, 32(6), 589-594. doi: 10.1016/j.ijinfomgt.2012.08.004
Mahmoud, M. A., Parker, P. A., Woodall, W. H., & Hawkins, D. M. (2007). A change point method for linear profile data. Quality and Reliability Engineering International, 23(2), 247-268. doi: 10.1002/qre.788
Malash, G. F., & El-Khaiary, M. I. (2010). Piecewise linear regression: a statistical method for the analysis of experimental adsorption data by the intraparticle-diffusion models. Chemical Engineering Journal, 163(3), 256-263. doi: 10.1016/j.cej.2010.07.059
Montgomery, D., Jennings, C., & Kulahci, M. (2011). Introduction to time series analysis and forecasting. Hoboken, NJ: Wiley.
Muggeo, V. M. R. (2003). Estimating regression models with unknown breakpoints. Statistics in Medicine, 22(19), 3055-3071. doi: 10.1002/sim.1545
Muthukumar, M., & Ravichandran, T. (2012). Optimizing and enhancing parallel multi storage backup compression for real-time database systems. International Journal of Computer Technology & Applications, 3(4), 1406-1417.
Nisbet, R., Miner, G., & Elder, J. (2009). Handbook of statistical analysis and data mining applications. elsevier science. Burlington, MA: Elsevier.
Ntalampiras, S. (2016). Automatic identification of integrity attacks in cyberphysical systems. Expert Systems with Applications, 58, 164-173. doi: 10.1016/j.eswa.2016.04.006
Owens, I., Wilson, T., & Abell, A. (2019). Information and business performance: a study of information systems and services in high-performing companies. Sheffield, UK: University of Sheffield.
Pamies-Juarez, L., Datta, A., & Oggier, F. (2013). In-network redundancy generation for opportunistic speedup of data backup. Future Generation Computer Systems, 29(6), 1353-1362. doi: 10.1016/j.future.2013.02.009
Roy, G. (2006). Designing and explaining programs with a literate pseudocode. Journal on Educational Resources in Computing, 6(1), 1-18. doi: 10.1145/1217862.1217863
Samagaio, A., & Wolters, M. (2010). Comparative analysis of government forecasts for the lisbon airport. Journal of Air Transport Management, 16(4), 213-217. doi: 10.1016/j.jairtraman.2009.09.002
Saxena, A., Claeys, D., Bruneel, H., & Walraevens, J. (2019). Analysis of the age of data in data backup systems. Computer Networks, 160, 41-50. doi: 10.1016/j.comnet.2019.05.020.
Sengupta, S., & Annervaz, K. M. (2014). Multi-site data distribution for disaster recovery - a planning framework. Future Generation Computer Systems, 41, 53-64. doi: 10.1016/j.future.2014.07.007
Shao, Q., Li, Z., & Xu, Z. (2009). Trend detection in hydrological time series by segment regression with application to shiyang river basin. Stochastic Environmental Research and Risk Assessment, 24(2), 221-233. doi: 10.1007/s00477-009-0312-4
Tallon, P. P. (2013). Corporate governance of big data: perspectives on value, risk, and cost. Computer, 46(6), 32-38. doi: 10.1109/MC.2013.155
Wolff, J. G. (2007). Towards an intelligent database system founded on the SP theory of computing and cognition. Data & Knowledge Engineering, 60(3), 596-624. doi: 10.1016/j.datak.2006.04.003
Xia, R., Yin, X., Lopez, J. A., Machida, F., & Trivedi, K. S. (2014). Performance and availability modeling of ITsystems with data backup and restore. IEEE Transactions on Dependable and Secure Computing, 11(4), 375-389. doi: 10.1109/TDSC.2013.50
Notas de autor
lduarte@unifei.edu.br