Architecture and Urbanism

Esta obra está bajo una Licencia Creative Commons Atribución 4.0 Internacional.
Recepción: 04 Febrero 2019
Aprobación: 13 Septiembre 2019
DOI: https://doi.org/10.4025/actascitechnol.v42i1.46270
Abstract: Cities keep growing, and in most of the cases this expansion process is hard to model and describe for planning actions. Quantitative methods are increasingly used to help planning, monitoring, and regulating urban land-use processes. Remote sensing images series are making possible different types of spatial-temporal analysis of the Earth surface. Surface albedo is a remote sensing product acquired in a long series of satellite images suc h as Landsat (more than 40 years of observation). Those analyses allow measuring waterproofed areas for urban drainage studies, as well as monitoring urban spreading patterns, growth vectors, and issues related to comfort and environmental quality, as well as about land use and land-use planning (directives for master plans) among others. This article shows the direct applicability of surface albedo changes as an indicator of urban land-cover changes. The current study analyzed the urban area of Petrolina County (PE) in the following periods: 2001 and 2006, 2006 and 2011, and 2011 and 2017. Such analysis uses the surface albedo variation along the time and results showed a strong correlation between increased surface albedo and urban expansion. Besides, it enabled to observe the relation between the high urban growth in the 2011-2017 period and the urban spot expansion by 14% (approximately 590 thousand square meters of territorial extension). The Urban development stood out in the Northern and Southwestern regions of Petrolina County.
Keywords: urban expansion, remote sensing, urban planning.
Introduction
Urban growth is the primary driver of land cover changes (Mcgarigal et al., 2017). Thus, the space-time analysis applied to urban expansion is essential and necessary to plan urban infrastructures and land-use policies (Shafizadeh-Moghadam, Asghari, Tayyebi, & Taleai, 2017), as well as to identify critical points affecting urban areas such as heat islands increasingly found in urban spaces. Many aspects of recent land-use changes in urban areas have overwhelmed the government's capacity to manage them. Disaster impacts show that a high proportion of the world’s population most affected by extreme weather events is concentrated in urban centres (United Nations International Strategy for Disaster Reduction [UNISDR], 2013). In Brazil, studies by the Intergovernmental Panel on Climate Change indicate that Climate changes impact a large part of the Brazilian population on its health, water resources, infrastructures, coastal zones, forests, and biodiversity, as well as the economic sectors. These changes impose great challenges and opportunities for better planning, especially for urban areas where most of the population lives (Intergovernmental Panel on Climate Change [IPCC], 2014).
Petrolina County has been facing significant demographic growth in the last 50 years. This city, located in the Sertão do São Francisco, Pernambuco State, Brazil concentrates the economic activities developed in the region. It presents rapid and continuous population growth: 379.92% from 1970 to 2010 and 34.51% from 2000 to 2010. These population growth rates were higher than the average recorded for the region and significantly higher than the average of Pernambuco State (Instituto de Pesquisa Econômica Aplicada [IPEA], 2018a).
The rapidly growing population in urban areas generate the most diverse social issues for decision makers (Son, Chen, Chen, Chang, & Thanh, 2012). Petrolina County became a development pole since it receives immigrants from Pernambuco and neighbouring states. Despite the socio-economic benefits, such development also affects the environment, as well as urban and peri-urban infrastructure (Son et al., 2012).
Nowadays, studies about new approaches to planning and managing urban regions has significant importance and applicability since it investigates the causes, chronology and impacts from urbanization processes (Klostermann, 1999; Longley & Mesev, 2000). These new approaches help better understanding and analyzing of the urban dynamics through the simulation of future scenarios, as well as to support decision makers involved in urban planning and management policies. Efficient urban planning requires knowledge about the type, extent and nature of these occupations for a clear understanding of the current problems caused by urbanization processes and to allow the prediction of future problems.
Temporal remote sensing data enables the acquiring and monitoring of spatial growth of urban land-use/occupation patterns and processes. However, remote sensing provides more than just land-use data. Changes in land-cover types affect sensible and latent heat fluxes. Wet and vegetated land surfaces, for instance, may favour the absorption of the solar radiant flux and, consequently, reduce sensible heat and temperature. Natural and/or anthropic changes capable of affecting the amount of vegetation and wetlands enable climate changes at varying spatial and temporal scales (Weng, 2001; Chudnovsky, Ben-Dor, & Saaroni, 2004).
The use of satellite-based remote sensing in land surface mapping processes allows monitoring land dynamics and changes in urban extensions in a timely and cost-effective manner since it covers large areas at high spatial resolution. Thus, it enables a better surface detailing and temporal resolution at high frequency (periodicity), besides the analysis applied to the space-time behaviour of the land surface. Therefore, studies focused on urban mapping and urban growth monitoring based on Landsat images have raised increasing interest worldwide (Setiawan, Mathieu, &Thompson-Fawcett, 2006; Buyantuyev, Wu, & Gries, 2007).
Among the different methods used to quantify urban growth, products deriving from surface albedo variations were analyzed to quantify and map urban areas (Son et al., 2012; Guo, Huang, Li, Sun, & Zhang, 2013; Zhai, Liu, Liu, Huang, & Qin, 2015; Du, Xia, & Feng, 2015; Tang et al., 2018; Kant, Azim, & Mitra, 2018). Albedo is the ratio between reflected and incident solar radiation fluxes (Allen, Trezza, & Tasumi, 2002; Silva, Lopes, & Azevedo, 2005) since it is a biophysical parameter in which changes in land cover directly affect its spectral response.
The current study aimed to quantify the urban expansion and to analyze the urbanization process in Petrolina County, based on surface albedo variations captured in Landsat images. It was done to find the urban growth rate of the county, and its consequent waterproofing, to support the urban planning and the decision-making process in public policies focused on urban expansion and densification.
Material and methods
Regarding Petrolina
Brazil
Petrolina is a city which is located in the far South-West of Pernambuco State, at latitude 09º 23’ 55” S and longitude 40º 30’ 03” W. It is the most populated county in the Sertão de São Francisco Development Region (Figure 1). Its total population comprises 293,762 inhabitants (Instituto Brasileiro de Geografia e Estatística [IBGE], 2010), which corresponds to 42.8% of the total population living in the whole region. Also, its territorial size and economic strength turn the county into the most important one in that area.
Petrolina presents a total area of 4,558 km2, which corresponds to 4.64% of Pernambuco State, as well as the population density records of 64.49 inhabitants km-2.
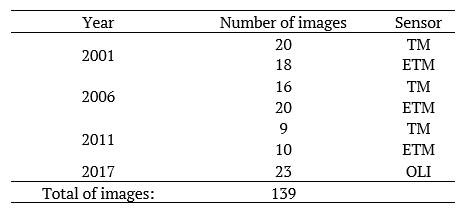
The Landsat Satellite Surface Reflectance (SR) images were atmospherically corrected through the Landsat Ecosystem Disturbance Adaptive Processing System (LEDAPS) (Vermote, El Saleous, Justice, Kaufman, & Privette, 1997; Masek et al., 2006) algorithm. Thus, this research uses SR images of TM, ETM +, and OLI sensors from Landsat satellites 5, 7, and 8, respectively, between 2001 and 2006, 2006 and 2011, and between 2011 and 2017. The US Geological Survey provided the images. Table 1 describes the total number of images used in the current study and the scenes corresponding to the path/row 216/66. The analyzed period always presented two active satellites.
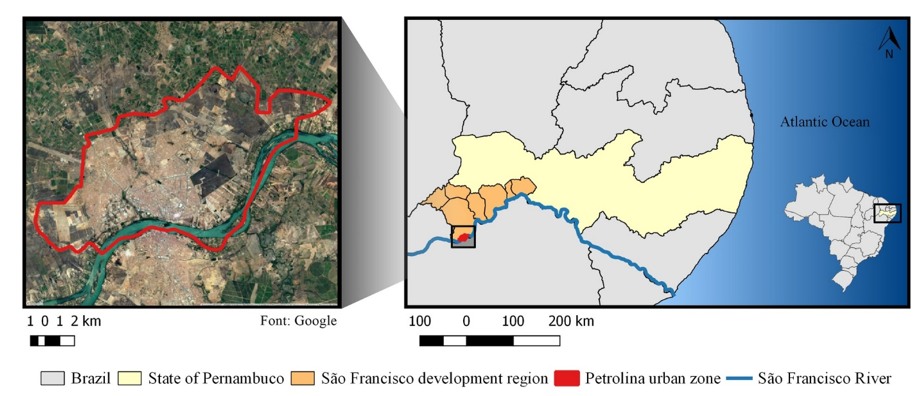
Figure 1.
Study site location.
Regarding data
The Institute for Applied Economic Research (Ipea) provides the ‘Ipeadata platform’, which is a demographic, economic and geographic database about Brazilian regions, states and counties analyzed in the 1872 Demographic Census. The database of this Institute provides macroeconomic, regional and social indicators, besides economic, financial, demographic, income, education, health, housing, work-related data, among others. Subsequently, this study uses the population data from Ipea, for the same remote sensing scenes period (IPEA, 2018b).
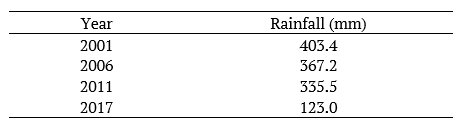
The Semiarid region demands a cross-related analysis of vegetation cover and precipitation in a remote sensing approach. The reflectance answers from satellite sensors usually change according to the rainfall in the Caatinga biome, even in an urban area as Petrolina (Cunha, Taveira, Rufino, & Alcântara, 2014). Thus, this research used precipitation data measured by Bebedouro Weather Station in Petrolina County. These data were available at the website of the Brazilian Agricultural Research Company (Embrapa - Empresa Brasileira de Pesquisa Agropecuária). The selection includes the accumulated annual precipitation data about each herein analyzed year.
Surface Albedo in urban studies
Surface albedo is a handy parameter to analyze urban surface changes. Pathirana, Denekew, Veerbeek, Zevenbergen, and Banda (2013) show a methodology for creating present and future urban scenarios by changing only their vegetation fraction and albedo values. Those authors decreased albedo by 20 and vegetation fraction by 75% of the average background values to indicate the transition from non-urban to urban land use (Pathirana et al., 2013). For rapid urbanization, as it can be observed in some Chinese cities, Hou, Hu, and He (2014) argue that dramatic urbanization always results in rapid changes to land surface properties, such as vegetation cover, albedo, and land surface temperature. Jandaghian and Akbari (2018) analyze the effect of increasing surface albedo on urban climate and air quality for three cities (Sacramento, Houston, and Chicago). The surface albedo is also very useful in Urban Heat Islands (UHI) studies (Hou et al., 2014; Fu & Weng, 2018; Jandaghian & Akbari, 2018).
In general, the process of transition from a village to a city involves replacing natural surfaces (e.g., farmlands and forests) with impervious surfaces (e.g., cement and asphalt). Urban growing causes changes in land surface characteristics converting the natural land surface into artificial urban structures and changing its physical, chemistry and thermal aspects (Kant et al., 2018). The thermal conductivity of the Earth’s surface changes, the albedo changes, and the water and heat exchange between the Earth’s surface and the atmosphere also change (Tang et al., 2018). In this sense, the present study suggests the use of surface albedo as an excellent remote sensing indicator of the urban expansion and changes on the urban land cover based on its variations for different time intervals. The surface albedo changes can support decision making in urban planning, once it can provide trends of occupation along the time (long time series from Landsat images). Those trends projected in future scenarios can offer tools for zoning restrictions or occupation permits. In an Urban surface, there are different albedo values for different materials (Goodman, 1999). Low albedo values result from the higher power of these surfaces to absorb solar radiation - as in the case of paved streets with asphalt. In those cases, there are not enough latent heat flux exchanges to decrease temperature values. Also, the lack of vegetation modifies energy flow partition on the urban surfaces, reducing latent heat flux and, consequently, increases sensible heat flux (Imhoff, Zhang, Wolfe, & Bounoua, 2010; Hu & Jia, 2010).
Data processing
All Sattelite images (Table 1) were processed in the R™ free software (R Core Team, 2018) through the Rstudio interface. The annual rainfall was the criterion used to select the time intervals; then, the similarity of rainfall values defined the selected years. For annual rainfall values lower than 405 mm, the years were classified as ‘dry years’ (Table 2). The lowest accumulated rainfall value (123 mm) happened in 2017. In dry years, with low rainfall variability, there is no much interference of the precipitation in the final albedo values. In dry years, with low rainfall variability, there is no much interference of the precipitation in the final albedo values. The methodology comprises four processing stages: (i) Finding the surface albedo for all available images; (ii) Stacking all images concerning the same year to generate the image referring to the maximum annual surface albedo value; (iii) Calculating the albedo variation between two years (2001 and 2006, 2006 and 2011, 2011 and 2017); (iv) Final map identifying the urban growth and its characteristics per period.
Landsat images used in the study.
Annual rainfall in Petrolina (Source: Embrapa).
Surface Albedo estimate based on remote sensing
The Landsat SR (Surface Reflectance) product is available by USGS/Nasa with atmospheric correction included. It enables finding αSR (Surface Albedo) through Equation 1. Previous studies ( Shuai, Masek, Gao, Schaaf, & He, 2014; Wang, Berardi, & Akbari, 2016) presented the parameters used to find αSR through OLI-Landsat SR and TM/ETM + Landsat SR images, respectively, as described in Table 3.

where: p is the surface reflectance, and b is the conversion coefficient for six non-thermal Landsat bands, i.e. Blue, Green, Red, Near-Infrared (NIR), and two Shortwave Infrared (SWIR1 and SWIR2).
Based on the image depicting the maximum annual albedo values, the albedo difference between the studied years was calculated through a simple map algebra, according to Equation 2.

A new image was generated based on the albedo variation; positive albedo values represented constructed areas or areas that underwent urban growth/densification, verticalization and changes in surface materials, among others. Samples chose a threshold Δalbedo value. Surface albedo variations that could indicate urban growth or densification (equivalent to high Δalbedo values) and noises (equivalent to very low Δalbedo values). These threshold values are usually found in areas showing recent urban occupation with albedo variation in a time series than areas previously unoccupied or covered with vegetation. The generation of urban growth/densification maps allowed quantitatively extracting the areas that suffered substantial albedo variations in order to estimate the urban growth/densification rate for each period. The herein adopted Δalbedo threshold was 0.15. Thus, the difference in albedo values lower than 0.15 between two years was not considered an area subjected to occupation or densification changes
Coefficients used to calculate the surface Albedo.
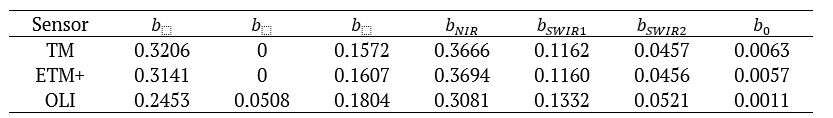
Figure 2 shows the surface albedo variation (change) for the selected years. Albedo changes can be interpreted as a natural land cover removal (usually vegetated areas), and in the following time interval, a new change can be new building areas. In this sense, the urban growth/densification map per period is mapped by the albedo variations map.
According to the map (Figure 2), Petrolina had a substantial urban expansion between 2011 and 2017, in comparison to the previous periods. There was significant urban growth/densification in the Northern and Southwestern regions of the county, as well as moderate growth/densification throughout its territorial extension.
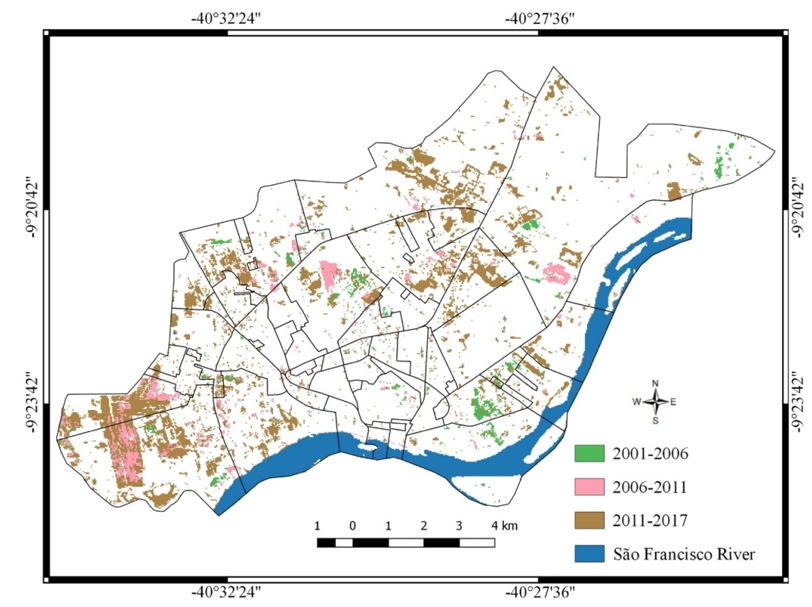
Figure 2.
Urban growth (Δalbedo ) according to Landsat images which were colour-coded based on the changing period: 2001-2016 (green), 2006-2011 (pink) and 2011-2017 (blue).
Table 4 shows the population data and the urban growth rate related to the surface albedo change. The period between 2011 and 2017 was the one presenting the highest urban growth rate (approximately 14%), which was equivalent to an area of approximately 590 thousand square meters (if one takes into consideration the pixel-area calculation based on albedo gain values). In other words, the period recording the highest albedo gain (Δalbedo) necessarily coincides with the period recording the highest population growth rate.
Table 4 shows that urban growth (built area) is higher than population growth for the interval 2011 to 2017. This difference may be related to the economic development of the region, with growth in commercial activity. The increase in economic activity in the region has contributed to the expansion of local commerce, improved urban mobility with increased paved areas, construction of public facilities, construction of huge malls (Araújo & Silva, 2013). Besides, there is an attraction driver in the vicinity of the São Francisco river. It is a beautiful landscape area, and there is a lot of residential condominiums and new standard tall buildings close to that area.
Urban growth rate, albedo gain and population growth variation in Petrolina County.
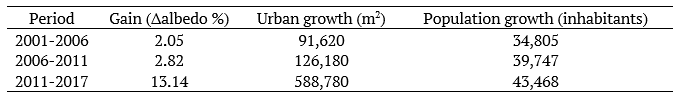
Figure 3 shows the spatial and temporal distribution of the surface albedo in the studied years. Such distribution allows a better analysis of the albedo behaviour, which showed a significant increase throughout the studied years. This result allows stating that there is a positive correlation between increased surface albedo and built and/or densified areas. High albedo values stood out in areas close to the São Francisco River (Southwestern Petrolina). These areas presented a high urbanization level during the studied period becoming a consolidated urban area since those years.
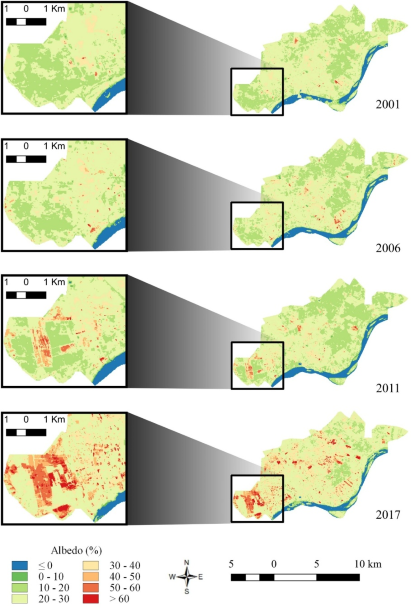
Figure 3.
Spatial and temporal distribution of the surface albedo over the changing periods.
Figure 4 shows the frequency of albedo classes in the studied periods. The years 2001 and 2006 recorded very close frequencies of albedo classes. The albedo class 10-20 (%) increased in 2011 in comparison to the other years, the fact that may be related to greater soil exposure and waterproofing. Most residential lots recorded shallow albedo surface values. It mostly happened due to high concrete or asphalt paving rates verified in open areas (Giridharan, Ganesan, & Lau, 2004). The trend in urban environments has been changing in recent times: the outer surface is usually paved with cement bricks or tiles. These materials have a relatively higher albedo than concrete and asphalt surfaces (Giridharan et al., 2004). Based on changes in these constructive typologies and on population increase, the year 2017 recorded 30-40%, 40-50% and 50-60% increase in albedo classes. In this year, there are the highest albedo variations (Δalbedo). The highest albedo values were associated with the type and colour of the material used in constructions in an urban site. Figure 4 presents the statistical analysis applied to the frequency of albedo variations throughout the studied periods.
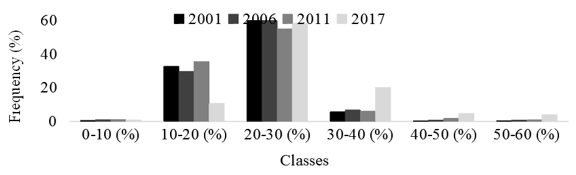
Figure 4.
Frequency of surface albedo classes for the years of the current study.
Figure 5 shows two Google Earth images of Petrolina, in 2001 (a) and 2016 (b). The image representing 2016 is the most recent one (available by Google Earth). The highlighted red polygons in Figure 6 are areas that have the most significant land-cover changes due to the urbanization process. Based on the comparison between Figure 3 (space-time distribution of the albedo) and Figure 4, areas with significant urbanization also have higher albedo variations.
As shown in Figure 5, it is possible to observe in the first years of this research, the Southwest area presented a high vegetation cover, and it was almost all removed during the time monitored by remote sensing images. Removal of vegetated areas by buildings or bare surface areas contributes to change surface albedo values. The areas that have loss vegetation will experience a reduction of the water storage capacity in the soil, lack of percolation of the water in the soil, increase of soil compaction and increase of the direct radiation in the soil. Besides, the built-up areas, especially those with concrete (material), will have reflectivity increasing. This new dynamics will increase surface albedo changes along the years.
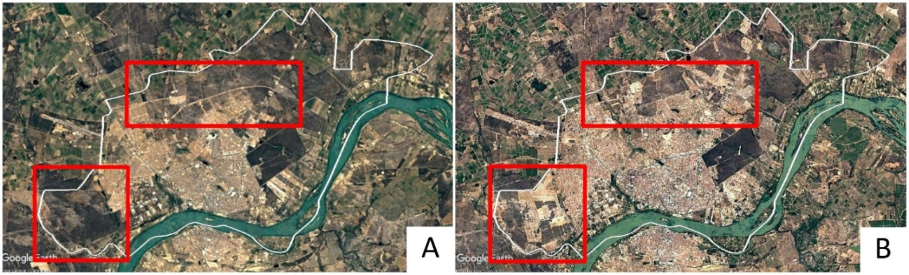
Figure 5.
The urban perimeter of Petrolina County in 2001 (a) and in 2016 (b). Source: Google Earth.
Figure 6 and 7 show population data for 2000 and 2010 Censuses (IBGE). This research used census data available for the last two decades (2000-2010). There is no census data for the last years, and the images showed a significant increase of albedo changes in the last period (2011 to 2017). The analysis of this spatial variability of albedo may infer population dynamics during the last years of this study. In 2000, the population was more concentrated in the central region of Petrolina, and then in 2010, there is a rapid increase in household density in that central area. The high-density areas in 2010 that were not present in the year 2000 are the ones that presented the most significant changes in land cover and resulted in more considerable albedo differences compared to previously studied periods.
The spatialization of population density data allows seeing agglomeration and urban densification trends in some regions of the county. The comparison between these data and Figure 3 (Δalbedo) showed a large area of the county occupied after the last census (IBGE, 2010). Unfortunately, this urban growth will be quantified by census again only in 2020 (next census). The surface albedo time series - analyzed through a coefficient of variation (Δalbedo) – allows performing a continuous analysis to monitor county expansion and to subsidize planning strategies even in a lack of other available data.
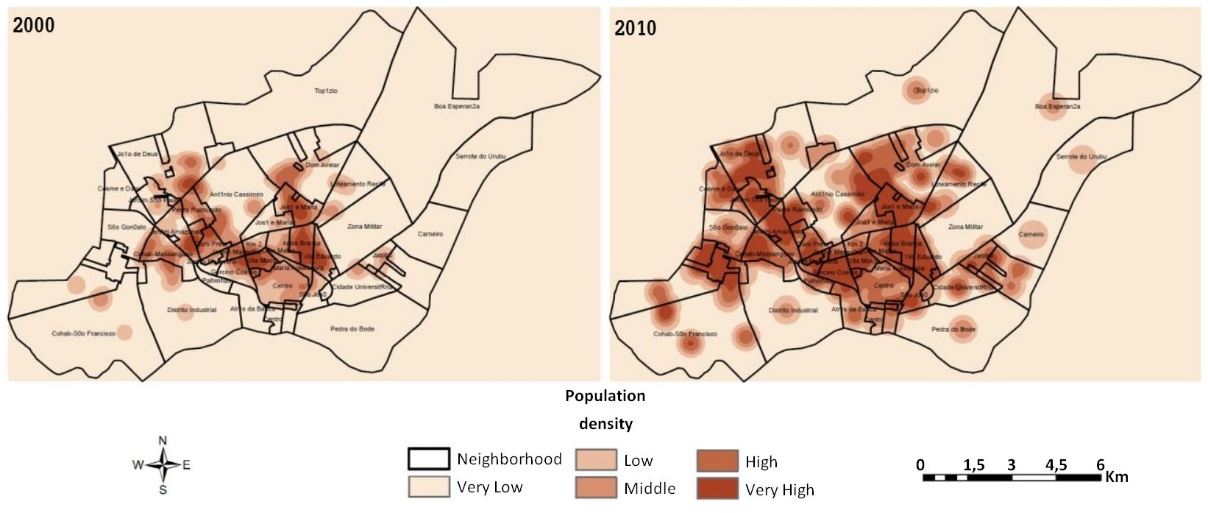
Figure 6.
Density of the population living in Petrolina County (PB) neighbourhoods based on Census surveys conducted in 2000 and in 2010. Source: 2000 and 2010 IBGE Censuses and Rufino, Gusmão, Melo Filho, and Santos (2018).
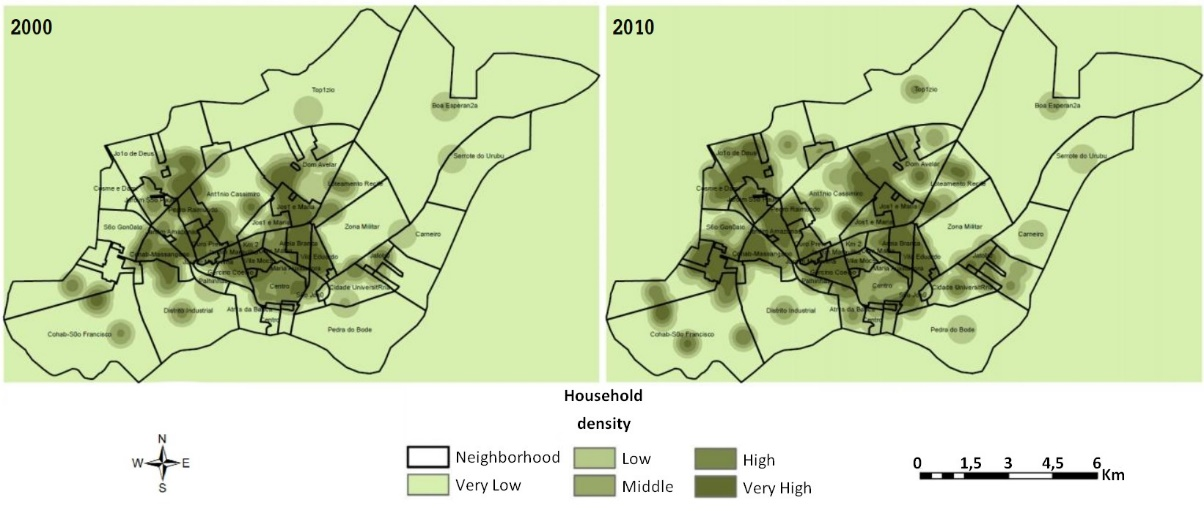
Figure 7.
Household density in Petrolina County (PB) neighbourhoods based on Census surveys conducted in 2000 and in 2010. Source: 2000 and 2010 IBGE Censuses and Rufino et al. (2018).
Figure 4 shows the frequency of albedo classes in the studied periods. The years 2001 and 2006 recorded very close frequencies of albedo classes. The albedo class 10-20 (%) increased in 2011 in comparison to the other years, the fact that may be related to greater soil exposure and waterproofing. Most residential lots recorded shallow albedo surface values. It mostly happened due to high concrete or asphalt paving rates verified in open areas (Giridharan, Ganesan, & Lau, 2004). The trend in urban environments has been changing in recent times: the outer surface is usually paved with cement bricks or tiles. These materials have a relatively higher albedo than concrete and asphalt surfaces (Giridharan et al., 2004). Based on changes in these constructive typologies and on population increase, the year 2017 recorded 30-40%, 40-50% and 50-60% increase in albedo classes. In this year, there are the highest albedo variations (Δalbedo). The highest albedo values were associated with the type and colour of the material used in constructions in an urban site. Figure 4 presents the statistical analysis applied to the frequency of albedo variations throughout the studied periods.
Conclusion
The use of surface albedo as an indicator of urban growth and/or expansion analysis through remote sensing can be a valuable instrument for policymakers in urban land-use and occupation. The cross-analysis applied to population, and albedo data showed a strong relationship between these two distinct types of data.
The city of Petrolina had accelerated urbanization from 2011 to 2017, as well as urban growth by approximately 14%. Also, the county presented explicit growth vectors towards the Northern and Southwestern regions, which were little urbanized years before the last Census survey (IBGE, 2010).
Acknowledgements
The authors are grateful to the project ‘Impactos das Mudanças Climáticas em Extremos Hidrológicos (Secas e Cheias)’ (Climate Change Impacts on Hydrological Extremes - Droughts and Floods), to the National Water Agency (ANA - Agência Nacional de Água) and to the Coordination of Improvements of High Level Personnel (Capes - Coordenação de Aperfeiçoamento de Pessoal de Nível Superior).
References
Allen, R. G., Trezza, R., & Tasumi, M. (2002). SEBAL: Surface Energy Balance Algorithms for Land. Advance training and users manual. Boise, ID: NASA EOSDIS/Synergy grant from the Raytheon Company.
Araújo, G. J. F., & Silva, M. M. (2013). Crescimento econômico do semiárido brasileiro: o caso do polo frutícola Petrolina/Juazeiro. Caminhos de Geografia, 14(46), 246-264.
Buyantuyev, A., Wu, J., & Gries, C. (2007). Estimating vegetation cover in an urban environment based on Landsat ETM+ imagery: a case study in Phoenix, USA. International Journal of Remote Sensing, 28(2), 269-291. doi: 10.1080/01431160600658149
Chudnovsky, A., Ben-Dor, E., & Saaroni, H. (2004). Diurnal thermal behavior of selected urban objects using remote sensing measurements. Energy and Buildings, 36(11), 1063-1074. doi: 10.1016/j.enbuild.2004.01.052
Cunha, J. E. B. L., Taveira, I. M. L. M., Rufino, I. A. A., & Alcântara, H. M. (2014). Dinâmica sazonal da cobertura do solo em uma região semiárida e seus impactos no ciclo hidrológico. Revista Brasileira de Recursos Hídricos, 19(2), 197-207. doi: 10.21168/rbrh.v19n2.p197-207
Du, P., Xia, J., & Feng, L. (2015). Monitoring urban impervious surface area change using China-Brazil Earth Resources Satellites and HJ-1 remote sensing images. Journal of Applied Remote Sensing, 9(1), 096094. doi: 10.1117/1.JRS.9.096094
Fu, P., & Weng, Q. (2018). Responses of urban heat island in Atlanta to different land-use scenarios. Theoretical and Applied Climatology, 133(1-2), 123-135. doi: 10.1007/s00704-017-2160-3
Giridharan, R., Ganesan, S., & Lau, S. S. Y. (2004). Daytime urban heat island effect in high-rise and high-density residential developments in Hong Kong. Energy and Buildings, 36(6), 525-534. doi: 10.1016/j.enbuild.2003.12.016
Goodman, S. J. (1999). Urban climatology and air quality – heat island (Nasa/GHCC Project Atlanta). Retrieved from https://weather.msfc.nasa.gov/urban/urban_heat_island.html
Guo, H., Huang, Q., Li, X., Sun, Z., & Zhang, Y. (2013). Spatiotemporal analysis of urban environment based on the vegetation–impervious surface–soil model. Journal of Applied Remote Sensing, 8(1), 084597. doi: 10.1117/1.JRS.8.084597
Hou, M., Hu, Y., & He, Y. (2014). Modifications in vegetation cover and surface albedo during rapid urbanization: A case study from South China. Environmental Earth Sciences, 72(5), 1659-1666. doi: 10.1007/s12665-014-3070-7
Hu, Y., & Jia, G. (2010). Influence of land use change on urban heat island derived from multi-sensor data. International Journal of Climatology, 30(9), 1382-1395. doi: 10.1002/joc.1984
Imhoff, M. L., Zhang, P., Wolfe, R. E., & Bounoua, L. (2010). Remote sensing of the urban heat island effect across biomes in the continenal USA. Remote Sensing of Environment, 114(3), 504-513. doi: 10.1016/j.rse.2009.10.008
Instituto Brasileiro de Geografia e Estatística [IBGE]. (2000). Dados do censo demográfico. Retrieved from https://www.ibge.gov.br/censo/
Instituto Brasileiro de Geografia e Estatística [IBGE]. (2010). Dados do censo demográfico. Retrieved from https://censo2010.ibge.gov.br/
Instituto de Pesquisa Econômica Aplicada [IPEA]. (2018a). Dados macroeconômicos e regionais. Ipeadata. Retrieved from https://sistema.bibliotecas-bdigital.fgv.br/bases/instituto-de-pesquisa-economica-aplicada-ipea-ipeadata-dados-macroeconomicos-e-regionais
Instituto de Pesquisa Econômica Aplicada [IPEA]. (2018b). Dados do censo demográfico. Ipeadata. Retrieved from https://sistema.bibliotecas-bdigital.fgv.br/bases/instituto-de-pesquisa-economica-aplicada-ipea-ipeadata-dados-macroeconomicos-e-regionais
Intergovernmental Panel on Climate Change [IPCC]. (2014). Climate change 2014 – impacts, adaptation and vulnerability: part A: global and sectoral aspects. Cambridge, UK: Cambridge University Press.
Jandaghian, Z., & Akbari, H. (2018). The effect of increasing surface Albedo on urban climate and air quality: a detailed study for Sacramento, Houston, and Chicago. Climate, 6(2), 1-21. doi: 10.3390/cli6020019
Kant, Y., Azim, S., & Mitra, D. (2018). Analyzing the influence of urban growth on thermal environment through demographic, environmental, and physical parameters in Bangladesh. In K. P. Vadrevu, T. Ohara, & C. Justice (Eds.), Land-atmospheric research applications in South and Southeast Asia (p. 613-639). Springer.
Klostermann, R. E. (1999). The what if? Collaborative planning support system. Environment and Planning, 26(3), 393-408. doi: 10.1068/b260393
Longley, P. A., & Mesev, V. (2000). On the measurement and generalization of urban form. Environment and Planning, 32(3), 473-488. doi: 10.1068/a3224
Masek, J. G., Vermote, E. F., Saleous, N., Wolfe, R., Hall, F. G., & Huemmrich, F. (2006). A land surface reflectance data set for North America, 1990-2000. IEEE Geoscience and Remote Sensing Letters, 3(1), 68-72. doi: 10.1109/LGRS.2005.857030
Mcgarigal, K., Plunkett, E. B., Willey, L., Compton, B. W., Deluca, V. W., & Grand, J. (2017). Designing sustainable landscapes: modeling urban growth. Report to the North Atlantic Conservation Cooperative, US Fish and Wildlife Service. Amherst, MA: University of Massachusetts Amherst.
Pathirana, A., Denekew, H. B., Veerbeek, W., Zevenbergen, C., & Banda, A. T. (2013). Impact of urban growth-driven landuse change on microclimate and extreme precipitation - a sensitivity study. Atmospheric Research, 138, 59-72. doi: 10.1016/j.atmosres.2013.10.005
R Core Team. (2018). The R Project for Statistical Computing. Retrieved from http://www.r-project.org/
RStudio Team. (2016). RStudio: Integrated Development for R. RStudio. Retrieved from https://www.rstudio.com/
Rufino, I. A. A., Gusmão, I. G., Melo Filho, H., & Santos, E. D. L. (2018). Atlas digital Petrolina. Projeto CIMA - Cidades Inteligentes e Modelagem Ambiental. Retrieved from https://issuu.com/cimaufcg/docs/atlas_digital_-_campina_grande_-_te
Setiawan, H., Mathieu, R., & Thompson-Fawcett, M. (2006). Assessing the applicability of the V-I-S model to map urban land use in the developing world: case study of Yogyakarta, Indonesia. Computers, Environment and Urban Systems, 30(4), 503-522. doi: 10.1016/j.compenvurbsys.2005.04.003
Shafizadeh-Moghadam, H., Asghari, A., Tayyebi, A., & Taleai, M. (2017). Coupling machine learning, tree-based and statistical models with cellular automata to simulate urban growth. Computers, Environment and Urban Systems, 64, 297-308. doi: 10.1016/j.compenvurbsys.2017.04.002
Shuai, Y. J., Masek, G., Gao, F., Schaaf, C. B., & He, T. (2014). An approach for the long-term 30-m land surface snow-free albedo retrieval from historic Landsat surface reflectance and MODIS-based a priori anisotropy knowledge. Remote Sensing of Environment, 152, 467-479. doi: 10.1016/j.rse.2014.07.009
Silva, B. B., Lopes, G. M., & Azevedo, P. V. (2005). Determinação do albedo de áreas irrigadas com base em imagens LANDSAT 5 – TM. Revista Brasileira de Agrometeorologia, 13(2), 201-211.
Son, N., Chen, C., Chen, C., Chang, L., & Thanh, B. (2012). Urban growth mapping from Landsat data using linear mixture model in Ho Chi Minh City, Vietnam. Journal of Applied Remote Sensing, 6(1), 063543. doi: 10.1117/1.JRS.6.063543
Tang, R., Zhao, X., Zhou, T., Jiang, B., Wu, D., & Tang, B. (2018). Assessing the impacts of urbanization on albedo in Jing-Jin-Ji Region of China. Remote Sensing, 10(7), 1-21. doi: 10.3390/rs10071096
United Nations International Strategy for Disaster Reduction [UNISDR]. (2013). Global assessment report on disaster risk reduction 2013 – from shared risk to shared value: the business case for disaster risk reduction. Geneva, CH: UNISDR Secretariat.
Vermote, E. F., El Saleous, N., Justice, C. O., Kaufman, Y. J., & Privette, J. L. (1997). Atmospheric correction of visible to middle- infrared EOS-MODIS data over land surfaces: Background, operational algorithm, and validation. Journal of Geophysical Research, 102(D14), 1731-1741. doi: 10.1029/97JD00201
Wang, Y., Berardi, U., & Akbari, H. (2016). Comparing the effects of urban heat island mitigation strategies for Toronto, Canada. Energy and Buildings, 114, 2-19. doi: 10.1016/j.enbuild.2015.06.046
Weng, Q. (2001). A remote sensing–GIS evaluation of urban expansion and its impact on surface temperature in the Zhujiang Delta, China. International Journal of Remote Sensing, 22(10), 1999-2014. doi: 10.1080/713860788
Zhai, J., Liu, R., Liu, J., Huang, L., & Qin, Y. (2015). Human-induced landcover changes drive a diminution of land surface Albedo in the loess plateau (China). Remote Sensing, 7(3), 2926-2941. doi: 10.3390/rs70302926
Notas de autor
michele.laurentino@gmail.com
