Abstract: The aim of this work was to evaluate different concentrations of ethanol on antioxidant (phenolic and flavonoid) compounds extraction of Mentha x Piperita aiming at applying the extract in whey-based dairy beverages. The extracts were obtained by cold maceration using water and ethanol as solvents. The extract using water and 70% ethanol had a 13.83 (w w-1) yield, 61.72 mg GAE g-1 phenolic compounds extract, 37.27 mg QE g-1 flavonoid content extract and 0.056 mg mL-1 antioxidant activities. The dairy beverage formulations followed a 22 factorial design in order to evaluate the effect of whey/milk and starch addition on the physical-chemical (pH, acidity, moisture, ash, fat, protein, viscosity, and color) and sensorial characteristics (acceptability) of the product. Analysis of variance (ANOVA) allowed for the development and validation of mathematical models for ash content, lipids, viscosity, and luminosity of the dairy beverage. The effects of whey/milk and starch variables on such characteristics were analyzed by the elaboration of contour curves. The product presented a lower color intensity at the highest whey concentration (75%). The product had a good sensory acceptance, and the 50 whey and 50% milk formulation presented a 7.16 points average and 79.51% acceptance index, suggesting that 50% of whey could be added up to the product’s formulation.
Keywords:mintmint,extractionextraction,phenolic, flavonoidphenolic, flavonoid,antioxidantantioxidant.
Science, Food Technology and Food Engineering
Development of pasteurized coffee-flavored dairy beverage added with mint extract (Mentha x piperita)
Universidade Estadual de Maringá

Esta obra está bajo una Licencia Creative Commons Atribución 4.0 Internacional.
Recepción: 25 Junio 2019
Aprobación: 05 Agosto 2019
About 35% of the milk in Brazil is intended for cheese production. 10 liters of milk are used on average to produce 1 kg of cheese, resulting in 8 to 9 liters of whey. The annual cheese production in Brazil reaches 450,000 tons, which results in about 4,050,000 liters of cheese whey (Poppi, Costa, Rensis, & Sivieri, 2010).
According to Venturini Filho (2010), the use of whey in dairy beverages is feasible, since in addition to increasing the nutritional value of the product it prevents its disposal and pollution. The use of whey in dairy beverages is an attractive option for the dairy industry as it is a straight forward process using ready-available equipment and requiring a small investment.
According to the Technical Regulation of the Identity and Quality of Dairy Beverages (Brasil, 2005), a dairy beverage is defined as the dairy product resulting from the mixing of milk and whey, added or not with food product(s), vegetable fat, fermented milk(s), selected fermented milks s and other dairy products (Brasil, 2005).
Functional foods are those that produce metabolic or physiological effects on fundamental functions of the human body as well as basic nutritional functions (Silva & Martins, 2018). Some beneficial effects of these foods are associated with the presence of bioactive compounds, which are antioxidant substances capable of preventing oxidation and reducing the risk of several diseases (Paula, Salles, Paula, Rodrigues, & Duarte, 2015). Antioxidants are also used in the food industry as additives to extend food products’ shelf-life (Bulut et al., 2019).
Coffee is one of the most consumed beverages around the world. According to the Associação Brasileira da Indústria de Café (Abic) the Brazilian per capita consumption of roasted and ground coffee increased from 5.03 to 5.10 kg in 2017, an equivalent to 83 liters of coffee for each Brazilian citizen (Associação Brasileira da Indústria de Café [Abic], 2018). According to Arruda et al. (2009), the coffee market offers great potential, since its aroma is the attribute most appreciated by consumers.
Mint (Mentha spp.), also popularly known in Brazil as ‘hortelã’, is used as tea, food flavoring and in natura seasoning. Some studies have indicated a good antioxidant and antimicrobial potential of some mint species (Azevedo et al., 2011;Freitas, Azevedo, Souza, Rocha, & Santos, 2014). Peppermint (Mentha x Piperita) holds a strong, pleasant, spicy flavor and is to be found in food products such as beverages, chewing gum and teas (Benhabyles-Bouttaba, Laoufi, Bouchenak, Yahiaoui, & Arab, 2018).
The study and production of dairy beverages in Brazil has become widespread, considering consumer demands for healthy, innovative, practical, and safe products. Nevertheless, according to Ferreira, Couto, Ribeiro, & Ferreira (2015), most research is related to fermented dairy beverages with few studies on pasteurized dairy beverages with functional properties.
In this sense, the aim of this work was the development of and physico-chemical and sensorial characterization of a functional milk-based coffee-flavored mint extract-added dairy beverage with the partial use of whey, for an alternative use of whey and innovation in functional products for small-, medium- and large-sized dairy companies by a simple process using readily available equipment found in the industry.
The plant materials used in this study were leaves and stalk of M. x piperita used as tea, previously dried, donated by a herb and tea company located in the northern region of Rio Grande do Sul state, Brazil. The plant materials were ground in a knife mill (Marconi, MA048) with a 20 mesh screen diameter (859 µm) used for grain size standardization. Before the extractions, the moisture content was determined using an infrared moisture meter (Marte, ID200), as described by Garcia-Amoedo & Almeida-Muradian (2002).
The extracts were obtained by cold maceration as described by Ramar et al. (2015) with modifications. 20 g of vegetable sample was added in to 200 mL solvent (1:10, w v-1). The extractions were carried out with water, 50% ethanol, 70% ethanol and 95% ethanol with the hydro alcoholic solvents diluted in distilled water (v v-1). The extraction was conducted at 7°C±1 for 72 hours, then the extracts were filtered and dried in a lyophilizer (Edwards, Modulyo) coupled to a vacuum pump (Edwards, RV8) for yield determination. The dried extract was re-suspended in absolute ethanol (Merck) at 20 mg mL-1 concentrations for the subsequent analyses.
The total phenolic content was determined by the Folin-Ciocalteau method, using gallic acid as the reference standard, as described by Singleton, Orthofer and Lamuela-Raventós (1999), with modifications. 0.5 mL extract at 5 mg mL-1 concentration was added to a test tube containing 2.5 mL Folin-Ciocaleau reagent (diluted in distilled water, 1:10 v v-1) and 2 mL 4% sodium carbonate (w v-1). The tubes were shaken and stored at room temperature for 2 hours in the absence of light. The absorbance reading was then performed using a spectrophotometer (Pró-Análise, UV-1600) at 760 nm. The analyses were performed in triplicate, where the phenolic compounds content was obtained by linear regression analysis from a standard curve using gallic acid from1 to 100 µg mL-1 concentrations. The results were expressed in milligrams of gallic acid equivalent per gram of dry extract (mg GAE g-1).
The flavonoid content was determined using quercetin as the reference standard as per method by Garrido, Ortiz, and Pozo (2013), with adaptations. 0.5 mL extract at 5 mg mL-1 concentration was added to a test tube containing 4.3 mL of 70% ethanol (v v-1), 0.1 mL 10% aluminum nitrate (m v-1) and 0.1 mL 10% potassium acetate (w v-1). The tubes were shaken and stored at room temperature in the absence of light for 40 min. The absorbance was then read using a spectrophotometer (Pró-análise, UV-1600) at 415 nm. The analyses were performed in triplicate, where the flavonoid content was obtained by linear regression analysis from a standard curve using quercetin from 5 to 100 µg mL-1 concentrations. The results were expressed in milligrams of quercetin equivalent per gram of dry extract (mg QE g-1).
The determination of antioxidant activity was performed by the free radical capture method 2,2-Diphenyl-1-picrylhydrazyl (DPPH) described by Brand-Williams, Cuvelier, & Berset (1995). 0.1 mM DPPH in 2 mL ethanolic solution and 2 mL of extract in increasing concentrations (from 0.0025 to 10 mg mL-1), diluted in 96% ethanol (Scientific Exodus) were added to the test tubes and incubated for 30 min. in the absence of light. The readings were performed using a spectrophotometer (Pró-Análise, UV-1600) at 515 nm. The analyses were performed in triplicate and the antioxidant activity was obtained by linear regression analysis and expressed in EC50 values, representing the effective concentration in milligrams per milliliter (mg mL-1) of extract required to capture 50% of the free radical.
In order to study the effect of whey/milk ratio(v v-1) and the starch content to be added to the dairy beverage formulation, a 22 factorial design was developed, varying the whey/milk ratio and the starch (Table 1), and fixing the concentration of sugar at 5 (w v-1), coffee at 0.75 (w v-1) and mint extract at (0.025% (w v-1), based on previous tests.
Whey from Mozzarella-type cheese production obtained by the enzymatic coagulation of milk from a dairy company located in the north of Rio Grande do Sul state, Brazil was used for the dairy beverage formulation. It underwent a protein removal process, which consisted of heating at 80°C for 15 min., cooling it to room temperature and subsequent filtration (Krüger et al., 2008). 2 L of product were prepared from the mixture of whey and milk, maize starch as a thickening agent, and sugar (5%, w v-1), used for each planning assay. The mixture was heat-treated at 65°C for 30 min. Coffee (0.75%, w v-1) and mint extract (0.025%, w v-1) were then added and homogenized. The mixture was cooled to 10°C and stored in polyethylene bottles until analysis (Paula, Almeida, Pinto, Teodoro, & Costa, 2012).
In order to determine the physico-chemical characteristics of the dairy beverage, pH analyses was performed using a digital pHmeter (Digimed), titrating acidity was determined by Dornic solution, moisture by oven drying, ashes content by incineration, protein by the Kjeldahl method and lipids content by the Gerber method, all in accordance with #68 Normative Instruction procedures dated December 12, 2006 (Brasil, 2006).
The product’s viscosity was determined by a digital viscometer (Brookfield LV DVII+) with LV-ULA spindle coupled for 5 s at 65 rpm and 10°C. The viscosity value was expressed in centipoise (cP).
For color determination, the portable colorimeter equipment (Minolta CR400) was used in the L*, a*, and b* scales. To verify the color difference among the dairy beverage samples, parameters a* and b* were presented in a color chart in terms of chromaticity (C*) calculated by Equation 1, and color angle °hour calculated by Equation 2, whereas parameter L*, which indicates luminosity was treated statistically (Machado, Hotza, Petter, & Bergmann, 1997; Rodrigues, Souza, Lima, Moura, & Geraldine, 2013).


For the sensorial analysis, 45 untrained people took part by evaluating the samples (global assessment) using a 9-point hedonic scale, with 1 – dislike extremely and 9 – like extremely (Instituto Adolfo Lutz [IAL], 2008).
Sensory evaluation was conducted 24 hours after product preparation in individual booths under white artificial light, where the panelists received disposable plastic cups containing approximately 30 mL of the dairy beverage at 8°C, coded with three random digits and a balanced distribution, with drinking water between samples tasting. The present study is in compliance with Resolution 466 dated December 12, 2012, of the National Health Council (Brasil, 2013) regarding research with human beings, approved by the Ethics and Research Committee (opinion # 2.470.920 and Certificate of Presentation and Appraisal of Ethics – CAAE number 81113617.2.0000.5351).

Table 1.
Independent variables and levels used in the 22 factorial design for the pasteurized dairy beverage preparation.
*Fixed variables: 5 (w v-1) sugar, 0.75 (w v-1) coffee and 0.025% (w v-1) mint extract.
Statistical analyses were performed using Statistica software (StatSoft, 5.0, Tulsa, USA). The established level of significance was 95% (p < 0.05) and the average comparison was performed using the Tukey test.
The moisture of the M. x piperita sample used was 8.9% as determined by infra-red. Table 2 presents the models and determination coefficients of gallic acid and quercetin standard curves used to determine the total phenolic and flavonoid contents. The standard curves presented satisfactory determination coefficients. Table 3 presents the extraction yield, the phenolic and flavonoid compounds content, flavonoids and the antioxidant activity of M. x piperita extracts on the different solvents concentrations.
The highest yield was achieved using 70% ethanol, with 13.83 (w w-1), 50% ethanol, water and 95% ethanol presented 13.53, 12.72, and 6.14% yields (w w-1) respectively. For mass extraction yield, the ethanol concentration used in the M. x piperita extraction was similar in water, 50 and 70% ethanol, and only 95% ethanol presented a lower yield. Solvent saturation is a limitation for mass transfer that occurs in the maceration extraction method
For total phenolic content, the Tukey test indicated a significant difference (p < 0.05) for all solvent concentrations used. The aqueous extract had the highest 65.44 mg GAE g-1 extract content, followed by 70, 95, and 50% ethanol with 61.72, 55.54, and 25.40 mg GAE g-1 extract contents, respectively. The phenolic compounds extraction tended to increase with the reduction of ethanol concentration, except for 50% ethanol.
For flavonoid content, the Tukey test indicated a significant difference (p < 0.05) for all ethanol concentrations and a tendency in relation to solvent concentration could not be established. The highest flavonoid content was obtained using 70% ethanol with 37.27 mg QE g-1 extract. The other concentrations also showed good contents; 33.87 with aqueous extract, 27.12 with 95% ethanol, and 13.29 mg QE g-1 with 50% ethanol.
All extracts presented excellent antioxidant activity. The extract obtained with 70% ethanol showed the best antioxidant activity with EC50 of 0.056 mg mL-1. The aqueous extract and the one using 95% ethanol did not present any significance difference between them by Tukey test (p > 0.05), with EC50 of 0.070 and 0.079 mg mL-1, respectively. The 50% ethanol extract presented the highest EC50 (0.167 mg mL-1).
In this study the EC50 of extracts presented a high correlation with the total phenolic (R = -0.979) and flavonoid content (R = -0.972), indicating that the antioxidant potential of extracts is directly related to the extracts obtained. Compounds extraction with antioxidant properties depend on the affinity and selectivity of the solvent, as well as its concentration.
Solvent concentration and its polarity and selectivity are important factors for the extraction processes since the affinity of the solvent with the intracellular compounds influences the mass transfer and the functional properties of the extract. According to Barchan, Bakkali, Arakrak, Pagán, and Laglaoui (2014), the selective extraction from natural sources by an appropriate solvent is key for obtaining high-antioxidant-activity fractions.
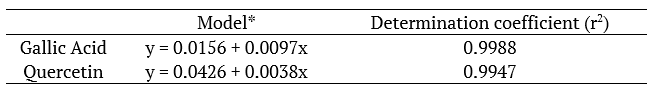
Table 2.
Models and determination coefficient of gallic acid and quercetin standard curves.
*where ‘y’ is the absorbance, and ‘x’ is the concentration in µg mL-1.
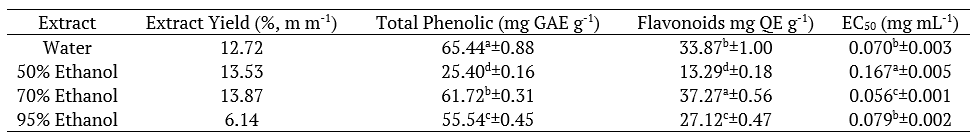
Table 3.
Total phenolic, flavonoids and antioxidant activity of M. x piperita extracts.
Means±standard deviation followed by equal letters/columns indicate that there is no significant difference at the level of 95% (Tukey’s test).
The influence of whey/milk ratio and starch content on the physico-chemical characteristics of the dairy beverage was evaluated. Table 4 presents the product’s pH, acidity, moisture, protein, ash, lipids, viscosity, and color results, according to a 22 factorial design. The results presented in Table 4 were treated statistically, for each physical-chemical analysis.
Figure 1a presents the Pareto Chart for the dairy beverage pH. The whey/milk variable presented a significant negative effect, indicating a pH reduction in the product with the increase of whey. Assays 2 and 4, which used lower whey content, presented a significant difference (Tukey test) from the other assays. The values found in this study are in agreement with those found by Sousa, Fernandes, and Fernandes (2015) who obtained a pH of 6.53 when studying a dairy beverage added with iron. Some dairy beverages studies (Silva, Medeiros, Monteiro, & Silva, 2010;Moura et al., 2016) presented 4.0 pH values, with such difference caused by a pH correction using citric acid, or fruit in the product composition, or even by L. acidophilus activity during fermentation (Moura et al., 2016).
Figure 1b presents the Pareto Chart for the dairy beverage acidity, where the two studied variables did not present any significant effect (p > 0.05) within the studied range. The Whey/Milk content variation and the starch content did not influence the acidity of the samples. The lactic acid content may function as an indicator of the raw materials and dairy products quality and either microbial activities or enzymatic reactions might cause acidity increase (Islam, Sarker, Prabakusuma, Russel, & Islam, 2018).
According to the estimated effects of variables studied on the dairy beverage`s moisture content presented in Figure 1c, the two variables and the interaction between them presented a significant effect (p < 0.05), and the whey/milk ratio (48.5) and starch content (46.4) showed a positive effect. The results indicated an upward tendency in moisture content with the addition of an extra whey to the product. All the assays showed a significant difference between them (Tukey test), except for the central point. The high content of water (93.51%) in whey (Data provided by a dairy company) increases the product`s moisture content when increasing the amount of water.
For protein content, the two variables studied presented a significant effect (p < 0.05), the whey/milk ratio showed a negative effect (-80.0), whereas the starch content showed a positive effect (52.0), as seen in Figure 1d. The interaction between the variables did not present any significant effect within the studied range. The protein content reduction on the beverage is linked to the amount of whey added, assays 1 and 3, with the lowest amount of whey, presented a significant difference from the other assays (Tukey test) with the highest values for the protein content. It ought to be considered that whey underwent a deproteinization process since the proteins presented a high added value and could be intended to the production of protein concentrates or other food products (Antunes, Farinã, Kottwitz, & Passotto, 2015;Vasconcelos, Bachur, & Aragão, 2018;Soares et al., 2018).
The results for ash and lipids contents, viscosity, and luminosity were statistically treated by the analysis of variance and the non-significant effects (p > 0.05) were added to the lack of adjustment as seen in Table 4. Equation 3, 4, 5, and 6 present first order coded models for ashes, lipid, viscosity, and luminosity (L*) of the dairy beverage values, respectively. The models were validated by analysis of variance (ANOVA) obtaining correlation coefficients of 0.91, 0.94, 0.99, and 0.94 and the calculated F values (10.36, 15.29, 165.33 and 15.33) were higher than the tabulated F (9.28) value, which allowed the contour curves construction shown in Figure 2.

Table 4.
Physico-chemical characterization of coffee-flavored dairy beverage for pH, acidity, moisture, protein, ash, lipids, viscosity
s±standard deviation followed by equals letters/columns indicate no significant difference at the 95% level (Tukey’s test).
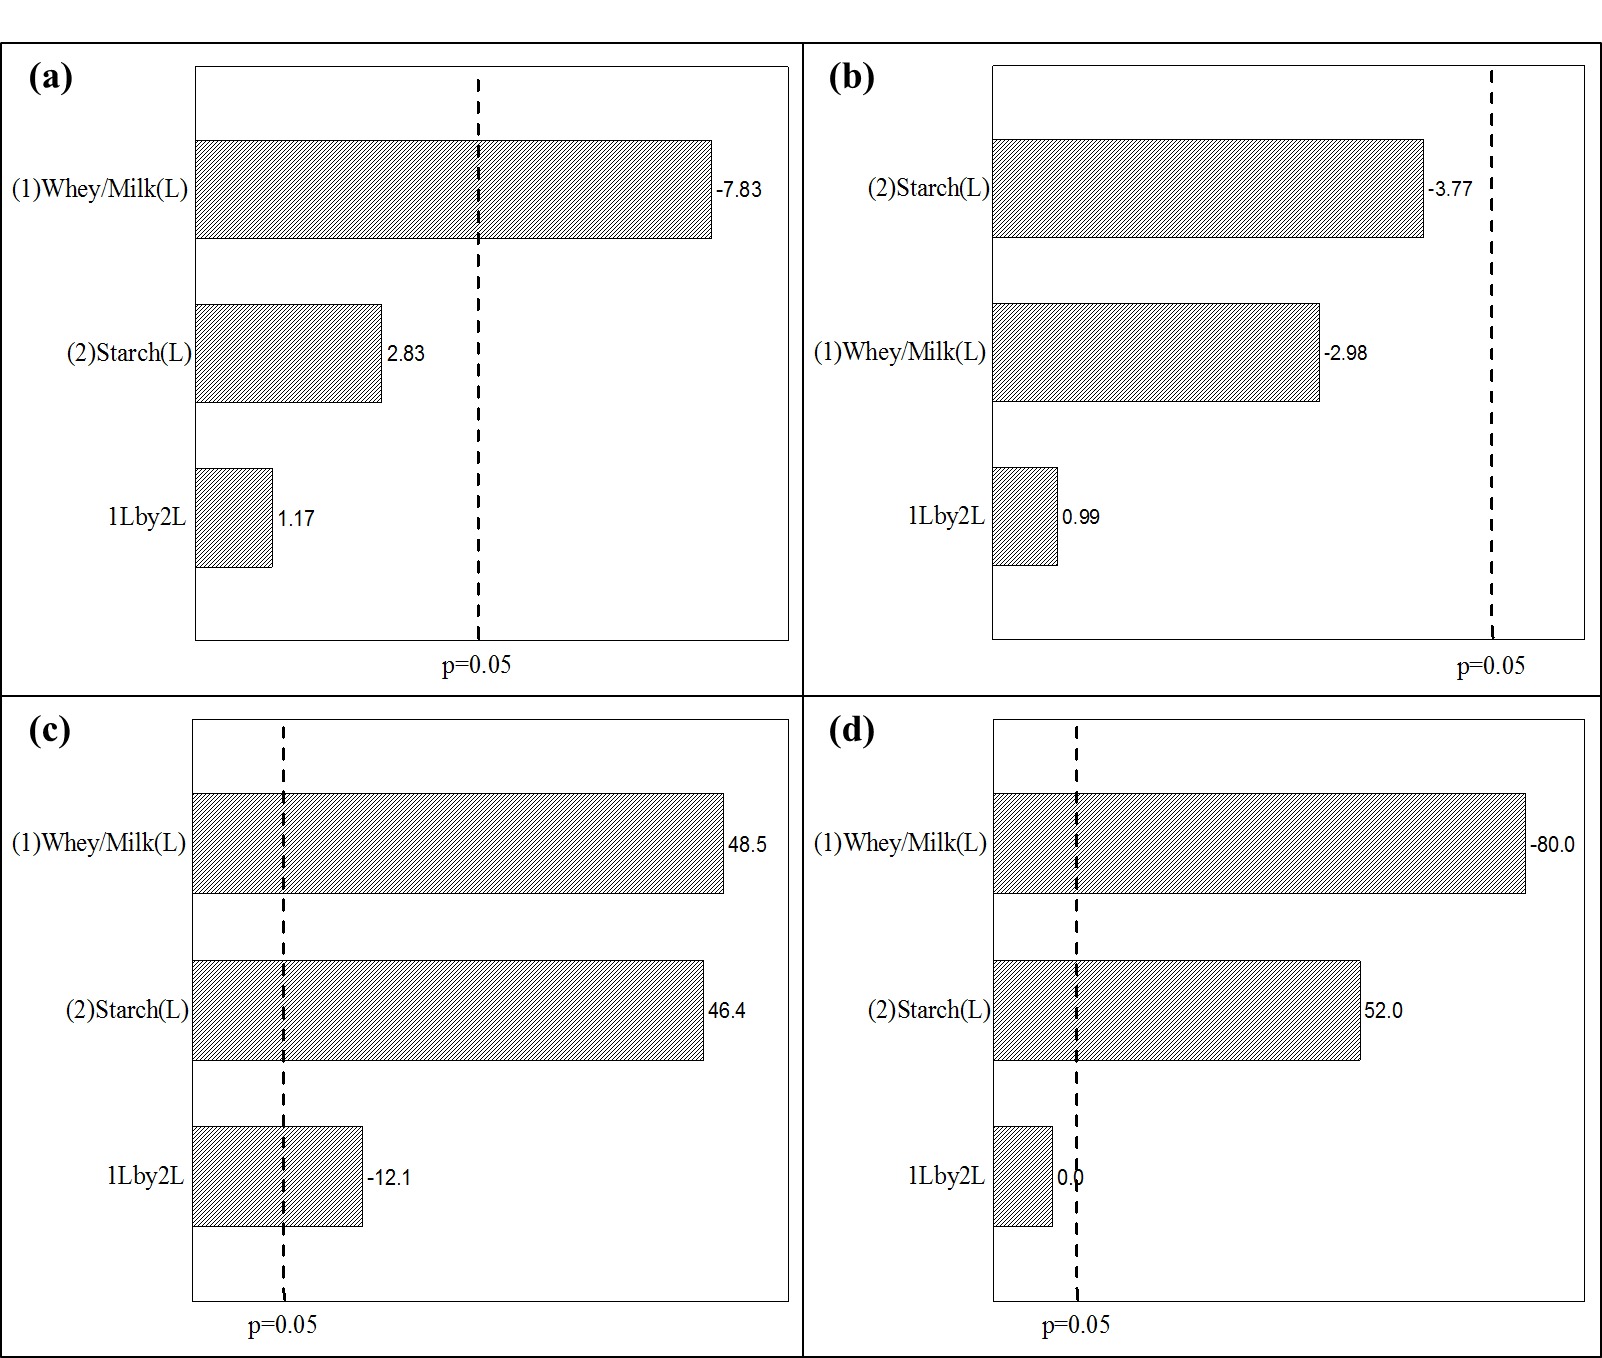
Figure 1.
Pareto Chart with estimated effects of whey/milk ratio and starch content variables on pH (a), acidity (b), moisture (c), and protein (d) of dairy beverage.
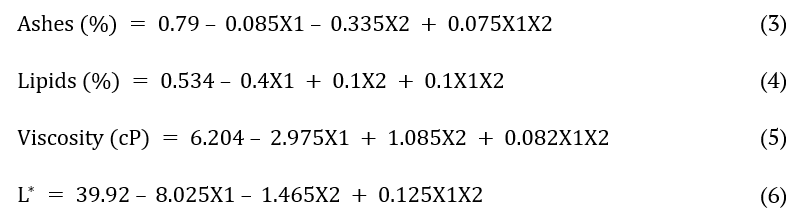
where: X1 and X2 are whey/milk ratio and starch content variables, respectively.
Figure 2b showed that the lowest lipid content is obtained, especially when using both the lower milk content and the higher whey content. Formulations 2 and 4 presented a significant difference from the others (Tukey test) with the lowest responses to lipid content. During whey production process, where coagulation takes place, the highest lipid fraction is removed from the milk for cheese production, thus the higher the milk content in the product formulation, the higher its lipid content.
For viscosity, all assays presented significant differences among them (Tukey test), except at the central point. Assay 3 formulated with higher starch and milk content presented higher viscosity (8.12 cP), whereas assay 2 formulated with a lower starch content and higher whey content presented lower viscosity (4.06 cP). The contour curve shown in Figure 2c indicated that the higher the milk content and the lower the whey concentration in the formulation, the higher the viscosity response. Starch is used as a thickening agent in order to compensate for the product`s loss of viscosity caused by adding whey, thus, an increase in starch content increases the viscosity of the beverage.
As shown in Figure 2d, the Luminosity (L*) of the dairy beverage tends to decrease as the whey content of the product increases. All the assays presented a significant difference (Tukey test), where assays 1 and 3, using a greater amount of milk in the formulations, presented the highest L* response values. The lower luminosity of the product by adding whey might be due to the differences in both milk and whey coloration, as milk is white in color while whey is yellowish-green and the L* parameter accepts values ranging from black (0) to white (100) (Silva, Silva, Augusto, Garim, & Catano, 2017).
Figure 3 shows the color diagram with the C* chroma vectors and the hour color angle of the dairy beverage samples. Assays 2 and 4, with higher whey content, differed from the others (Tukey test), which presented higher values for the a* parameter and lower for the b* parameter, resulting in a lower °hour color angle. In addition, the C* values were also lower than for the other samples, which indicates that the color of samples 2 and 4 tends slightly to a reddish and less intense hue, that is, the addition of whey decreased the intensity and color tone of the dairy beverage.
45 untrained panelists took part in the sensory analysis, 73.33 female, and 26.67% male. About 80% of panelists claimed to regularly consume dairy beverages, whereas the remaining 20% stated they do not consume dairy beverages. For coffee, 57.77% of the panelists stated they consume it more than once a day, 35.56% once a day, while 2.22% do not consume coffee.
In the analysis of variance for the panelists, the calculated F (1.17) was lower than the tabulated one (1.52), indicating that the sensorial analysis was performed with a homogeneous group of panelists. Significant difference (p < 0.05) occurred for the analysis of variance among the dairy beverage samples, and the calculated F for the samples (6.37) was greater than the tabulated one (2.48).
The five formulations (Formulations 5, 6 and 7 being triplicates) of the developed product are presented in Table 5, as described in the factorial design, in conjunction with the grades averages and the acceptability indexes of the coffee-flavored dairy beverage added with mint extract.
According to the results presented in Table 5, samples 1, 3, and 5 obtained acceptance rates higher than 79% and did not present any significant difference among them (p > 0.05). Samples containing higher milk content and lower whey content in formulation (1 and 3) obtained the highest average score (7.31) with acceptability of 81.23% for both samples.
According to Baú, Cunha, Cella, Oliveira, and Andrade (2010), the product must have an acceptability index above 70% for its sensory properties to be accepted. Therefore, in addition to samples 1 and 3, sample 5 containing 50% of whey and 50% milk showed a satisfactory acceptance rate indicating that adding up to 50% whey in the product formulation could be done.
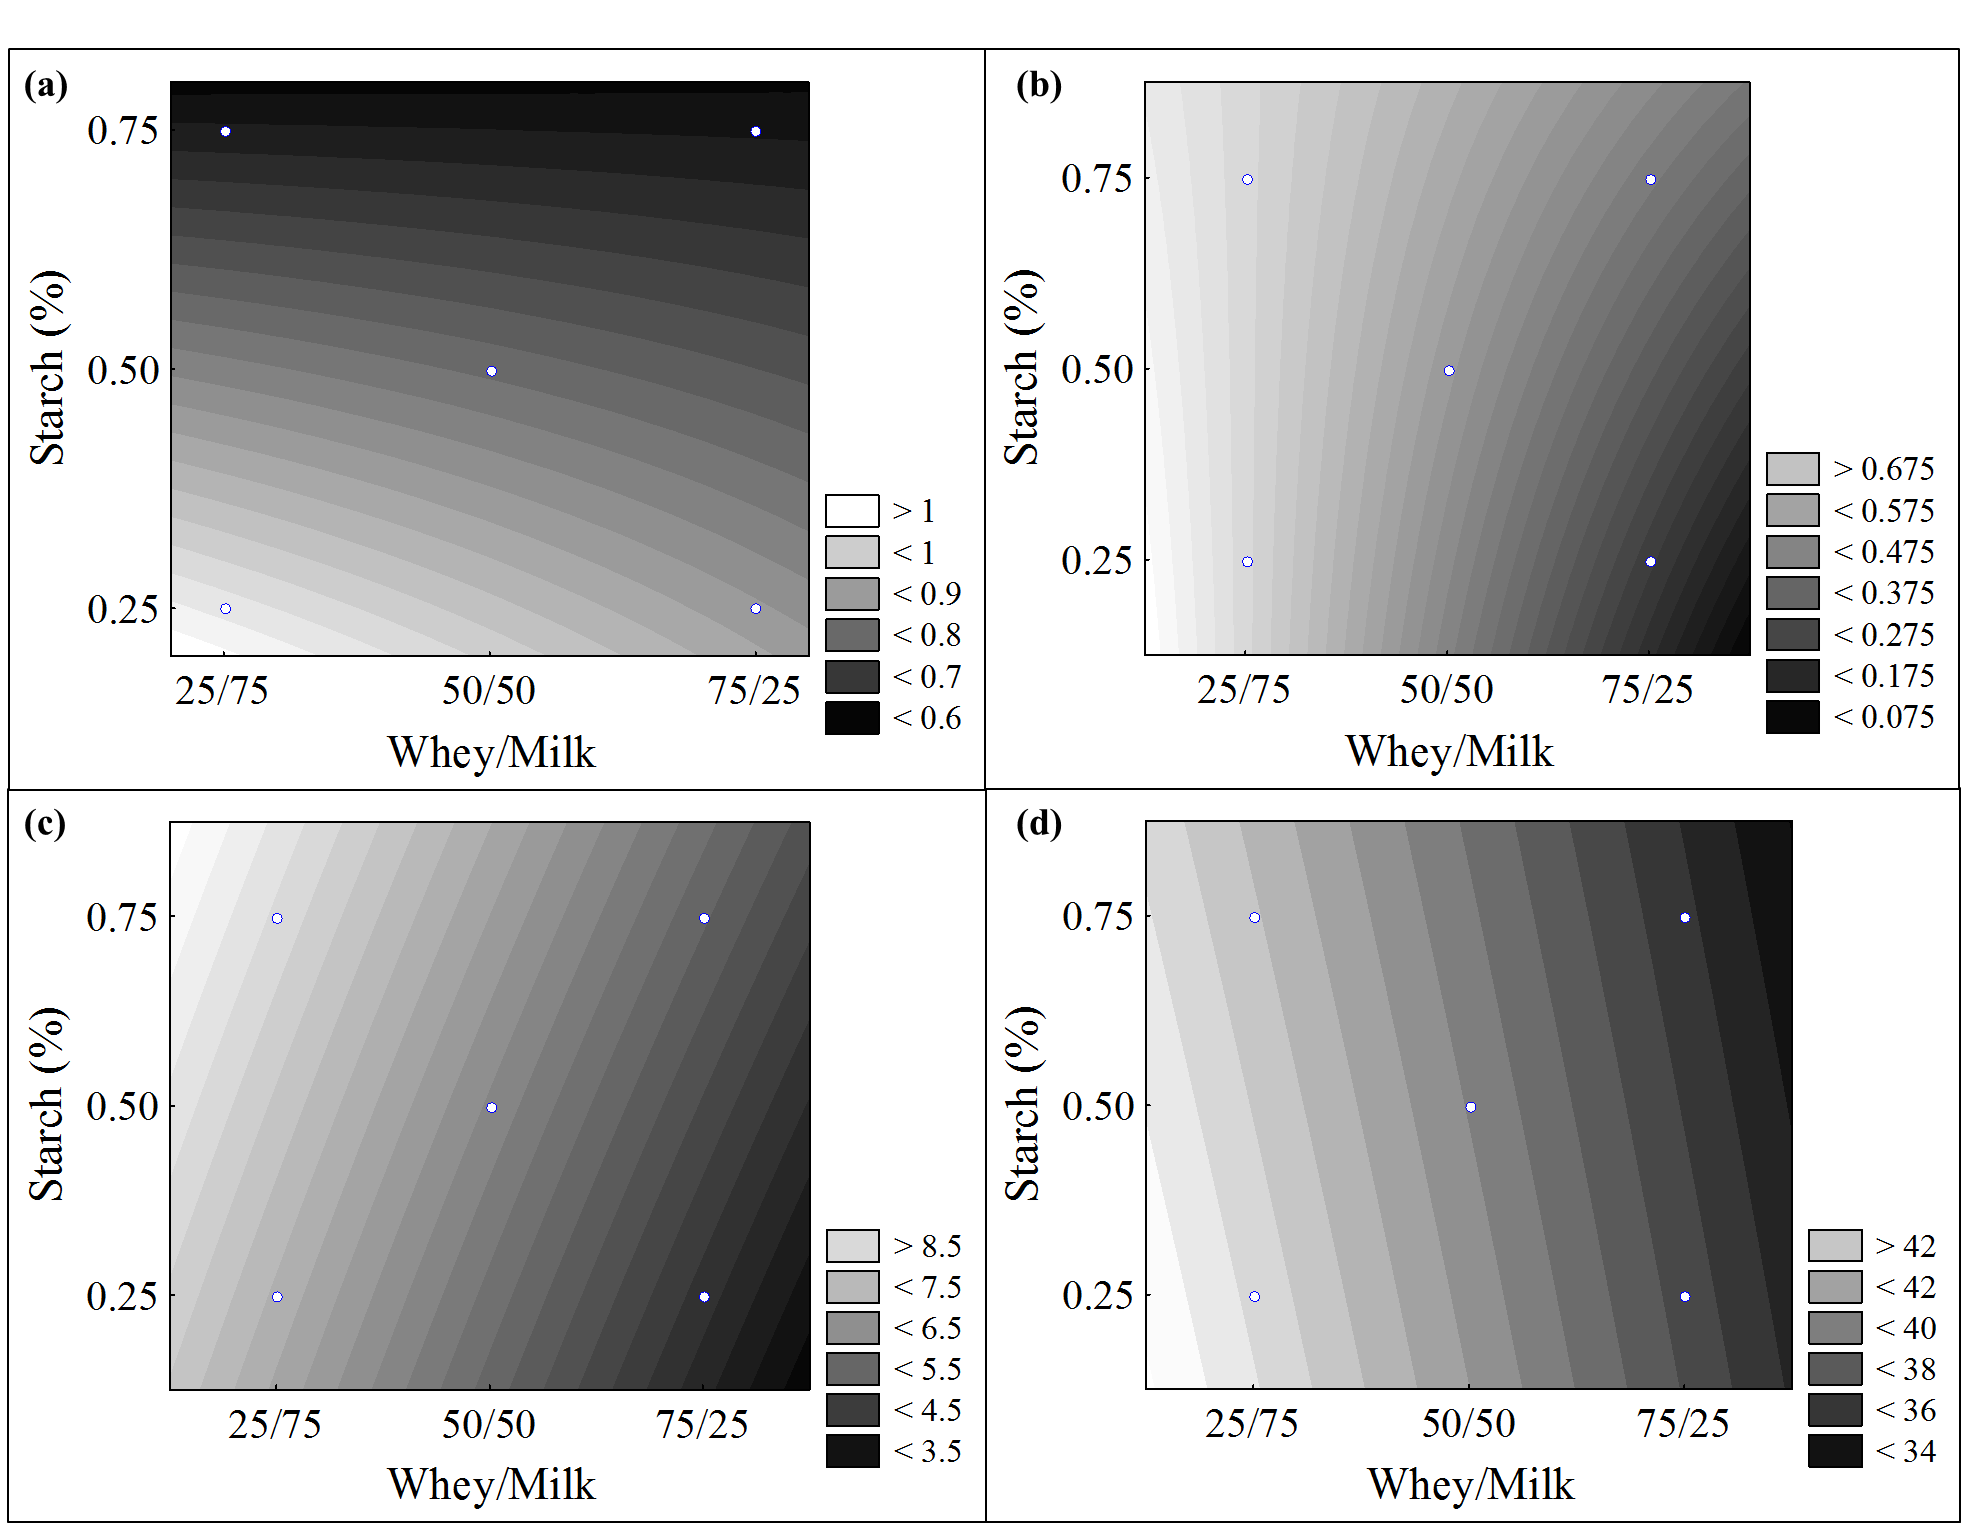
Figure 2.
Contour curves for ash content (a), lipids content (b), viscosity (c) and luminosity (d) of dairy beverage formulated as a function of whey/milk ratio and starch content variables.
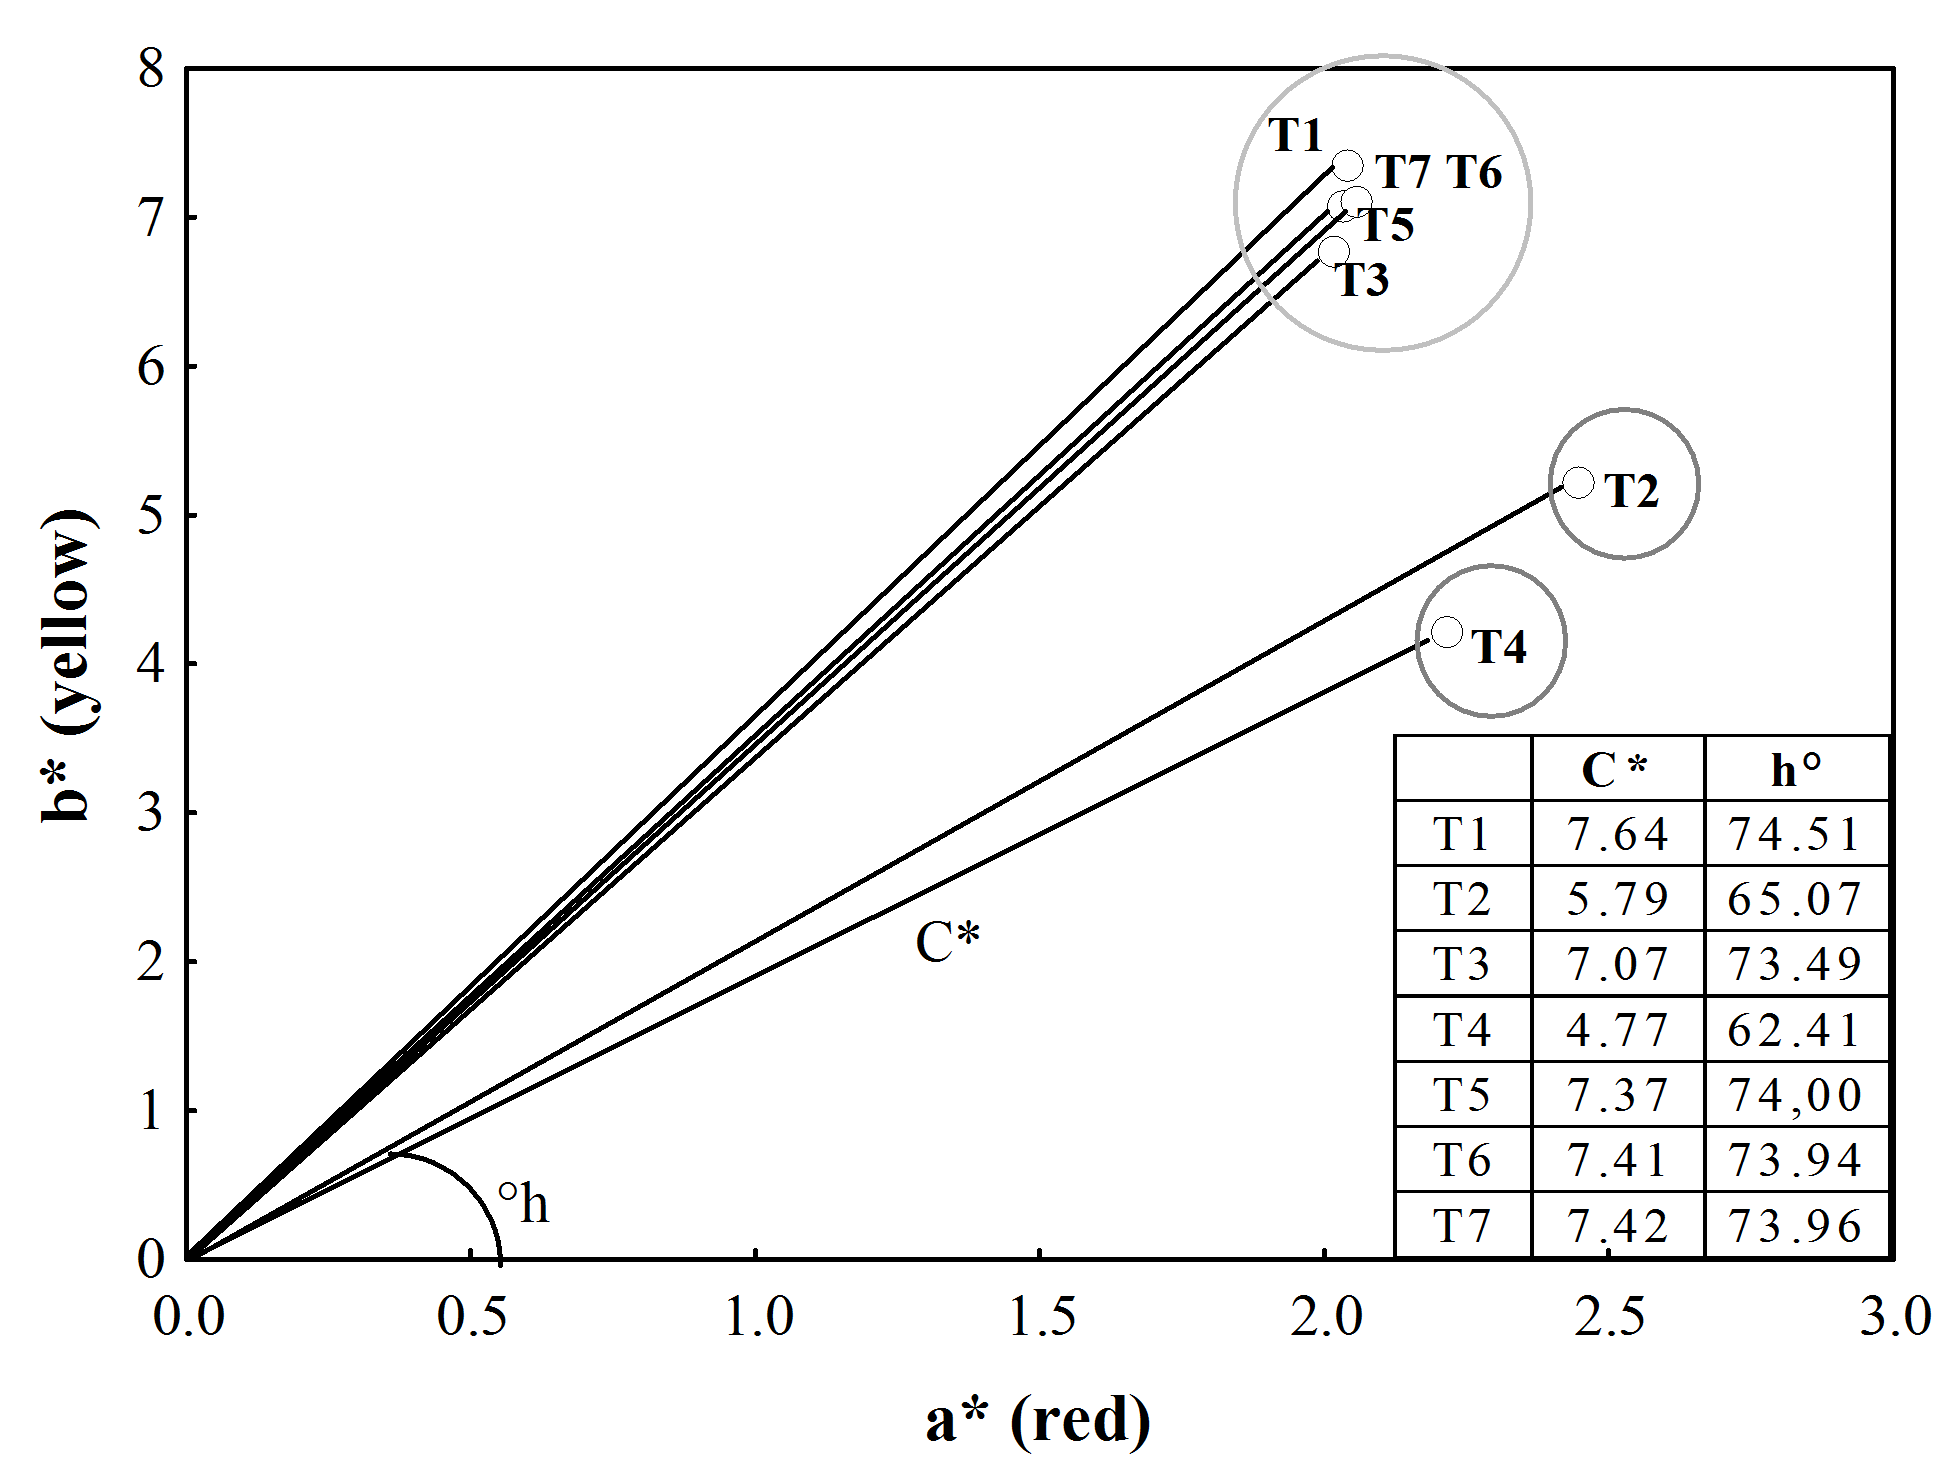
Figure 3.
Color diagram of the dairy beverage from assays 1 to 7.
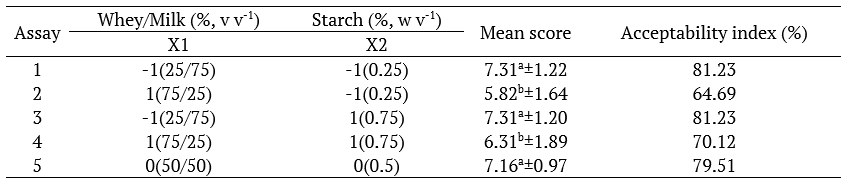
Table 5.
22 Factorial Design Matrix (coded and real values) and sensory analysis responses in average score and acceptability index of dairy beverage formulations.
*Fixed variables: 5 (w v-1) sugar, 0.75 (w v-1) coffee and 0.025% (w v-1) mint extract; Means±standard deviation followed by equal letters/columns indicate no significant difference at the 95% level (Tukey’s test).
Mentha x piperita extracts presented an excellent antioxidant activity, being feasible for their application in foods in order to confer functional characteristics to the product, as well as controlling oxidation and changes in sensory and nutritional characteristics. The beverage presented good sensory acceptance, the 50% whey and 50% milk formulation presented points average of 7.16 and an acceptance incidence of 79.51%, indicating that it is possible to add up to 50% of whey in the formulation.
The authors thanks to Conselho Nacional de Desenvolvimento Científico e Tecnológico (CNPq), Coordenação de Aperfeiçoamento de Pessoal de Nível Superior (Capes – Finance code 001) and Research Support Foundation of the State of Rio Grande do Sul (FAPERGS).
jamilezeni@uricer.edu.br
Table 1.
Independent variables and levels used in the 22 factorial design for the pasteurized dairy beverage preparation.
*Fixed variables: 5 (w v-1) sugar, 0.75 (w v-1) coffee and 0.025% (w v-1) mint extract.
Table 2.
Models and determination coefficient of gallic acid and quercetin standard curves.
*where ‘y’ is the absorbance, and ‘x’ is the concentration in µg mL-1.
Table 3.
Total phenolic, flavonoids and antioxidant activity of M. x piperita extracts.
Means±standard deviation followed by equal letters/columns indicate that there is no significant difference at the level of 95% (Tukey’s test).
Table 4.
Physico-chemical characterization of coffee-flavored dairy beverage for pH, acidity, moisture, protein, ash, lipids, viscosity
s±standard deviation followed by equals letters/columns indicate no significant difference at the 95% level (Tukey’s test).
Figure 1.
Pareto Chart with estimated effects of whey/milk ratio and starch content variables on pH (a), acidity (b), moisture (c), and protein (d) of dairy beverage.
Figure 2.
Contour curves for ash content (a), lipids content (b), viscosity (c) and luminosity (d) of dairy beverage formulated as a function of whey/milk ratio and starch content variables.
Figure 3.
Color diagram of the dairy beverage from assays 1 to 7.
Table 5.
22 Factorial Design Matrix (coded and real values) and sensory analysis responses in average score and acceptability index of dairy beverage formulations.
*Fixed variables: 5 (w v-1) sugar, 0.75 (w v-1) coffee and 0.025% (w v-1) mint extract; Means±standard deviation followed by equal letters/columns indicate no significant difference at the 95% level (Tukey’s test).
