Engenharia Civil
Property value map updating by mass appraisal method – a case in the city of Pato branco, state Paraná
Property value map updating by mass appraisal method – a case in the city of Pato branco, state Paraná
Acta Scientiarum. Technology, vol. 43, 2021
Universidade Estadual de Maringá
Recepción: 27 Julio 2019
Aprobación: 06 Marzo 2020
Abstract: This study addresses Property Value Map updating, specifically when it comes to the absence of methods that allows for efficiency, agility and transparency in estimating property value in Brazilian municipalities. In many cities, the Property Value Map is not being updated due to use of complicated methodologies that require several people and a great amount of time to be applied. For the cities, all properties have a significant importance, since they provide financial resources for city maintenance, considering that the value of the property serves as reference for the Municipal Property Tax and the Property Conveyance Tax to be collected. A failure to update the Property Value Map has been favoring the establishment of a condition of maladjustments in the sphere of public administration concerning property value, as well as tax collection, triggering situations intrinsic to this condition, such as the updating need for promotion of social equity and fair taxation. The present investigation also questions the use of single-family building values, resulting from Mass Appraisal, in substitution of market values, to update the Property Value Map. The modelling was designed through the Regression Method based on variables from appraisal studies in other countries. This procedure will speed up property value updating, bringing about fiscal sustainability and transparency to the Public Administration.
Keywords: property value map, mass appraisal, property value.
Introduction
The updating of the Property Value Map (PVM) is the theme of this study and, for city managers, a major concern. Many public administrations are unaware of the matter, and those that know about it not always give it proper attention. It is usually remembered only in the last months of the year, as it serves as reference for the Brazilian Municipal Property Tax [Imposto Predial e Territorial Urbano] (IPTU) to be charged, which will be collected in the following year.
The PVM is a map that gathers the values of all properties in the city, designed from market data with techniques based on standards and reliable procedures. It is not an easy task, since it comprehends property appraisal; besides, according to Tafoya (2015), the latter has been recognized as a well-established and regimented process.
Because cities are dynamic, changes in the urban landscape may happen and alter areas or spaces, which can influence, for better or worse, the valuation of a property – for instance, improved urban infrastructure through paving, construction of malls, installation of urban equipment, implementation or improvement of public transport, installation of sewage systems, construction of schools or health centers, and others.
According to Melazzo (2015), real estate is deemed as the economic place of valuation of capitals that act on the city and its objects, in a constant and ever-increasing search of its valuation, and it is through a systematic observation of the market that this verification becomes possible.
In a global reality, and taken into account the effectiveness of negotiations and markets, there is an evident momentum in the financial and real estate markets, showing different views as to the importance of valuation and methods that can be applied to the assessment of these assets.
Among the tools that can be used in property appraisal, the PVM is defined by the Brazilian Standard, NBR 14653-2:2011, which states the following in its subitem 3.53: “Property Value Map is the graphic representation or listing of generic values for land or property square meters on the same date” (Associação Brasileira de Normas Técnicas [ABNT], 2011, p. 6).
The instrument in which the city administration records the taxes on properties located in their territory and identifies their owners is the Real Estate Register, which counts with a broad set of information and must be constantly updated, turning said information into essential requirements for property assessments carried out by the public administration in order to adequately reflect market prices. The Real Estate Register is characterized as “The main pillar of real estate taxation, since any market value estimate on the IPTU can be done from registration data” (Afonso, Araujo, & Nóbrega, 2013, p. 46).
Currently, with the availability of technological resources, there is a need for establishing a public-resource management that meets the needs of citizens and society as a whole, and this process fits innovative and accurate methods for property appraisal and PVM updating.
The designing of an efficient Real Estate Register, therefore, requires at least knowledge on techniques, specialization in the process and availability of modern technological resources that support the use of images via satellite to obtain information relating to the georeferencing of the city’s urban area, for territorial changes to be properly monitored (Afonso et al., 2013).
The various difficulties for the procedure of updating property value include the failure to update the Real Estate Register and the lack of methods that facilitate the determination of the market value of urban properties, in addition to the poor qualification of servants and scarcity of financial resources. Thus, it is routine to have real estate appraisal in Brazil being done on the basis of outdated parameters, with a disregard for the dynamic aspects that impact property valuation and impair IPTU collection. These parameters may include matters of political nature and the application of the same values to properties in different city areas, with relevant assessment discrepancies ( Faria Filho, Brito, & Gonçalves, 2017).
Mass appraisals are commonly performed, which are characterized by the development of one or more generic models whose basis consists of a data sample that is applied to those registration data. The models are built from standardized methods and statistical analysis, as well as from other techniques that estimate asset values (De Cesare & Cunha, 2012).
In this process, the Brazilian Multipurpose Land Register [Cadastro Territorial Multifinalitário] (CTM) has been used for locating and describing plots, serving as a tool to aid in property management. The CTM was developed with a great contribution of technological innovation when it comes to space acquisition, storing and visualization, in parallel with the creation of planning policies that meet reality (Sass & Amorim, 2014).
The PVM is not being conveniently updated in many municipalities. This statement finds in the text by Brandão (2015) arguments on the need for updating the PVM as a guideline for setting IPTU values, and on how Direct Actions on Unconstitutionality against laws on MVP revision are showing exorbitant increases, with high percentages, which end up being legally questioned by stakeholders.
Brazil has several cases of municipal governments that have not updated their PVM for longer than a decade, but oftentimes update IPTU values based on the inflation or only using financial indexes (IGPM, IPCA, etc.). And, after a long period, the updating of and consequent rise in property values, without proper explanation, based on the IPTU value, lead to discussions (outrage) on the part of taxpayers, who are not always prepared for new expenses, especially those with greater difficulty to keep their properties.
Low IPTU collection rates in towns with a smaller number of inhabitants derive from different reasons; one of them, however, may be explained by the technological backwardness of public administrations, by difficulties in obtaining resources for investment and, specially, by a historical absence of funding sources in real estate register, in property value maps and its consequent updating, which results in the tax disruption of municipalities, in social injustice, as well as in the collection of tax revenues below the actual potential, which favors noncompliance with article 11 of the Brazilian Fiscal Responsibility Law [Lei de Responsabilidade Fiscal – LRF; Nadolny, 2016).
The establishment of public policies demands information on house values for researchers and formulators as to matters concerning fiscal and infrastructure investments. Property owners also need to have a reliable reference to measure the value of a house when making personal decisions involving, for instance, retirement, consumption, savings and household debt, as elements that dictate public policies (González-Navarro & Quintana-Domeque, 2010).
The CTM and the PVM act alongside social justice and the generation of a document that guarantees this justice, which requires data collection procedures aligned with the CTM and with the social function, using a system with information available to citizens to serve the community, in combination with an engaged management ( Erba, Lima Junior, & Oliveira, 2005).
Although municipal governments do not have their own legislation to update property values for taxation, they can make use of studies on properties, of data contained in their bases, of the CTM, of the Bulletin on Real Estate Technical Register [Boletim de Cadastro Técnico Imobiliário] (BCI), and of other sources of information in order to obtain results that contribute to fiscal management responsibility.
The adoption of an adequate methodology for PVM updating however can provide more accurate information so that irregularities in the public administration can be minimized and/or eliminated, enabling changes in acts involving the approval of real estate registration, by means of a PVM that contains the property assessment method, the flowchart, the valuation calculation, the assessment and analysis methods, ensuring reliability through samples that represent the universe in question.
This proposal will be possible with the construction of a database that represents the surveying of properties, that expresses reliability, data quality, clarity in the variables used for assessment and analysis, monitoring of updated/outdated values, and property reality perception for taxation purposes.
From this perspective, the scientific problem that this research sought to address is guided by the following question: Can a PVM updating method contribute to an approximation to real estate values and speed up service time?
In order to find the answers to the proposed problem, this study attempted to design a PVM updating method, as a tool that can be adapted to the diversities of each municipality and as an alternative for the actual valuation of properties and tax equity.
To do so, the purpose was to assess the surveying of data for appraisal preparation, analyze methods used for calculating property appraisals in cities of other countries, compare the variables of the technical register BCI and those used in the method, propose a data collection form with estimated variables, and compare the method values with the current market values in the technical register, as well as the research sample data with the technical register data.
Material and methods
The research included studies that were successful in estimating real estate values with a large amount of data in cities abroad. Said studies, as presented below, used a number of methods and different types of variables in order to find the best appraisal results for the properties.
Spinney et al. (2011) used average value indexing methods to produce values for lots transacted in the city of Hamilton, located in the province of Ontario, Canada. In China, in 21 provincial cities, Wen and Goodman (2013), using an approach with modeling of simultaneous equations and the two-stage least squares method, analyzed the correlation between land price and habitation price.
To find price indexes for urban lands in Luxemburg, Glumac, Herrera-Gomez, and Licheron (2019) used the spatial Durbin error model; to design a urban land value map for the city of Olsztyn, Poland, Cellmer, Belej, Zrobek, and Kovač (2014) used a combination of hedonic and geostatistical models.
In another study situation, in Washington, DC, and eight jurisdictions in the metropolitan area, Davis, Oliner, Pinto, and Bokka (2017), through surveying in a private database, provide a detailed estimate on the price expansion and contraction cycle of habitation and land.
And as the last research conducted abroad, Morillo, Cepeda, and Martínez-Cuevas (2017), using data collected at the official website of the government and at websites of private companies, carried out spatial analysis studies on registration zoning, with value interpolation for apartments in Las Acácias neighborhood, district of Madrid.
To estimate property values, this study adopted a mass appraisal method, through statistical inferences, applying the multiple linear regression technique. Said technique, which consists of studying the relationship between dependent and independent variables and will identify the value of the property, is founded on the direct comparison method for market data and on the comparison method for costs, item 8.2 of the NBR 14653-2 (ABNT, 2011).
The regression model, as to results, met the specifications, in accordance with the NBR 14653-2, items A.2 and A.2.1, of Annex A of the Basic Assumptions, referring to: linearity (analysis of the dependent-variable charts in relation to each independent variable);
Normality (residuals must have a distribution similar to the normal curve, that is, 68% of residuals located between -1 and +1 s, 90% of residuals located between -1.64 and +1.64 s, and 95% of residuals located between -1.96 and +1.96 s);
Homoscedasticity (analysis of residuals x adjusted values); autocorrelation (graph analysis of residuals), collinearity or multicollinearity (matrix of correlations with values below 80); besides, there should be no influence points or outliers for an unbiased, efficient and consistent assessment.
It is also worth noting that significance tests were run for the model, with the significance not being allowed to exceed 10%, according to item A.3 of the same standard. The explanation power of the model was also measured by its coefficient of determination, which was considered high the closer it was to the unit; however, the whole dataset must be taken into account so that the best situation can be chosen.
The variables were identified according to item 8.2.1.2 of the NBR 14653-2 and classified as dependent, independent, dichotomous, proxy, adjusted codes, and allocation codes. This study, as displayed in Table 1, listed all variables confirmed in research conducted in cities abroad and that can be used for explaining property values.
For the samples to be collected from the sources of information, the following variables were defined: building and lot areas (m2), sale price (R$), address and neighborhood. The other ones displayed in Table 1 served as options to be used for in loco visits, during which the sample was characterized and verified, with some being added after sample collection, since they depended on property documentation, on the City Government register and on owner information. The most representative variables, with the greater availability of information, were selected for use.
According to the NBR 14653-2 (ABNT, 2011) item A.2, Basic Assumptions, micronumerosity must be avoided by using at least an amount of data per variable that is greater than or equal to 10% n, in which n = 3(K+1), with ‘n’ being the number of pieces of data containing the same characteristic, and ‘K’ being the number of independent variables .
The variables were classified and defined after the whole sample was characterized and before the calculations were performed. The variables were tested in the method and, when the calculations were concluded, they had their importance defined and were classified through regression significance analysis, Student’s t.
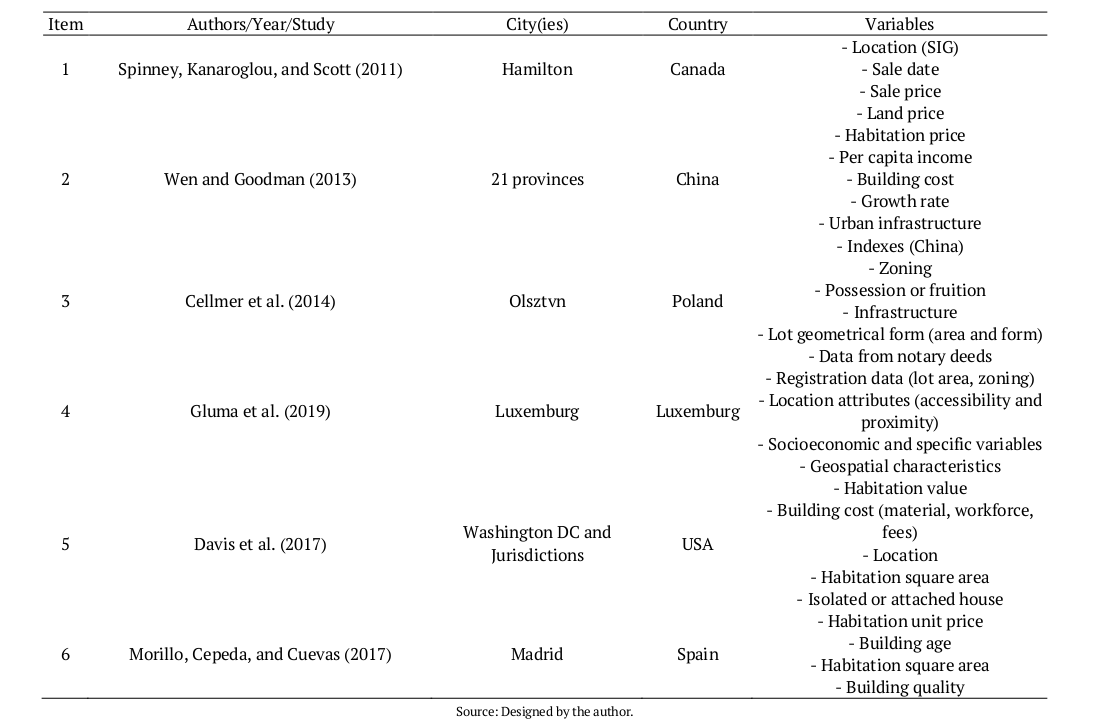
Table 1.
Variables from studies on real estate value.
For data collection, the research was planned according to item 8.2.1.1 of the NBR 14653-2, using available evidence with reliability and no subjectivity. The sources were diversified and identified. At this data collection stage, with the aid of maps provided by the Municipal Government, homogeneous zones were visually identified and spatially delimited. Said zones are composed of neighborhoods with the same characteristics as to zoning and building typologies. For the study area, the following neighborhoods were selected: Bela Vista, Paulo Afonso, Planalto and São Francisco.
For sampling data organization, a spreadsheet with the predetermined initial variables was used, as mentioned earlier. In addition to those variables, there was inclusion of items covering data from the identifying source, research date, and the name of the person responsible for the collection.
The sample was made up of properties offered in the city’s real estate market, located in the homogeneous zone, through website and classified ad search, on-site inspection, and consultation with residents. These data were obtained from reliable sources of information. For collection, and in accordance with item 7.3.5.3 of the NBR 14653-2, there was inspection by sampling to assess the criteria and perceptions considered in the register. Current images or pictures of the façades of the properties were obtained as well, which allowed for a better placement, when the assessment was specified, as to the Degree of Reasoning.
The amount of market data was met, in accordance with item 9.2.1 of the NBR 14653-2, being related to the degree of reasoning; for Degree III, the minimum amount of data is given by the formula 6 (k + 1), in which k is the number of independent variables; to prevent micronumerosity, the data amount (n) must be greater than or equal to 3 (k+1). At this stage, it was important to identify the homogeneous zones, as well as the minimum and maximum habitation and lot areas, using the Data Base of the Municipal Government, in order to reduce errors and model inconsistencies.
The data sourced from the sample collection spreadsheet were compared to the BCI data contained in the Multipurpose Technical Register of the Municipal Government, for verifications and possible updating.
Concerning data treatment, to infer on the behavior of the market in value determination, TS-SIREG was used, a real estate appraisal software. In this phase, in accordance with Annex A, item A.1.4 of the NBR 14653-2, the hypotheses referring to the behaviors of both independent and dependent variables were exposed.
After the modeling data were treated, equation selection and accuracy evaluation were performed in a comparative and evaluative manner from the coefficients of correlation and determination, from the ‘t’ and ‘F’ tests, from the matrix of correlation between variables, and from the residual plots. This equation represents the behavior of the real estate market in the homogeneous zone.
The regression model regarding data treatment met the basic assumptions in the consideration of the results, concerning its specification, in accordance with the NBR 14653-2, items A.2 and A.2.1, of Annex A, Basic Assumptions.
If the model did not fit the NBR assumptions, the inconsistencies would be verified and fixed through a new treatment and data analysis, until an adequate modeling that represented the delimited area was obtained.
Results and discussion
To apply the mass appraisal method, 90 samples offered in the real estate market of the city of Pato Branco, Paraná, were obtained by means of 29 sources of information, including real estate agencies, brokers and owners. The neighborhoods selected were São Francisco, Bela Vista, Paulo Afonso and Planalto.
For the in loco characterization of the samples, the following variables were included: quality (state of conservation, age), building cost (building pattern), location and/or proximity, and geographical coordinates. Because the zones were homogeneous, many variables were not used, such as infrastructure, accessibility, zoning, per capita income, growth rate, and indexes. For a better property identification, photos of the façades and of important aspects in the location were taken to be used in case of doubts, generating a photographic report.
From the entire field research, a spreadsheet was prepared with all selected variables, including the reference of the source of information. From the ‘sale date’, ‘possession or fruition’ and ‘lot form’ variables, no information could be obtained because it was not possible to access the documentation related to the property and the Municipal Government database.
Out of all collected samples, as shown in Figure 1 and 2, Planalto was the neighborhood with the highest number of samples, with 36 units, followed by São Francisco, with 35 units. Bela Vista neighborhood had 9 samples, and Paulo Afonso had 10.
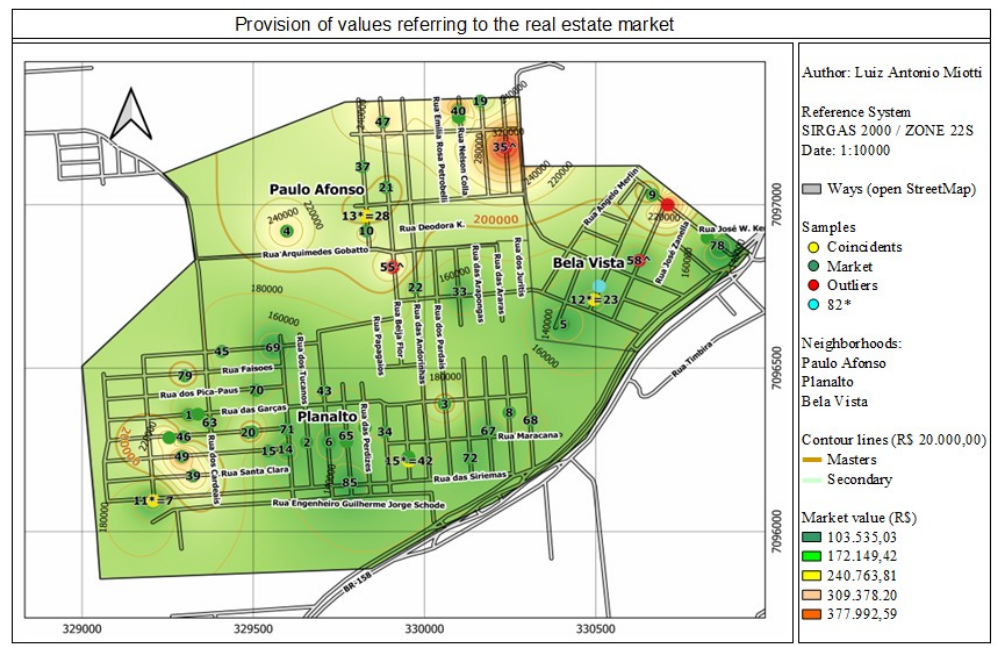
Figure 1.
Spatial representation of samples – Bela Vista, Paulo Afonso and Planalto neighborhoods. Source: Designed by the author.
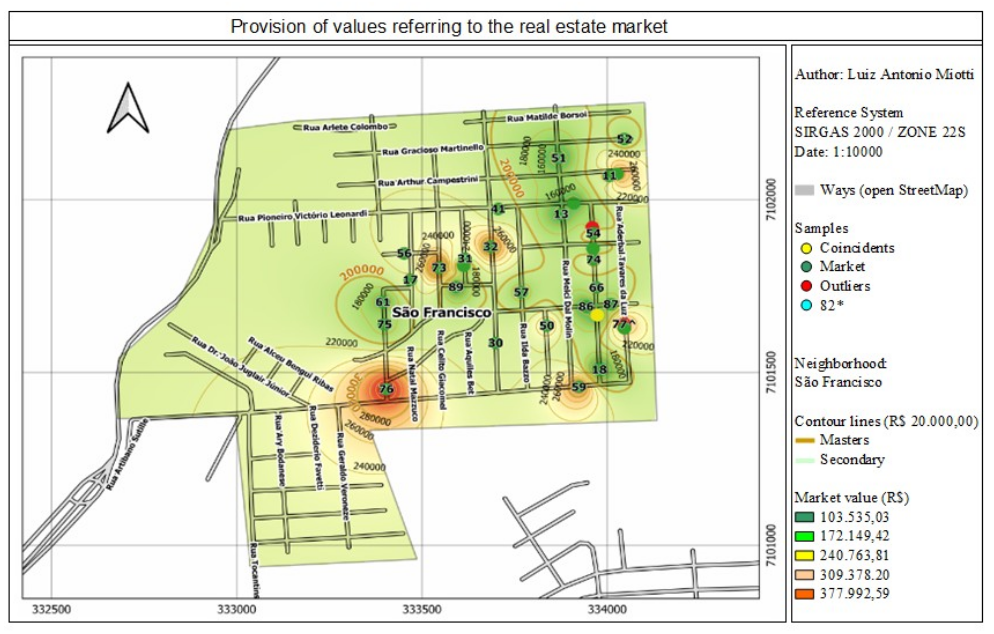
Figure 2.
Spatial representation of samples in São Francisco neighborhood. Source: Designed by the author.
For the Municipal Government register, all data on Paulo Afonso neighborhood is reported together with Planalto data.
The research covered data on houses whose areas ranged from 42.00 to 224.02 m2, while the Register has areas between 20.00 and 375.00 m2. For lot areas, the research included samples with 102.00 to 534.18 m2, whereas the Register had lots measuring 129.00 to 917.00 m2.
As for the calculation, the unit value per square meter (R$ m-2) was used as dependent variable, while all the others were independent ones. This unit value (R$ m-2) was used with a 10% discount for brokerage. House, lot, proximity and pattern were considered quantitative variables. CUB PR values were related to the pattern variable, considering the low, normal and high standards for May 2019.
School location was deemed as an influence point in all neighborhoods and related to the proximity variable as a function of distance. The location variable was defined as dichotomous and based on the average value of the properties, being divided as São Francisco-Paulo Afonso and Planalto-Bela Vista neighborhoods. The geographical coordinates were defined as quantitative. The conservation variable was defined as allocation code and related to need for major repairs, simple repairs or no repairs, and to whether the building was new.
During calculation, using the assessment software, the geographical coordinates, despite their importance, had to be removed for being correlated. The geographical coordinates were used for property plotting and location.
The final result factored in all the other variables, with the most important one being the variable house, followed by lot, location, pattern, conservation and proximity.
The hypotheses for the variables, in their majority, were confirmed, and their description is presented in Table 2.
For the house variable, the unit value growth is negative, that is, the larger the area of the house the lower its value. The lot and pattern variables have a positive growth, that is, the larger the area of the lot and the better the building pattern, the higher the unit value. The location variable has positive growth as well. Growth is also positive for the conservation variable, meaning that, if the house is well conserved, its unit value will rise. As for the proximity variable, it has negative growth in relation to distance, that is, the closer the property is to the influence point the lower its unit value.
The representation of the variables as a function of unit value is displayed in Figure 3.
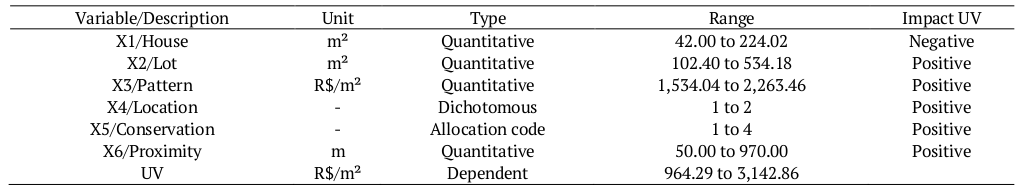
Table 2.
Description of variables.
Software TS-Sisreg.
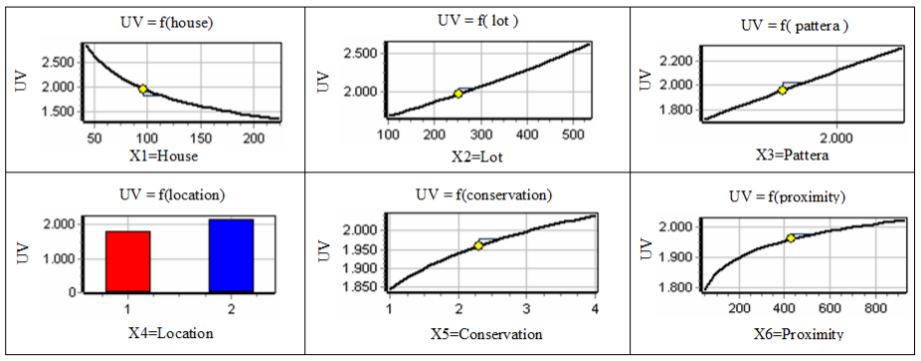
Figure 3.
Representation of the variables as a function of unit value. Source: Software TS-Sisreg.
To come to the best solution, the 7 variables were used, and 84 out of the 90 pieces of data were considered. The linear statistical results for the calculations are represented below; a 0.948 correlation coefficient means strong correlation between dependent and independent variables. The matrix of correlation between these variables is represented in Table 3 as percentage values; an 89.18% adjusted coefficient of determination means that only 10.82% has random explanation; the significance test for the model (Fisher-Snedecor) had its index calculated at 115.05, and 1% significance level.
The adherence of the sampling between observed values and calculated values is presented in Figure 4. The histogram of standardized residuals in relation to the normal curve is displayed in Figure 5, and the distribution of adjusted values X standardized residuals is in Figure 6. For residual normality, the results were: 64% of residuals between -1 and +1 s; 92% of residuals between -1.64 and +1.64 s, and 100% of residuals between -1.96 and +1.96 s, similarly to the normal curve. The final result had no outliers, and no variable had micronumerosity.
The equation for calculating the mass appraisal method that estimated the values of the properties for PVM updating was Equation 1:

(1)
Table 4 brings a description of the independent variables and their parameters, as well as the linear scale, calculated Student’s t, regressor significance, and adjusted coefficient of determination, all resulting from the mathematical model that defined the method.
For comparison between the assessment values sourced through the method and the market value (MV), the Municipal Government Register supplied 15 (fifteen) samples containing address, house area, lot area, and market value. Data relating to the other variables for the calculation were complemented with visits to all sites, and the results found are shown in Figure 7.
For comparison between the assessment values obtained through the method and the real estate market value, as shown in Figure 8, estimates ranged from 1.5 and 8.5%.
For this mass appraisal method to be applied and used comprehensively, access must be possible to all registration data in order to solve doubts, there must be no differences as to data collected from samples and those contained in the Register, and all ranges related to the areas of lots and houses must be covered.
All variables considered in this method, as well as the geographical coordinates, must be included in the BCI and in the processing system of the Register, being specified just as they were in the model. The data for these variables must be updated by means of in loco visits so that information can be verified.
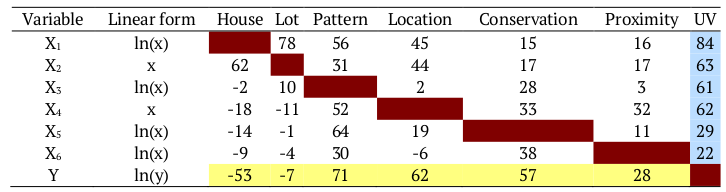
Table 3.
Matrix of correlation between variables.
Software TS-Sisreg.
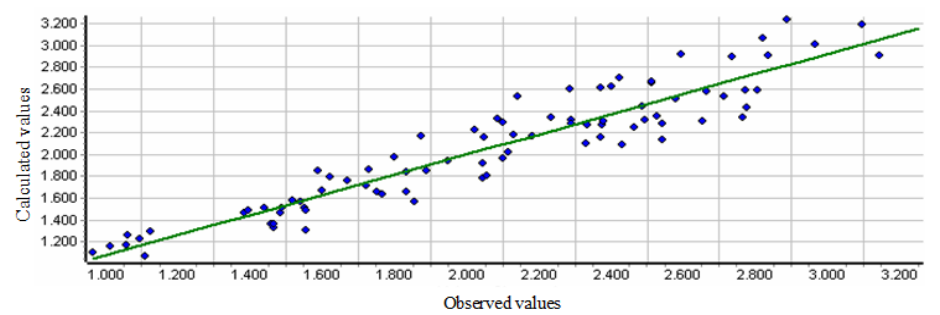
Figure 4.
Adherence between observed value X calculated value. Source: Software TS-Sisreg.
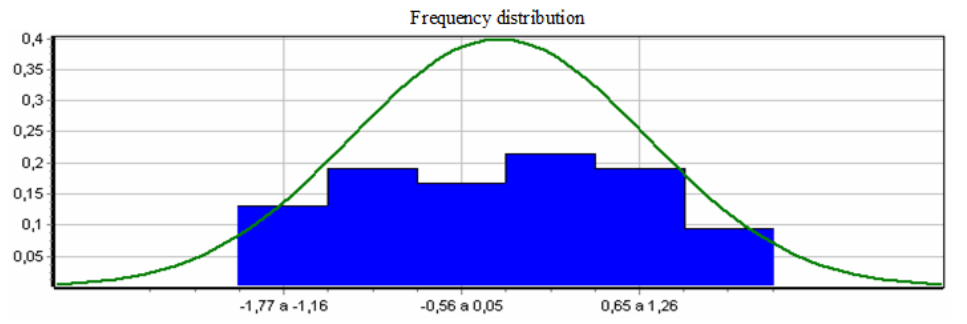
Figure 5
Histogram of standardized residuals X normal curve. Source: Software TS-Sisreg.
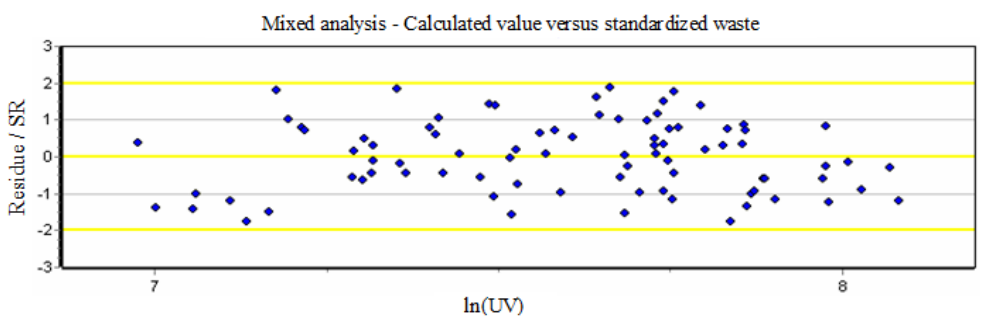
Figure 6.
Distribution of adjusted values X standardized residuals. Source: Software TS-Sisreg.
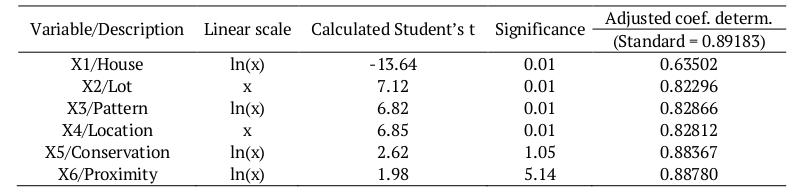
Table 4.
Analysis parameters for independent variables.
Software TS-Sisreg.
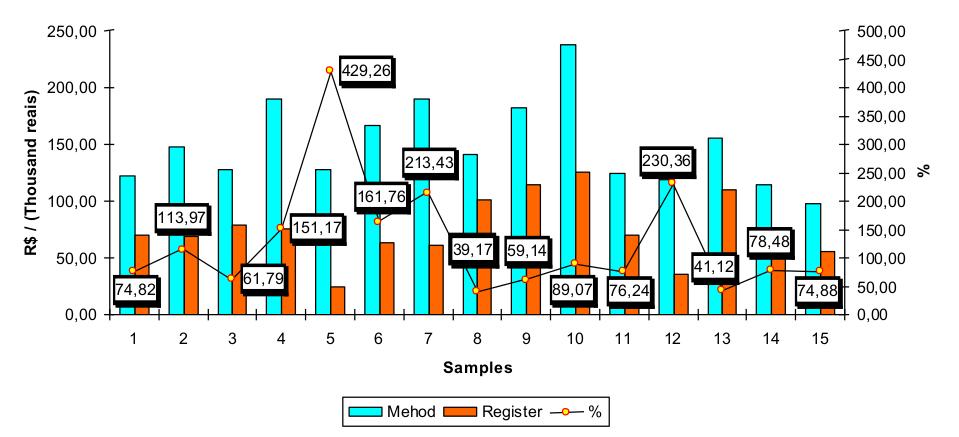
Figure 7.
Values obtained in the method and in the Register. Source: Designed by the author.
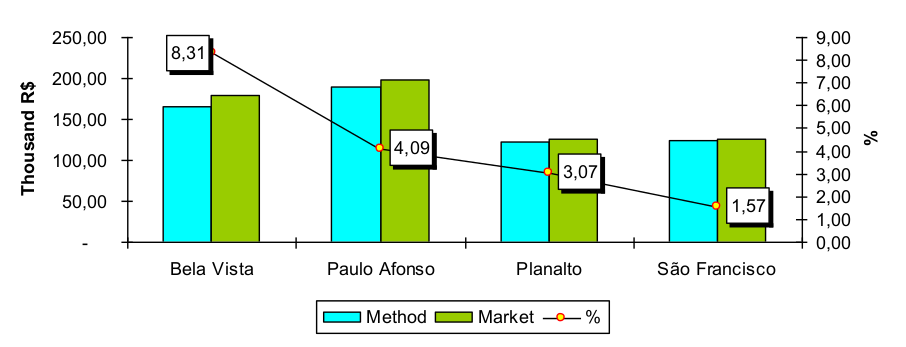
Figure 8.
Percentage of real estate market values and method values. Source: Designed by the author.
This mass appraisal method for updating the PVM originated a mathematical model, through an equation for updating the values of properties in four neighborhoods located in homogeneous zones. This equation must be added to the processing system of the register. With the inclusion of the equation and the updating of the corresponding variables, it is possible to update the values of properties quickly through data processing and, consequently, have a new PVM. These data can be plotted and spatialized with the use of geographical coordinates.
The PVM updating process can reach other homogeneous neighborhood with the addition of new samples. Concerning the other neighborhoods or different groups of neighborhoods, it is possible to have another equation model using the same variables to include new ones, as long as they have good representation for composing the value of the property.
It is worth noting herein that these updated values will serves as bases to IPTU collection. Because the IPTU value is generated by applying a multiplication quota, the latter must be reassessed by the public management aiming at tax equity.
This mass appraisal method must be implemented gradually, after the variables of the Technical Register BCI and of the processing system are adjusted.
The variables must be specified according to the method and updated.
Considering the several locations, other variables can be added to the method.
The sample must have its variables characterized through on-site inspections by a technician in charge or a team with experience in this analysis.
For the spatialization of property appraisal values, a paradigm can be chosen, or the average result value for the application of the method to the properties in a certain neighborhood can be used.
Updating the PVM at the end of every year.
Acquiring an up-to-date image of the city and georeferencing all properties.
Adjusting the data processing system with options for printing results, as well as the representative information that have originated the value.
Conclusion
The evaluation values obtained for updating the Property Value Map, for residences, confirm that the method is efficient and reliable. There is a possibility to change the variables, but the most important was the house variable, followed in descending order, by lot, location, pattern, conservation and proximity. The variation in the values obtained by the method was 1.57 to 8.31% smaller, since the data received statistical treatment and were adjusted, however the estimates of the values to be used for updating were close to the real estate market.
References
Afonso, J. R. R., Araujo, E. A., & Nóbrega, M. A. R. (2013). IPTU no Brasil: um diagnóstico abrangente (vol. 4). Rio de Janeiro, RJ: Fundação Getúlio Vargas.
Associação Brasileira de Normas Técnicas [ABNT]. (2011). NBR 14653-2:2011 de 03.02.2011. Avaliação de bens Parte 2: imóveis urbanos (2 ed.). Rio de Janeiro, RJ: ABNT.
Brandão, R. L. B. (2015). Princípios constitucionais e revisão da planta de valores genéricos do IPTU: a justiça na tributação do IPTU a partir da correta revisão da Planta de Valores Genéricos para fins de IPTU. Jus Navigandi. Recuperado de https://jus.com.br/artigos/45356/principios-constitucionais-e-revisao-da-planta-de-valores-genericos-do-iptu
Cellmer, R., Belej, M., Zrobek, S., & Kovač, M. S. (2014). Urban land value maps: a methodological approach. Geodetski Vestnik, 58(3), 535-551. doi: 10.15292/geodetski-vestnik.2014.03.535-551
Davis, M. A., Oliner, S. D., Pinto, E. J., & Bokka, S. (2017). Residential land values in the Washington, DC metro area: New insights from big data. Regional Science and Urban Economics, 66, 224-246. doi: 10.1016/j.regsciurbeco.2017.06.006
De Cesare, C. M., & Cunha, E. M. P. (2012). Avaliação em massa de imóveis para fins fiscais: discussão, análise e identificação de soluções para problemas e casos práticos. Brasília, DF: Ministério das Cidades.
Erba, D. A., Lima Junior, P. N., Oliveira, F. L. (2005). Cadastro técnico multifinalitário: instrumento de política fiscal e urbana. Rio de Janeiro, RJ: Ministério da Cidade.
Faria Filho, R. F., Brito, J. L. S., & Gonçalves, R. M. L. (2017). Modelos estatísticos para geração de plantas de valores genéricos em áreas urbanas. Gestão & Produção, 24(2), 279-294. doi: 10.1590/0104-530x2482-15
Glumac, B., Herrera-Gomez, M., & Licheron, J. (2019). A hedonic urban land price index. Land Use Policy, 81, 802-812. doi: 10.1016/j.landusepol.2018.11.032
González-Navarro, M., & Quintana-Domeque, C. (2010). Estimación de los valores de las casas en México. Cambridge, MA: Lincoln Institute of Land Policy. Retrivied from https://www.lincolninst.edu/es/publications/articles/estimacion-los-valores-las-casas-en-mexico
Melazzo, E. S. (2015). Interações, combinações e sinergias: produção do espaço urbano, dinâmicas imobiliárias e o programa minha casa minha vida em cidades médias brasileiras. In C. Bellet, E. S. Melazzo, M. E. B. Sposito, & J. M. Llop (Orgs.), Urbanização, produção e consumo em cidades médias/intemediárias (p. 373-396). Presidente Prudente, PR: Universidade Estadual Paulista.
Morillo, M. C., Cepeda, F. G., & Martínez-Cuevas, S. (2017). The application of spatial analysis to cadastral zoning of urban areas: an example in the city of Madrid. Survey Review, 49(353), 83-92. doi: 10.1080/00396265.2015.1113029
Nadolny, M. L. (2016). A importância da planta genérica de valores na tributação municipal. Revista Técnico-Científica do CREA-PR, 4, 1-12.
Sass, G. G., & Amorim, A. (2014). Multipurpose urban cadastre and data temporality. Revista Brasileira de Cartografia, 66/7, 1465-1473.
Spinney, J. E. L., Kanaroglou, P., & Scott, D. M. (2011). Exploring spatial dynamics with land price indexes. Urban Studies, 48(4), 719-735. doi: 10.1177/0042098009360689
Tafoya, J. M. S. (2015). El modelo de valuación inmobiliaria en México. Revista Iberoamericana para la Investigación y el Desarrollo Educativo, 5(10), 1-24.
Wen, H., & Goodman, A. C. (2013). Relationship between urban land price and housing price: evidence from 21 provincial capitals in China. Habitat International, 40, 9-17. doi: 10.1016/j.habitatint.2013.01.004
Notas de autor
miotti@utfpr.edu.br