Engenharia Mecânica
Robust regression analysis for the relationship between welding parameters and microhardness of 410 NiMo martensitic steel deposits on SAE 1020 steel
Robust regression analysis for the relationship between welding parameters and microhardness of 410 NiMo martensitic steel deposits on SAE 1020 steel
Acta Scientiarum. Technology, vol. 43, 2021
Universidade Estadual de Maringá
Recepción: 02 Septiembre 2019
Aprobación: 09 Marzo 2020
Abstract: The objective of this study was to analyze the flux-cored arc welding (FCAW) welding parameters and microhardness levels on surface quality of 410 NiMo martensitic stainless-steel coatings. The parameters of the FCAW process applied to the coating, included pulsation frequency, voltage, welding speed, average current and contact tip to work distance. The welding was carried out by the pulsed tubular wire process with pulsed current, constant voltage, Ar+2% O2 shielding gas and short-circuit metal transfer for the deposition of EC410 NiMo Martensitic Steel Deposits alloy coatings on a SAE 1020 steel substrate. For the statistical analysis, the Taguchi experimental planning was applied to test the influence of the parameters of the FCAW process (average current, CTWD, pulsation current and welding speed) on the coating properties. The best configuration with respect to the increased microhardness of the fusion zone in the coating welding process is: Average Current 200 A; CTWD 40 mm; Pulsation Frequency 26.31 Hz and Welding Speed 300 mm min.-1. The lowest microhardness of the melting zone in the coating welding process is: Average Current 170 A; CTWD 30 mm; Pulsation Frequency 23.26 Hz and Welding Speed 400 mm min.-1.
Keywords: claddings, FCAW, EC410NiMo, fusion zone, statistical models.
Introduction
The welding process with dissimilar metals are suitable for obtaining a surface suitable for wear or corrosion, and during welding there are variations in temperature and plastic deformations in the parts, resulting in changes in microstructure and its mechanical properties. However the welding coating process with stainless steel is defined as the deposition of a layer of stainless steel on carbon steel or low alloy steel surfaces to produce coatings with anti-corrosive properties and necessary strengths to cope with environments subject to wear due to corrosion or cavitation, and the results obtained using welding made this quite attractive according Qiu, Wang, Wu, and Likhachev (2015).
The correct selection of the material to be deposited allows, among other things, to transform waste, disposable elements into recoverable capital goods, to increase strength and to provide surfaces susceptible to wear of desired characteristics and properties and, in general, to increase the efficiency of the process in which the reconstructed and/or protected elements take part. The coating is applied for the recovery and maintenance of parts due to wear, as well as in the construction of components or products in the manufacturing process.
Although the martensitic structure represents an important solution for replacing or adjusting, through deposition, the industrial equipment with high rate of wear and abrasion as reported Szala and Łukasik (2016), it is necessary that these components and equipment are normally constructed with less noble materials, such as carbon steels and then coated with material of excellent general properties.
The FCAW process was used operating in constant voltage, pulsed current and short-circuit metal transfer for the deposition of EC410 NiMo Martensitic Steel Deposits alloy coatings on a SAE 1020 steel substrate. However, this work tried to study the deposits through the weld beads, considering parameters and microhardness already mentioned.
Hardfacing can be applied in the manufacture and restoration of parts with worn surfaces in industrial use. As a result, coating increases the life of a part, extending its life when exposed to heavy and intermittent wear second Digambar and Choudhary (2014) and Shibe and Chawla (2017).
In comparison with conventional methods for analysis and interpretation of parameters and tolerances, the Taguchi method proved to be very important, as it allows for equating the data and ensuring the growth of reliability. The main merits of the Taguchi method are: the perception of the process robustness at the beginning of the process, and the growth of reliability in data tabulation as Maghsoodloo, Ozdemir, Jordan, and Huang (2004).
In welding operation, the number of influential variables related to the process is high and their analyses are laborious and the use of methodologies based on statistical methods, analyzing each variable individually or the interactions are indispensable for the quality of the coating as related Velazquez, Estrada, and Gonzalez (2014).
The aim of this work was to determine which welding variables influenced the microhardness in the welding coating, by means of analysis of the fusion zone, the zone thermally affected and the base metal.
Material and methods
The specimens used in this experiment were SAE 1020 steel with 180x63x12 mm and chemical composition listed in Table 1.
The deposition metal used was a 1.2 mm diameter martensitic stainless-steel tubular wire, classified according to ASME 2007 II, Part C (AWS SFA 5-22) as AWS EC410 NiMo MC and whose chemical composition is presented in Table 2.
The welding was performed using the pulsed tubular wire process with current imposition and the shielding gas was Ar + 2% O2. An electronic welding source was used in the tests as well as a simultaneous current and voltage data acquisition system. A welding cord was performed in each run in the flat position using bench tests comprising a source of welding, a welding turtle and a system module for the acquisition of simultaneous signals with ammeter and voltmeter.
The test specimens were removed from the central region and embedded in bakelite for metallographic preparation, manually sanded (100 to 2000 mesh granulation), polished with 0.3 micron alumina. The macrograph of the weld bead was developed with 4% Nital reagent for 1 min. to reveal the melting zone, the thermally affected zone and the base metal. In microhardness tests, a load of 500 gf was applied for 12 s in a micro durometer (Microtest Model HV 1000).
Two columns of the impressions spaced laterally 0.5 mm apart, with a vertical distance of 0.25 mm between the points measured in each region of the weld (Fusion Zone-FZ, Heat Affected Zone-HAZ and Base Metal-BM), where 5 indentations were made, as illustrated in Figure 1.

Table 1.
Chemical composition of SAE 1020 steel bars.

Table 2.
Chemical composition of addition metal – EC410NiMo MC (ESAB).
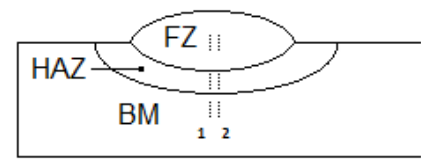
Figure 1.
Schematic representation of microhardness impressions of the welding cords.
Maintaining a constant distance between the welding torch and the piece is important for obtaining a stable arc during electric arc welding, this being a metal, a solid wire or a tubular wire. If this distance varies during welding, a poor-quality welding may occur.
In welding terminology, the distance between the tip of the contact tip and the part in the weld is defined as CTWD, and as it says, it is the distance from the end of the contact tip to the plate or workpiece.
In welding, this distance is the sum of the height of the electric arc with the free length of the electrode, called electric stick-out, or more technically correct, electrical extension. These welding parameters are illustrated in Figure 2.
The gas flow rate was kept constant at 15 L min.-1 ( Ghazvinloo & Honarbakhsh-Raouf, 2010), the peak current at 350 A, the peak time at 8 ms, the positive electrode, the torch angle at 90º, the intercept temperature at 150ºC. Then, it was applied the Taguchi method of experimental planning and Table 3 presents the variables of influence used in the tests.
From the values and levels in Table 3, the Taguchi experimental model (L9) according Pessoa, Miranda, Farias, Aguiar, and Assis Filho (2010) was applied to determine the combinations of the test, which are presented in Table 4, and the sequence of the tests for pulsed current was 6, 1, 5, 9, 4, 3, 2, 7, 8.
After performing the experiments of the Taguchi orthogonal arrangement, the product parameters were optimized taking into account the signal-to-noise ratio. The level of statistical confidence adopted was 95%, as well as a significance level of 5%. The objective was to obtain a statistical model of this relationship with the data collected in the experiment and apply, in this model, optimization techniques to find the values of the optimal parameters of the products second Ganjigatti, Pratihar, and Roy Choudhury (2008).
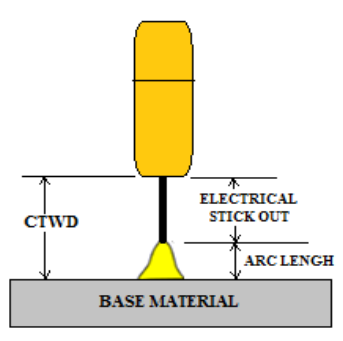
Figure 2.
Difference between CTWD and Stick-out.
Table 3.
Variables of influence on welding and their levels.
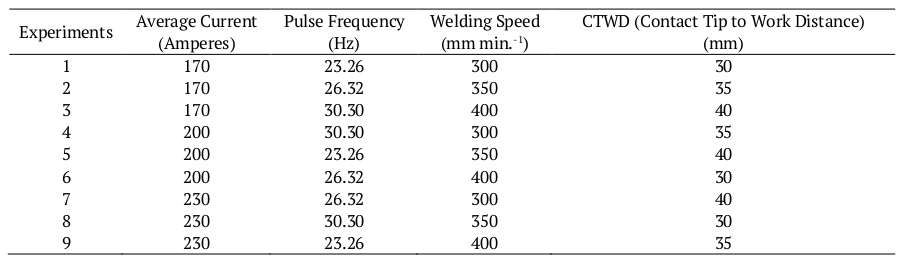
Table 4.
Variables and levels of the experiments.
For this, it is necessary to calculate the signal-to-noise ratio (S/R) where the result can be ‘Greater is Better’ or ‘Smaller is Better’, through Equation 1. This ratio checks which levels of the factors will increase or reduce the hardness of the coating in the welding process.
where:
n - number of repetitions in one test (number of repetitions independent of noise levels),
yi - quality characteristic (observed response).
Once the S/N ratio values for each factor and level have been calculated, it is necessary to calculate the mean effects for the S/R ratio and for the means of each factor. The variation of the factors for the S/R ratio and for the means is calculated by the interval Δ (Delta) defined by Equation 2 and 3, and then ranked from the highest to the lowest value as Gomes, Paiva, Costa, Balestrassi, and Paiva (2013).
The S/N ratio functions as a single measure of robustness and an increase in the S/N ratio reflects an improvement in robustness. This ratio must be related to lower cost, and improved quality characteristics is based on mean squared deviation according Saha and Dhami (2018).
Results and discussions
The average microhardness in the fusion zone was 389.54 HV0.5, in the thermally affected zone, 178.71 HV0.5 and in the base metal, 155.80 HV0.5. The highest standard deviation was observed in the fusion zone (22.924), and this greater variation of hardness, in well-defined areas, is most likely due to the fact that the carbon of the base metal has diffused in the coating, as shown in Figure 3.
More specific and detailed results of microhardness values are illustrated in Figure 4, highlighting the fusion zone with higher microhardness levels, mainly in the outer layer of the coating.
However, for results of microhardness in the fusion zone, Figure 5 showed there are outliers. The experiments CP-01, CP-02, CP-06, CP-08, CP-09 presented similar mean values between the samples. The experiment CP-03 showed the lowest microhardness and the experiments CP-04, CP-05 and CP-07 presented the highest mean of microhardness values, showing graphically that these groups of experiments contained inadequate welding process parameters for the coating as they explain Benyounis, Olabi, and Hashmi (2005). The greater variation of microhardness is possibly due because carbon segregated to the fusion area and diffused to the deposit.
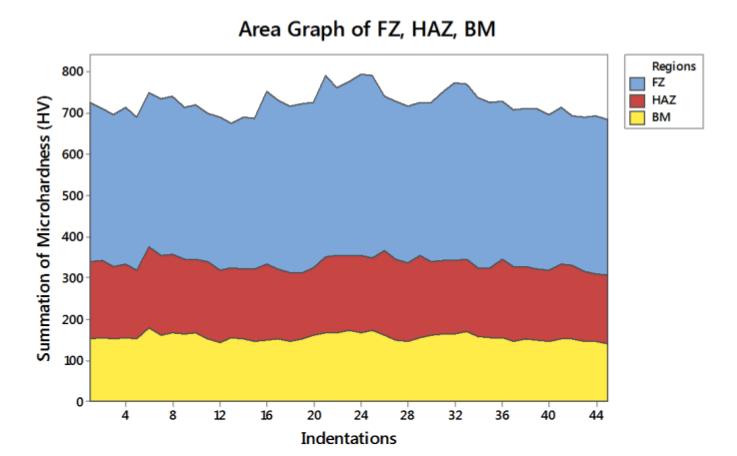
Figure 3.
Representative graph of microhardness values in the regions FZ, HAZ and BM
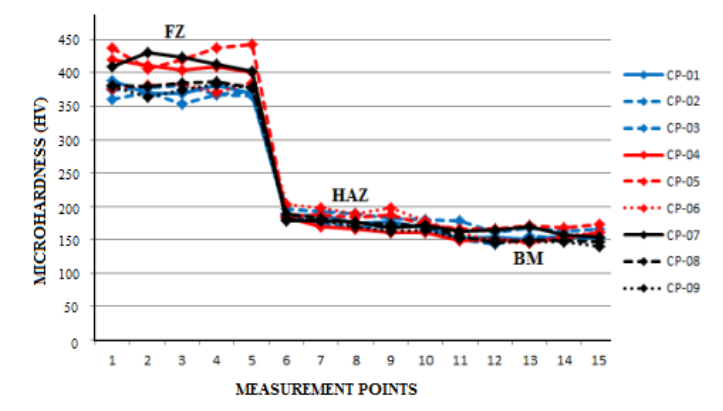
Figure 4.
Values of microhardness determined in the measurements.
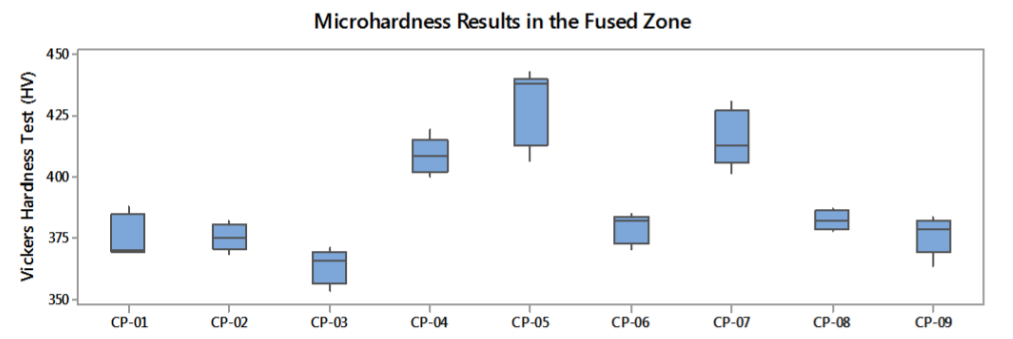
Figure 5.
Box plot of the experiments for the microhardness data in the fusion zone.
The main objective of Robust Regression Model is to indicate whether one group is statistically different from the other or not. Thus, if the null hypothesis is rejected at a certain level of significance, we then know that there is at least one of the means of a treatment that is different from the others as Sathiya, Panneerselvam, and Jaleel (2012).
However, it is suggested that regression can be used to find optimum welding conditions for the desired criteria and also to indicate that the proposed models predict the responses adequately within the limits of welding parameters.
In one-way ANOVA, the F-statistic tests whether the treatment effects are all equal, i.e. that there are no differences among the means of the J groups. A significant F value indicates differences in the means, but it does not indicate where those differences are, e.g. group 1’s mean might be different than group 2’s mean but not different from group 3’s mean (Dutta & Pratihar, 2007).
The analysis of variance was performed with a significance level of 5% in all samples in order to detect differences between mean values. Results of ANOVA (Table 5) evidence that we should reject the hypothesis H0, at a significance level of 5%; we can state by ANOVA with a p value = 0.000 that there is at least one different experiment in the welding ( Ostertagová & Ostertag, 2013). Thus, comparing pairs using the Fisher's method as shown in Table 6 (Grouping Information Using the Fisher LSD Method and 95% Confidence), we concluded that at a 95% confidence, there are 4 different groups of experiments (A, B, C and D). The CP-05 experiment of group A presented higher microhardness in the fusion zone as observed in Table 6.
On the other hand, the CP-05 showed a significant decrease in microhardness at the interface between the fusion zone and heat-affected zone, and also a large difference for CP-03 experiment (with lower values) as seen by the boxplot, due to significant changes in the parameters of these two experiments, for CP-05 (Current = 200 A, Frequency = 26.31 Hz , Welding Speed = 350 mm min.-1) and for CP-03 (Current = 170 A, Frequency = 30,30 Hz, Welding Speed = 400 mm min.-1).
The analysis of the SN effect and averages for the microhardness data of the samples of the fusion zone (higher is better) are presented in Table 7 with the level of variation of each factor.
In this way, it is possible to verify from the S/R, the factor that influences the microhardness values is the average current, followed by the frequency, welding speed and finally the CTWD factor, which is the least important as they explain Shahi and Pandey (2008).
Figure 6 shows the main effects of the S/N ratio on the microhardness of the fusion zone and due to the respective influence variables. We clearly observed that microhardness in the fusion zone increased with the increase in the CTWD and there was an opposite behavior with the increase in the welding speed. In relation to the average current and the pulse frequency, we observed that there was a trend for microhardness growth with the increase in these parameters ( Kumanan, Dhas, & Gowthaman, 2007).
Figure 6 illustrates the average effects on the S/R ratio and the average microhardness, which is the best configuration proposed statistically by the method to maximize the hardness of the coating in the welding process: Average Current = 200 A; CTWD = 40 mm; Pulse Frequency = 26.31 Hz and Welding Speed = 400 mm min.-1.
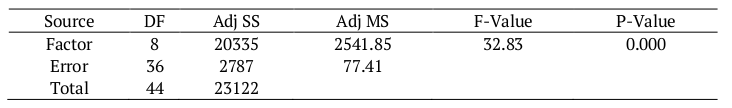
Table 5.
Analysis of Variance of Experiments.
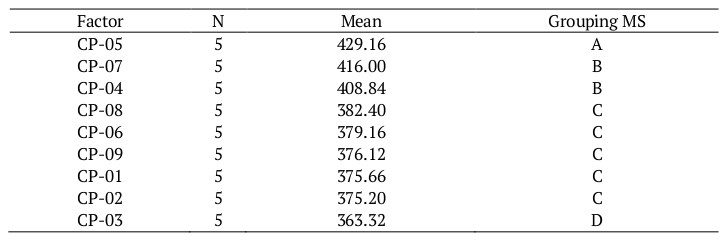
Table 6.
Fisher Pairwise Comparison for values of hardness of the Fusion Zone.
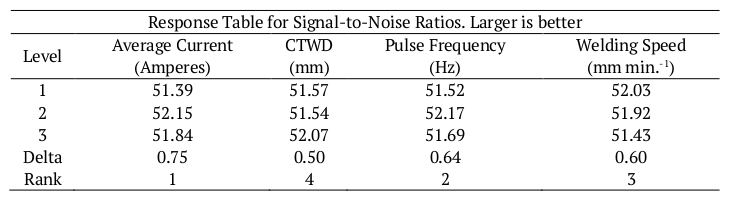
Table 7.
Signal-to-Noise Ratios to Fusion Zone.
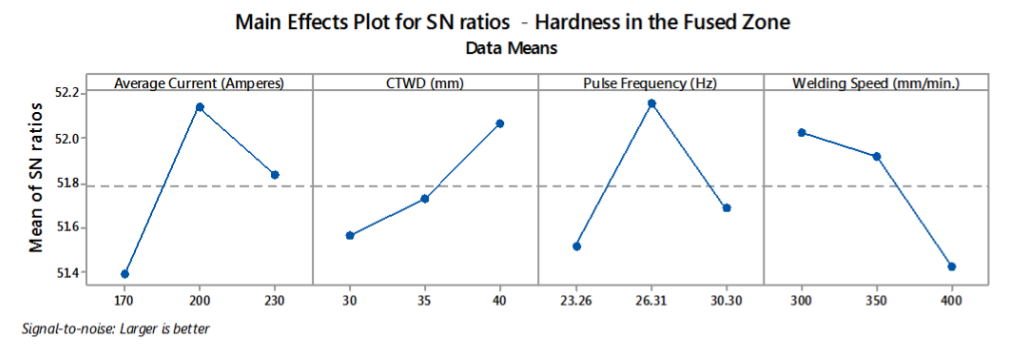
Figure 6.
Effect of the factors on the Signal/Noise in the Fusion Zone.
Certain authors have observed that in the fusion zone, the martensitic phase concentration is increased due the chrome and nickel in the range of 13 Cr to 4% Ni in weight approximately. However, in this deposit, it was observed a stabilization of austenite, which remained present in the structure until cooling to room temperature and dispersed in the martensitic matrix, with a transformation of the martensite into an unstable austenite which, upon cooling, becomes not tempered martensite again (Thibault, Bocher, & Thomas, 2009;Wang, Lu, Xiao, Li, and Li, 2010).
Values of microhardness found here as reported Pradeep, Ramesh, and Prasad (2010) are in accordance with the results of deposits of CA6NM steel with the TIG process obtaining microhardness between 300 and 500 HV0.5, which used the tubular wire and the addition metal, CA6NM steel reached a hardness between 348 and 366 HV0.5, and deposited CA6NM with the MIG process, using as shielding gas Ar+2%O2, obtaining hardness between 300 and 330 HV0.5.
Many other researches present comparisons on the effects of welding parameters on microhardness, especially in the fusion zone according Kurtulmus, Yukler, Bilici, and Catalgol (2015).
Conclusion
The statistical study developed presented high adjustments and can be characterized as a tool of great reliability, since the microhardness results were adjusted by more than 84%, especially in the fusion zone.
The results showed that the four factors measured in the analysis are significant for the study of microhardness in the S/R ratio with a reliability level of 95%.
The lowest hardness of the melting zone in the coating welding process is: Average Current 170A; CTWD 30 mm; Pulsation Frequency 23.26 Hz and Welding Speed 400 mm min.-1, with higher hardness in the fusion zone of the coating.
References
Benyounis, K. Y., Olabi, A. G., & Hashmi, M. S. J. (2005). Effect of laser welding parameters on the heat input and weld-bead profile. Journal of Materials Processing Technology, 164-165, 978-985; doi: 10.1016/j.jmatprotec.2005.02.060
Digambar, B., & Choudhary, D. (2014). A review paper on hardfacing processes, materials, objectives and applications. International Journal of Science and Research (IJSR), 3(6), 2400-2402.
Dutta, P., & Pratihar, D. K. (2007). Modeling of TIG welding process using conventional regression analysis and neural network-based approaches. Journal of Materials Processing Technology, 184(1-3), 56-68. doi: 10.1016/j.jmatprotec.2006.11.004
Ganjigatti, J. P., Pratihar, D. K., & RoyChoudhury, A. (2008). Modeling of the MIG welding process using statistical approaches. International Journal of Advanced Manufacturing Technology, 35,1166-1190. doi: 10.1007/s00170-006-0798-6
Ghazvinloo, H. R., & Honarbakhsh-Raouf, A. (2010). Effect of gas-shielded flux cored arc welding parameters on weld width and tensile properties of weld metal in a low carbon steel. Journal of Applied Sciences, 10, 658-663. doi: 10.3923/jas.2010.658.663
Gomes, J. H. F., Paiva, A. P., Costa, S. C., Balestrassi, P. P., & Paiva, E. J. (2013). Weighted multivariate mean square error for processes optimization: a case study on flux-cored arc welding for stainless steel claddings, European Journal of Operational Research, 226(3), 522-535. doi: 10.1016/j.ejor.2012.11.042
Kumanan, S., Dhas, E. R. J., & Gowthaman, K. (2007). Determination of submerged arc welding process parameter using Taguchi method and regression analysis. Indian Journal of Engineering and Materials Sciences, 14, 177-183.
Kurtulmus, M., Yukler, A. I., Bilici, M. K., & Catalgol, Z. (2015). Effects of welding current and arc voltage on FCAW weld bead geometry. IJRET: International Journal of Research in Engineering and Technology, 4(9), 23-28.
Maghsoodloo, S., Ozdemir, G., Jordan, V., & Huang, C.-H. (2004). Strengths and limitations of Taguchi's contributions to quality, manufacturing, and process engineering. Journal of Manufacturing Systems, 23(2), 73-126. doi: 10.1016/S0278-6125(05)00004-X
Ostertagová, E., & Ostertag, O. (2013). Methodology and application of oneway ANOVA. American Journal of Mechanical Engineering, 1(7), 256-261. doi: 0.12691/ajme-1-7-21
Pessoa, A. R. P., Miranda, H. C., Farias, J. P., Aguiar, W. M., & Assis Filho, F. (2010). Using the Taguchi method to select welding parameters for weld overlay with nickel alloy through the GMAW process. Soldagem & Inspeção, 15(4), 317-324. doi: 10.1590/S0104-92242010000400009
Pradeep, G. R. C., Ramesh, A., & Prasad, B. D. (2010). A review paper on hardfacing processes and materials. International Journal of Engineering Science and Technology, 2(11), 6507-6510.
Qiu, N., Wang, L., Wu, S., & Likhachev, D. S. (2015). Research on cavitation erosion and wear resistance performance of coatings. Engineering Failure Analysis, 55, 208-223. doi: 10.1016/j.engfailanal.2015.06.003
Saha, M., & Dhami, S. S. (2018). Effect of TIG welding parameter of welded joint of stainless steel SS304 by TIG welding. Trends in Mechanical Engineering & Technology, 8(3), 18-27. doi: 10.37591/tmet.v8i3.1433
Sathiya, P., Panneerselvam, K., & Jaleel, M. Y. A. (2012). Optimization of laser welding process parameters for super austenitic stainless steel using artificial neural networks and genetic algorithm. Materials & Design, 36, 490-498. doi: 10.1016/j.matdes.2011.11.028
Shahi, A. S., & Pandey, S. (2008). Modelling of the effects of welding conditions on dilution of stainless steel claddings produced by gas metal arc welding procedures. Journal of Materials Processing Technology, 196(1-3), 339-344. doi: 10.1016/j.jmatprotec.2007.05.060
Shibe, V., & Chawla, V. (2017). Depositing Fe-C-Cr based hardfacing alloys on steel substrate for enhancement in wear resistance. International Journal of Engineering and Technology, 9(3S), 105-111. doi: 10.21817/ijet/2017/v9i3/170903S018
Szala, M., & Łukasik, D. (2016). Cavitation wear of pump impellers. Journal of Technology and Exploitation in Mechanical Engineering, 2(1), 40-44. doi: 10.35784/jteme.337
Thibault, D., Bocher, P., & Thomas, M. (2009). Residual stress and microstructure in welds of 13%Cr–4%Ni martensitic stainless steel. Journal of Materials Processing Technology, 209(4), 2195-2202. doi: 10.1016/j.jmatprotec.2008.05.005
Velazquez, K., Estrada, G., & Gonzalez, A. (2014). Statistical analysis for quality welding process: An aerospace industry case study. Journalof Applied Sciences, 14, 2285-2291. doi: 03923/jas.2014.2285.2291
Wang, P., Lu, S. P., Xiao, N. M., Li, D. Z., & Li, Y. Y. (2010). Effect of delta ferrite on impact properties of low carbon 13Cr–4Ni martensitic stainless steel. Materials Science and Engineering: A, 527(13-14), 3210-3216. doi: 10.1016/j.msea.2010.01.085
Notas de autor
joaosartori@utfpr.edu.br