Estatística
Regression models for binary response applied to data on neonatal deaths in newborns
Regression models for binary response applied to data on neonatal deaths in newborns
Acta Scientiarum. Technology, vol. 43, e45642, 2021
Universidade Estadual de Maringá
Recepción: 03 Diciembre 2018
Aprobación: 04 Abril 2020
Abstract: The present study presents binary data modeling regarding 1.6% of neonatal deaths in 3,448 newborns from an epidemiological and observational study with a cross-sectional design, involving the retrospective analysis of 4,293 medical records of high-risk pregnant women followed in a gestational outpatient clinic from September 2012 to September 2017. Different symmetric and asymmetric link functions were considered by means of Bayesian inference. The support of more accurate inferences regarding the parameters of the model will provide biological interpretations that are more reliable and consistent with the reality. The model that presented, significantly, the lowest value for the deviance information criterion (DIC = 398.8), was the binomial with power logit (PL) link function, whose median posterior value estimated and significant for the parameter asymmetry was l = 0.25 (0.14;1.17). This significance is observed in all other models of the power family, however with very different values and significantly higher DIC values, indicating less parsimonious models. The Bayesian methodology proved to be flexible. Additionally, the results show that such model shows an accuracy = 97.4% and area under the ROC curve AUC = 89.4% in the prediction of neonatal deaths based on the weight of children at birth. Specifically, for 2.500g, a value predicted in the medical literature for low weight, the model predicts a probability of 1.43%.
Keywords: asymmetric link, Bayesian inference; power link.
Introduction
Mathematical models that seek to relate variables from biological events are commonly used in different areas of knowledge for the adjustment of observed data. In particular, regression models with linear or nonlinear predictors, whose parameters provide biological explanations, are of greater interest.
The regression models are associated to probabilistic models, in general, focused on the response variable (dependent). Among the situations of data analysis in which the answers, being dichotomic (success '1' and failure '0'), besides the presence of explanatory (co)variable(s), a binomial regression model is the proper choice. However, the uncritical choice of an appropriate link function may cause differences in the model settings, as well as in decision-making related to the research objective. The method of estimation of the parameters is also an important point to be considered, since each one has its assumptions that allow or not a greater flexibility in the modeling in the data analysis.
In cases where there are differences in the frequencies of 1's and 0's in the response variable, Chen, Dey and Shao (1999) mention that an asymmetric link function is more adequate.
Bazán, Romeo and Rodrigues (2014) present a simulation study considering different sample sizes for dichotomous responses in a regression model whose binding functions were probit and probit asymmetric. The results obtained under the Bayesian approach, evidence the second as the most parsimonious model. Additionally, they present new generalized link functions of these classes considering as probability density function probit (normal/gaussian) power and its reverse probit power. They report in the discussions that they found difficulties in obtaining the parameter estimates by means of frequentist procedures, which justified the use of the Bayesian model.
Achcar, Coelho-Barros and Cordeiro (2013) have already presented generalizations of these distributions in other powers, that is, as special cases of a distribution called beta-normal (Eugene & Famoye, 2002).
Bazán et al. (2014) mention that it is possible to unify these models through the distribution of Kumaraswamy (Cordeiro & Castro, 2011), but do not address the details.
Other authors also present simulations and applications on the subject, including Gupta and Gupta (2008), Bolfarine and Bazán (2010), Kindu and Gupta (2013), Abanto-Valle, Dey and Jiang (2015), Bazán, Torres-Avilés, Suzuki and Louzada (2016), Anyosa (2017), Huayanay, Bazán, Cancho and Dey (2019) and conclude in favor of models with asymmetric link functions for simulations and applications when there is decompensation between 1's and 0's in the response variable.
It is worth mentioning that neonatal deaths are those that occurred from zero to 28 days after birth, the majority considered preventable (Brasil, 2014).
In 2015, in a global context, of the 5.9 million deaths in children under five, 2.7 million (46%) occurred in the neonatal period, causing a great impact on infant mortality (Liu et al, 2016). In the present study, the neonatal mortality rate was 16.2 deaths/1,000 live births (LB), totaling 1.6% of neonatal deaths, which is lower than the overall stillbirth rates in the year considered (19 deaths/1,000 LB) (Pan American Health Organization [PAHO/OMS], 2017).
The objective of the present study was to model data on neonatal deaths in neonates from high-risk gestation, considering different attachment link functions under the Bayesian approach due to their flexibility and, therefore, to promote more accurate inferences regarding the parameters of the model, providing biological interpretations that are more solid and consistent with reality.
Material and methods
In situations of data analysis in which the response Y = (Y1, Y2,..., Yn)', a vector of independent random variables binary (dichotomous), in addition to the presence of explanatory (co)variable(s) represented by a vector of covariates, xi = (xi1, xi2,..., xik)' a
 , a model of binomial regression can be used, such that Yi, is the observed value of the event of interest to the individual i, where i = 1, 2,..., n. Therefore, X will denote a
 design matrix with rows x'i, and
  a k+1 vector of regression coefficients.
Response Y will assume '1' if the event occurred and '0' otherwise, thus the distribution of Y is Bernoulli, in a way that (probability of occurrence),
 ,
, , indicating a model with link function
 (corresponding linear predictor) which represents the probability of occurrence of the event to the individual i, such that
  represents the effects component of the regression model
 , e: vector (k+1) of effects of random errors associated with each observation.
We often want to add covariates to the model by implying estimates of one or more additional parameters. By adding these covariates to the model and 'linking' them to the parameters, a monotonous link function is used, which will relate the parameter q to a linear (predicted linear) function. In the literature it is possible to find several traditional (basic) binding functions, however among the most used for
 and their inverse, in which
 , we have the logit symmetric of the logistic distribution, normal probit (gaussian), cauchy of Cauchy, t-student and double exponential (Albert & Chib, 1993) and the asymmetric ones – Gumbel loglog (cloglog) of minimum value and Gumbel loglog of maximum value. These functions are suitable for the parameters belonging to the interval (0,1). Some of the following are presented below:
logit (L):

probit (P): and
and , where Φ is the distribution function of the standard normal, N(0,1);
cauchy (C): and
and , where F is the distribution function of Cauchy(0,1) ~ t-student(1) and arctg: tangent arc;
cloglog (CLL): and
and ;
;
loglog (LL): and .
and .
Some link functions have been studied and are presented in the recent literature as more parsimonious alternatives in some practical situations (Bazán et al., 2014) and are called power and power reverse family.
If Y follows a power distribution, ,
, ,
, (location parameter)
 , (scale parameter) and
 (shape parameter or asymmetry). The distribution Y has the following probability density function:
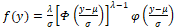 ,
, : cumulative distribution function (c.d.f. ) named base distribution which can be any symmetric or asymmetric c.d.f.;
 : unimodal probability density function (p.d.f.) function, log concave of real support (Anyosa, 2017).
In the case when it e
e , so
, so represents the standard power p.d.f. with c.d.f.
 and therefore, with power link function
As for the reverse power function, it will have c.d.f. given by and therefore, with reverse power link function
All basic functions have their power and reverse power forms and are also interesting alternatives of this family (Bazán et al., 2016).
For Bayesian modeling we considered:


with prior (noninformative) distributions for the parameters – OpenBUGS (Thomas, 2005) – a normal at mean 0 and precision for
for and a Uniform in interval (-2,+2) for
 :
:
 , j = 0, 1, 2, ... , k;
 and
and (Bazán et al., 2014).
Table 1 summarizes all the functions presented here that will be used in the application of the present work.

1Associated distributions - L: logit, P: probit, C: Cauchy, CLL: Gumbel of minimum value, LL: Gumbel of maximum value, PL: Power logit, PP: Power probit, PC: Power Cauchy, PCLL: Power Gumbel minimum value, PLL: Power Gumbel maximum value, RPL: Reverse power logit, RPP: Reverse power probit, RPC: Reverse power Cauchy, RPCLL: Reverse power Gumbel minimum value, RPLL: Reverse power Gumbel maximum value (Adapted from Bazán et al., 2016).
For the application of the presented models, a database from an epidemiological, observational study with a cross-sectional design was used, involving the retrospective analysis of 4,293 pregnant women followed by the high-risk prenatal outpatient clinic linked to a philanthropic hospital and accredited by the Unified Health System (SUS) of the South of Brazil, from September 2012 to September 2017 in the maternity of the referred hospital. A number of 3,448 pregnant women were eligible and composed the population of this study with their respective newborns.
Data collection was performed by a group of researchers from the State University of Maringá (UEM) between November 2016 and October 2017, through analysis of pregnant women's records, maternity birth records and SISREG (Consultation Regulation System of the Ministry of Health) to complement the data of the medical record.
In the modeling, neonatal death information (Y = 1) was considered as a response to a single explanatory variable, the weight (g) of newborns from high-risk pregnancies.
The research complied with the Directives and Norms Regulating Research Involving Humans of the National Health Council (Resolution CNS 466/2012) and was approved with the exemption of the signed Free Informed Consent Term (TCLE), justified by the fact of the use of data under opinion Nº. 2.287.476.
The subsequent posterior marginal distributions for the parameters were obtained through the BRugs package (Thomas, 2005) program R (R Development Core Team, 2020). For each parameter, initial frequentist values (models with basic link functions) were generated and 1,100,000 simulations were generated in an MCMC process (Monte Carlo Markov Chain), with a sample discard of 100,000 initial values. The final sample, taken with jumps of 100, contains 10,000 values generated. The convergence of the chains was verified through the coda package of program R, by the criterion of Heidelberger and Welch (1983).
Bayesian estimates of the parameters in the considered models, such as mean and median (used when asymmetry was observed in the distributions), standard deviation and 95% high probability density (HPD) intervals were obtained.
All computational procedures were performed on a machine with a 3.4 GHz Intel Core i7-3777 processor and 8GB of RAM and the processing time (PT), in minutes, was recorded.
As criteria for the selection of models, the Deviance Information Criterion (DIC – Spiegelhalter, Best, Carlin & Linde (2002)) was used. Lower DIC values indicate more parsimonious models and, for two models considered, A and B, so that , if D <5, it concludes by the equivalence of parsimonies.
Although the DIC is a questioned measure in situations where the posterior distribution estimated is asymmetric in the parameters, since it uses the posterior average in its calculations, it was used for the selection of models even when the distribution of some parameters was asymmetric (Table 2), due to the easiness to obtain the DIC directly through the package used in R.
In addition, the test of adherence to the binomial distribution of Hosmer and Lemeshow (1989) was carried out through the ResourceSelection package of the R program and, for comparison of adjusted models, an evaluation was carried out under the data observed through their respective measures of predictive evaluation (Powers, 2011). For this purpose, the sensitivity, specificity, accuracy, positive predictive value (VPP) and negative predictive value (VPN) were calculated considering the observed prevalence (Huayanay et al., 2019; Lemonte & Bazán, 2018) and, finally, the area under the curve (AUC) ROC (Receiver Operating Characteristic) by means of the Epi package (Carstensen, Plummer, Laara, & Hills, 2020) of program R.
Results and discussion
The results of the Bayesian inferences under the parameters of the models with the linkage functions considered in Table 1, when applied to the neonatal death data as a function of the weight (g) of newborns from gestation of high risk, are presented in Table 2.
After analysis of convergence in the chains and tests of adherence to the binomial distribution of Hosmer-Lemeshow (H-L), we observed in all the models analyzed negative and significant values ( ) for
) for , parameter that influences the rate of increase/decrease in probability of occurrence of the event of interest, death as a function of the weight (g) of newborns.
The PL and PCLL models presented significantly the lowest DIC's (398.8 and 400.7, respectively), however with processing times 48.5 and 75.9 minutes, respectively, leading to the choice of the model with a power logit link function (p-value H-L = 0.998 and therefore a good fit), whose estimated value (median posterior) for the asymmetry parameter was l = 0.25 (0.14;1.17) and therefore significant, since the zero value is not contained in its respective HPD95% range. This characteristic is observed in all other models of the power family, however with very distinct values and higher DIC's values, significantly, in addition to higher processing time (PT).
Bazán et al. (2014) present an application in data from the literature on the occurrence of menarche as a function of age in 3,918 girls. They conclude based on Bayesian models and in the previously mentioned criteria, that the RPP model is the best to represent such association. In addition, the link functions commonly used in the literature are analyzed in addition to the Power logit and its reverse versions, as well as the generalized extreme value (Wang & Dey, 2010).
Bazán et al. (2016) using a sample of 4,000 car insurers, conclude by means of different selection criteria, including the DIC, that a model based on the Cauchy distribution with reverse power Cauchy link function (RPC) was the most parsimonious to predict if a customer hires a complete insurance plan for his or her automobile, depending on the gender, driving area, vehicle use, marital status, age and seniority in the company. According to the authors, such modeling aims to select potential customers of this plan.

1Associated distributions – L: logit, P: probit, C: Cauchy, CLL: Gumbel of minimum value, LL: Gumbel of maximum value, PL: Power logit, PP: Power probit, PC: Power Cauchy, PCLL: Power Gumbel minimum value, PLL: Power Gumbel maximum value, RPL: Reverse power logit, RPP: Reverse power probit, RPC: Reverse power Cauchy, RPCLL: Reverse power Gumbel minimum value, RPLL: Reverse power Gumbel maximum value; 2PT: Processing time (minutes).
Anyosa (2017), in intensive simulation studies developed to study the accuracy and efficiency in the estimated parameters, reports that the binary regression models with power and reverse power link functions are better than those traditionally used, and illustrates them of an application to the educational data on the adequate performance of the spanish language and mathematics students regarding the evaluations of the sixth year of primary education (equivalent to the sixth grade of elementary education in Brazil) of the Peru educational system in 2014. The probabilistic sample contained 13,259 students between 11 and 13 years old. It concludes that the model chosen was the binary regression model RPL and that factors such as school management, school zone, gender and spanish language performance are all important in the analysis of the performance level in mathematics.
All adjusted models show values of accuracy equal to or greater than 97% and, with the exception of the Cauchy model (C), have AUC higher than 83% (Table 3). Specifically, the binomial model with the power logit (PL) with probability estimated given by can 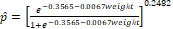 be used to predict if a child born with low birth weight would come to neonatal death with accuracy = 97.3% and area under the ROC curve AUC = 84.5%.

1Associated distributions - L: logit, P: probit, C: Cauchy, CLL: Gumbel of minimum value, LL: Gumbel of maximum value, PL: Power logit, PP: Power probit, PC: Power Cauchy, PCLL: Power Gumbel minimum value, PLL: Power Gumbel maximum value, RPL: Reverse power logit, RPP: Reverse power probit, RPC: Reverse power Cauchy, RPCLL: Reverse power Gumbel minimum value, RPLL: Reverse power Gumbel maximum value; 2VPP and VPN: positive and negative predictive values, respectively, considering the prevalence observed; AUC: area under the ROC curve.
The adjustments (Figure 1) present, respectively, the adjusted curves of the models with basic link power, power and reverse power functions considered. It is easy to observe that from the cut-off point recommended in the medical literature, that is, weight of 2,500g, the probability of neonatal death is practically zero, when Pr(Y = 1|Weight = 2,500g) = 0.0143 (Table 4) which represents 1.43% of neonatal deaths for babies weighing 2,500g. This prevalence in the observed data is 1.60%.
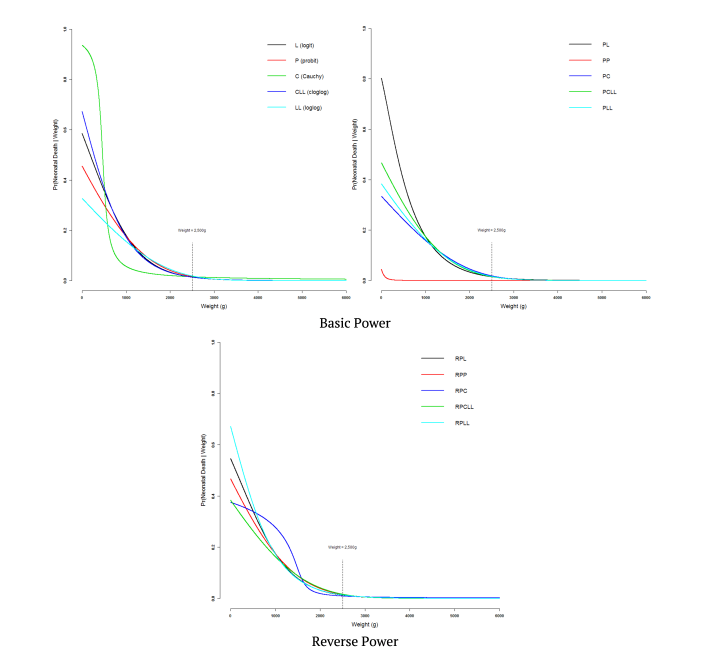
Figure 1. Adjusted curves considering, respectively, models with link functions in the basic, power and reverse power families.
It should be noted that the newborn (NB) is considered to have low birth weight (LBW) when it weighs less than 2,500g and can also be classified as very low birth weight (VLBW), which includes NB's with less than 1,500g, infants with extremely low birth weight (ELBW), which are NB's less than 1,000g (Glass et al., 2015).

1Prevalence sample considering cut-off point 2,500g of 1.60%.
Therefore, the findings of this study show that the lower the weight of the newborn, the greater the probability of neonatal death. Corroborating, a review study between 1986 and 2004, with several large population-based cohort studies, including approximately 14,700 ELBW infants from North America, Western Europe, the United Kingdom, Australia, and Japan, found that ELBW infants present high risk of mortality (30-50%) (Glass et al., 2015).
In In another cohort study on neonatal mortality in the "Birth in Brazil" survey, with interview and evaluation of charts of 23,940 puerperae between 2011 and 2012, it was identified 24,061 LB and 268 neonatal deaths, resulting in a neonatal mortality rate of 11.1 death/1,000 LB and confirming that MBPN represented 59.6% of deaths (Lansky et al., 2014). Based on these findings, a survey of 732 live births and a neonatal mortality rate of 17.7 deaths/1,000 LB, identified in both bivariate analysis and logistic regression, the neonatal death associated with VLBW (36%; OR: 34.1, CI95%: 8.9-475.9, p-value < 0.001) and in LBW (6.7%, OR: 4.5, CI95%: 0.9-18.7, p-value = 0.04) (Demitto, Gravena, Castro, Antunes, & Pelloso, 2017).
It is known that LBW is the most important predictor of neonatal mortality, and is considered the main predictor of neonatal mortality with evidence of greater severity the lesser the newborn weight (Lansky et al., 2014; Demitto et al., 2017). It emphasizes the importance of more effective statistical models in research and possible interventions of health professionals and public policies to minimize neonatal mortality.
Conclusion
The Bayesian methodology proved to be flexible when applying to binary data considering different link functions in the linear predictor. The best (more parsimonious) adjustment to neonatal death data as a function of the weight of children at birth was the binomial model with the power logit link function.
The use of more accurate statistical models can provide professionals in the area with the basis for better decision-making to minimize the occurrence of neonatal deaths.
Acknowledgements
The authors are grateful to the Araucária Foundation - Support for the Scientific and Technological Development of Paraná (FA-PR) for the financial support.
References
Abanto-Valle, C. A., Dey, D. K., & Jiang, X. (2015). Binary state space mixed models with flexible link functions: A case study on deep brain stimulation on attention reaction time. Statistics and Its Interface, 8(2), 187-194. doi: 10.4310/SII.2015.v8.n2.a6
Achcar, J. A., Coelho-Barros, E. A., & Cordeiro, G. M. (2013). Beta generalized distributions and related exponentiated models: A Bayesian approach. Brazilian Journal of Probability and Statistics, 27(1), 1-19. doi: 10.1214/10-BJPS133
Albert, J. H., & Chib, S. (1993). Bayesian analysis of binary and polychotomous response data. Journal of the American Statistical Association, 88(442), 669-679. doi: 10.1080/01621459.1993.10476321
Anyosa, S. A. C. (2017). Regressão binária usando ligações potência e reversa de potência. (Master’s thesis, Universidade de São Paulo). Retrieved from https://bit.ly/3jfLvot
Bazán, J. L., Romeo, J. S., & Rodrigues, J. (2014). Bayesian skew-probit regression for binary response data. Brazilian Journal of Probability and Statistics, 28(4), 467-482. doi: 10.1214/13-BJPS218
Bazán, J. L., Torres-Avilés, F., Suzuki, A. K., & Louzada, F. (2016). Power and reversal power links for binary regressions: An application for motor insurance policyholders. Applied Stochastic Models in Business and Industry, 33(1), 22-34. doi: 10.1002/asmb.2215
Bolfarine, H., & Bazán, J. L. (2010). Bayesian estimation of the logistic positive exponent IRT model. Journal of Educational and Behavioral Statistics, 35(6), 693-713. doi: 10.3102%2F1076998610375834
Brasil. Ministério da Saúde (2014). Atenção à saúde do recém-nascido: Guia para os profissionais de saúde (2nd ed.). Brasília, DF: Ministério da Saúde. Retrieved from https://bit.ly/3od7OP4
Carstensen, B., Plummer, M., Laara, E., & Hills, M. (2020). Epi: A Package for Statistical Analysis in Epidemiology. R package version 2.42. Retrieved from https://CRAN.R-project.org/package=Epi
Chen, M. H., Dey, D. K., & Shao, Q. M. (1999). A new skewed link model for dichotomous quantal response data. Journal of the American Statistical Association, 94(448), 1172-1186. doi: 10.1080/01621459.1999.10473872
Cordeiro, G., & Castro, M. (2011). A new family of generalized distributions. Journal of Statistical Computation and Simulation, 81(7), 883-898. doi: 10.1080/00949650903530745
Demitto, M. O., Gravena, A. A. F., Dell’Agnolo, C. M., Antunes, M. B., & Pelloso, S. M. (2017). Gestação de alto risco e fatores associados ao óbito neonatal. Revista da Escola de Enfermagem da USP, 51, 1-8. doi: 10.1590/S1980-220X2016014703208
Eugene, N., Lee, C., & Famoye, F. (2002). Beta-normal distribution and its applications. Communication and Statistics – Theory and Methods, 31(4), 497-512. doi: 10.1081/STA-120003130
Glass, H. C., Costarino, A. T., Stayer, S. A., Brett, C. M., Cladis, F., & Davis, P. J. (2015). Outcomes for extremely premature infants. Anesthesia & Analgesia, 120(6), 1337-1351. doi: 10.1213%2FANE.0000000000000705
Gupta, R. D., & Gupta, R. C. (2008). Analyzing skewed data by power normal model. Test, 17, 197-210. doi: 10.1007/s11749-006-0030-x
Heidelberger, P., & Welch, P. D. (1983). Simulation run length control in the presence of an initial transient. Operations Research, 31(6), 981-1197. doi: 10.1287/opre.31.6.1109
Hosmer, D. W., & Lemeshow, S. (1989). Applied logistic regression. Hoboken, NJ: John Wiley & Sons.
Huayanay, H. C., Bazán, J. L., Cancho, V. G., & Dey, D. K. (2019). Performance of asymmetric links and correction methods for imbalanced data in binary regression. Journal of Statistical Computation and Simulation, 89(9), 1694-1714. doi: 10.1080/00949655.2019.1593984
Kindu, D., & Gupta, R. D. (2013). Power normal distribution. Statistics, 47(1), 110-125. doi: 10.1080/02331888.2011.568620
Lansky, S., Friche, A. A. L., Silva, A. A. M., Campos, D., Bittencourt, S. D. A., Carvalho, M. L, Frias, P. G., Cavalcante, R. S., & Cunha, A. J. L. A. (2014). Pesquisa Nascer no Brasil: Perfil da mortalidade neonatal e avaliação da assistência à gestante e ao recém-nascido. Cadernos de Saúde Pública, 30 (Pt. 1), 192-207. doi: 10.1590/0102-311X00133213
Lemonte, A. J., & Bazán, J. L. (2018). New links for binary regression: an application to coca cultivation in Peru. Test, 27, 597-617. doi: 10.1007/s11749-017-0563-1
Liu, L., Oza, S., Hogan, D., Chu, Y., Perin, J., Zhu, J., Lawn, J. E., Cousens, S., Mathers, C., & Black, R. E. (2016). Global, regional, and national causes of under-5 mortality in 2000-15: An updated systematic analysis with implications for the Sustainable Development Goals. The Lancet, 388(10.063), 3027-3035. doi: 10.1016%2FS0140-6736(16)31593-8
Pan American Health Organization. (2017, May 17). Quase metade de todas as mortes no mundo tem agora uma causa registrada, mostram dados da OMS. Retrieved from https://bit.ly/35hbkzl
Powers, D. M. W. (2011). Evaluation: From precision, recall and F-Factor to ROC, informedness, markedness & correlation. Journal of Machine Learning Technologies, 2(1), 37-63. Retrieved from https://bit.ly/2TedgmQ
R Development Core Team. (2020). R: A language and environment for statistical computing. R Foundation for Statistical Computing, Vienna, AU. Retrieved from http://www.R-project.org
Spiegelhalter, D. J., Best, N. G., Carlin, B. P., & Linde, A. V. D. (2002). Bayesian measures of model complexity and fit. Journal of the Royal Statistical Society B, 64(4), 583-639. doi: 10.1111/1467-9868.00353
Thomas, A. (2005). OpenBUGS (versão nº x). Retrieved from https://bit.ly/31pYBcA
Wang, X., & Dey, D. K. (2010). Generalized extreme value regression for binary response data: An application to B2B electronic payments system adoption. Annals of Applied Statistics, 4(4), 2000-2023. doi: 10.1214/10-AOAS354
Notas de autor
rmrossi@uem.br