Engenharia Civil
Recepción: 06 Enero 2020
Aprobación: 02 Abril 2020
DOI: https://doi.org/10.4025/actascitechnol.v43i1.51714
Abstract: Hydrosedimentological studies are fundamental for the adequate management of water resources. The Jordão River, the research study area, has the potential to generate electricity to serve a region of the TriânguloMineiro and Alto Paranaíba. In this sense, the understanding of sediment transport resources is important, since it represents a fundamental contribution for ensuring adequate management of water resources in the region. This research study has the general objective of examining sediment transport in the Jordão River, with the aim of obtaining a preliminary understanding into the dynamics of solid particles in this water body. To this end, the determination of the key curves of Flow vs Sediment concentration, the characterization of the sediment granulometry and the hydraulic and geometric aspects of the studied stations, as well as the analysis of the factors that influence the dynamics of sediments in the river, will be carried out. For this purpose, four sampling stations were established, fourteen campaigns were carried out for flow measurements and water and sediment collections for the analysis of suspended and bed sediments in dry and rainy seasons from August 2017 to December 2018. A relationship between suspended sediment concentration and liquid discharge is found in the literature as Css = α·Q., at the four stations on the Jordan River during the measured period, with a value of 14.593 <α <26.904 and 0.6722 <β <0.9462, along with the graph representing all values Css = 22.944·Q0.6991. Noteworthy from the collections carried out is the relationship between rainy and dry seasons, where there is no increase verified in the filming of sediments with the increase in the flow of the river. Regarding the bed solids obtained through granulometric curves, there is a noted deposit of sediments with less granulometry in the dry season, mainly in seasons 3 and 4.
Keywords: sedimentology, sediment load, liquid discharge, Jordão River.
Introduction
In the formation of planet earth, for the emergence of organisms and appearance of the human species, the formation of rocks by the aggregation of minerals and subsequent formation of soils were essential. The rocks exposed on the surface of the earth suffer various actions by chemical, physical and biological agents; this process is called weathering and acts directly on the disintegration of particles and sediment formation.
Erosion, transport and deposition of sediments are natural environmental phenomena that have been intensified and accelerated significantly by human activity (Brito, Asp, Beasley, & Santos, 2009). The irrational actions of man directly affect the balance of nature. Deforestation, pollution, excessive degradation of forest, soil and water intensify environmental impacts in a negative way, causing extensive and even irrevocable damage.
The impromptu and unplanned removal of vegetation leaves the soil unprotected and increases erosion processes by intensifying runoff. Research by Arcova and Cicco (1997) highlighted that the degradation of vegetation and the agricultural use of watershed contribute to intensifying the process of silting up and erosion of the margins of water courses, in addition to compromising or unbalancing the ecosystem, water quality and increasing the sediment transport in rivers.
Continuing within this context, Carvalho (2008), Vanzela, Hernandez and Franco (2010), Cabral and Reis (2015), and Aparecido, Vanzela, Vazquez and Lima (2016), highlighted the influence of land use on the concentration and load of sediments in the water body. The study by Zhang, Liu, Wang, and Wang (2011) obtained results that show that the highest pollution intensity and the lowest vegetation coverage leads to higher sediment loads in the water body, which therefore become an aggravating factor in the problems previously presented.
Among the main factors related to the increase in environmental degradation are the frequent unplanned changes in land use. The lack of planning of the hydrographic basin and the inadequate use of the natural resources generate water contamination and the intensification of erosive processes (Carvalho, Brumatti & Dias 2012).
The lack of soil use and land use planning directly influences sediment dynamics in the watershed, favoring soil erosion and increasing sediment load in the river. After erosion occurs, these sediments arrive in the water body, where they are transported in suspension or through the canal bed until they are deposited.
Sediment transport in a natural river is a transient process due to changes in flow at any time caused by random events. Several models have been developed to estimate the amount of sediment transported in order to obtain a deeper understanding of sediment transport dynamics and the events that influence sediment transport (Wang, Hao, Huo & Zhang, 2008).
Among the various models, in the work of Beling, Paiva and Scapin (2007), the authors evaluated the methods of Meyer Peter and Muller (1948), Einstein (1950), Modified Einstein by Colby and Hembree (1955), Colby (1957), Engelund and Hansen (1967), Yang (1973), Ackers and White (1973), Van Rijn (1984a, b, c), Karim (1998) and Cheng (2002), on a small river in the city of Santa Maria-RS. The methods of Einstein Modified by Colby and Hembree (1955) and Colby (1957), presented the best results between the estimated and measured solid discharge. Despite the different estimation equations, there still does not exist a universal model due to the complexity of the process
Research by Garrido et al. (2018) conducted 15 hydrosedimentometric measurement campaigns to determine the key curve that represents the suspended sediment loads in the Piranhas River, in the state of Paraíba. This type of study assists in the planning and elaboration of multiple use dam projects.
For Cobaner, Unal and Kisi (2009), the study of sediment transport in rivers is very important, as factors such as water pollution, river silting, shortening the useful life of reservoirs, equipment impairment, energy production decrease in hydroelectric plants and loss of navigability among others are some problems that are augmented by this process.
The liquid and solid discharges affect the environmental, economic and social aspects inherent in the population that depends on the natural resources of the basin. Sediments and their problems are currently a major challenge for the management of water resources.
According to the Agência Nacional de Energia Elétrica [ANEEL] (2018), more than 60% of Brazil's annual electricity production comes from hydroelectric sources. In this sense, research related to the subject becomes increasingly important, since electric energy, fundamental to the development of the country, is generated mainly by hydroelectric plants, which present reservoirs that become subject to siltation and turbines and machines prone to abrasion by suspended particles.
The Jordão river watershed, a research study area, is part of this context, presenting potential for generating electricity to supply the Triângulo Mineiro and Alto Paranaíba regions. The main river has almost 100 Km in length, nine axes for the execution of Small Hydroelectric Power Plants, of which four are accepted and five have available axis according to ANEEL information.
In addition to the generation of electrical energy, the understanding of sediment dynamics in the study area is important, since the region presents evidence of erosive processes that affect the environmental quality and especially the sediment load in the water body. Thus, the need to understand the dynamics of solid particles in the watershed is essential for assisting in the more adequate management of soil and water, resulting in improvements in environmental and economic aspects.
Considering the international importance of the subject, the difficulty in understanding the phenomena, the need for studies related to the subject of improving our knowledge of hydrossedimentological behavior, and that the problems caused by the sediments in the watershed represent, at present, a great challenge for the proper management. This research study has the general objective of studying sediment transportation in the Jordão River, with the aim of obtaining a preliminary understanding concerning the dynamics of solid particles in this water body. Accordingly, the determination of the key curves of Flow vs Sediment concentration, the characterization of the sediment granulometry and the hydraulic and geometric aspects of the studied stations, along with the analysis of the factors that influence the dynamics of sediments in the river, will be performed.
Material and methods
Characterization of the study area
The work was carried out in the river basin of the Jordão River located in the triangle of the Triângulo Mineiro and Alto Paranaíba in the Unit of Planning and Management of the Water Resources – high Paranaíba River 1 (UPGRH-PN1), between the geographic coordinates 18°25'41" and 18°50'51"south latitude and 47°49'47" and 48°12'51"west longitude (Salla, Pereira, Alamy Filho, Paula, & Pinheiro, 2013). The area of the basin is approximately 926 km2 and the extension of the main waterway is approximately 90 km from the source to the confluence with the Paranaíba River.
The collection points were defined based on planning and study of the course of the river and the watershed. Initially the area was characterized by obtaining maps elaborated in the QGIS tool. The version used in this study is QGIS 2.18. QGIS is a user friendly Open Source Geographic Information System (GIS) licensed under the GNU General Public License (QGIS Development Team, 2016). Four collection points of water and sediment samples were established. Figure 1 illustrates the location of the Jordão River basin, which is the object of study of this project.
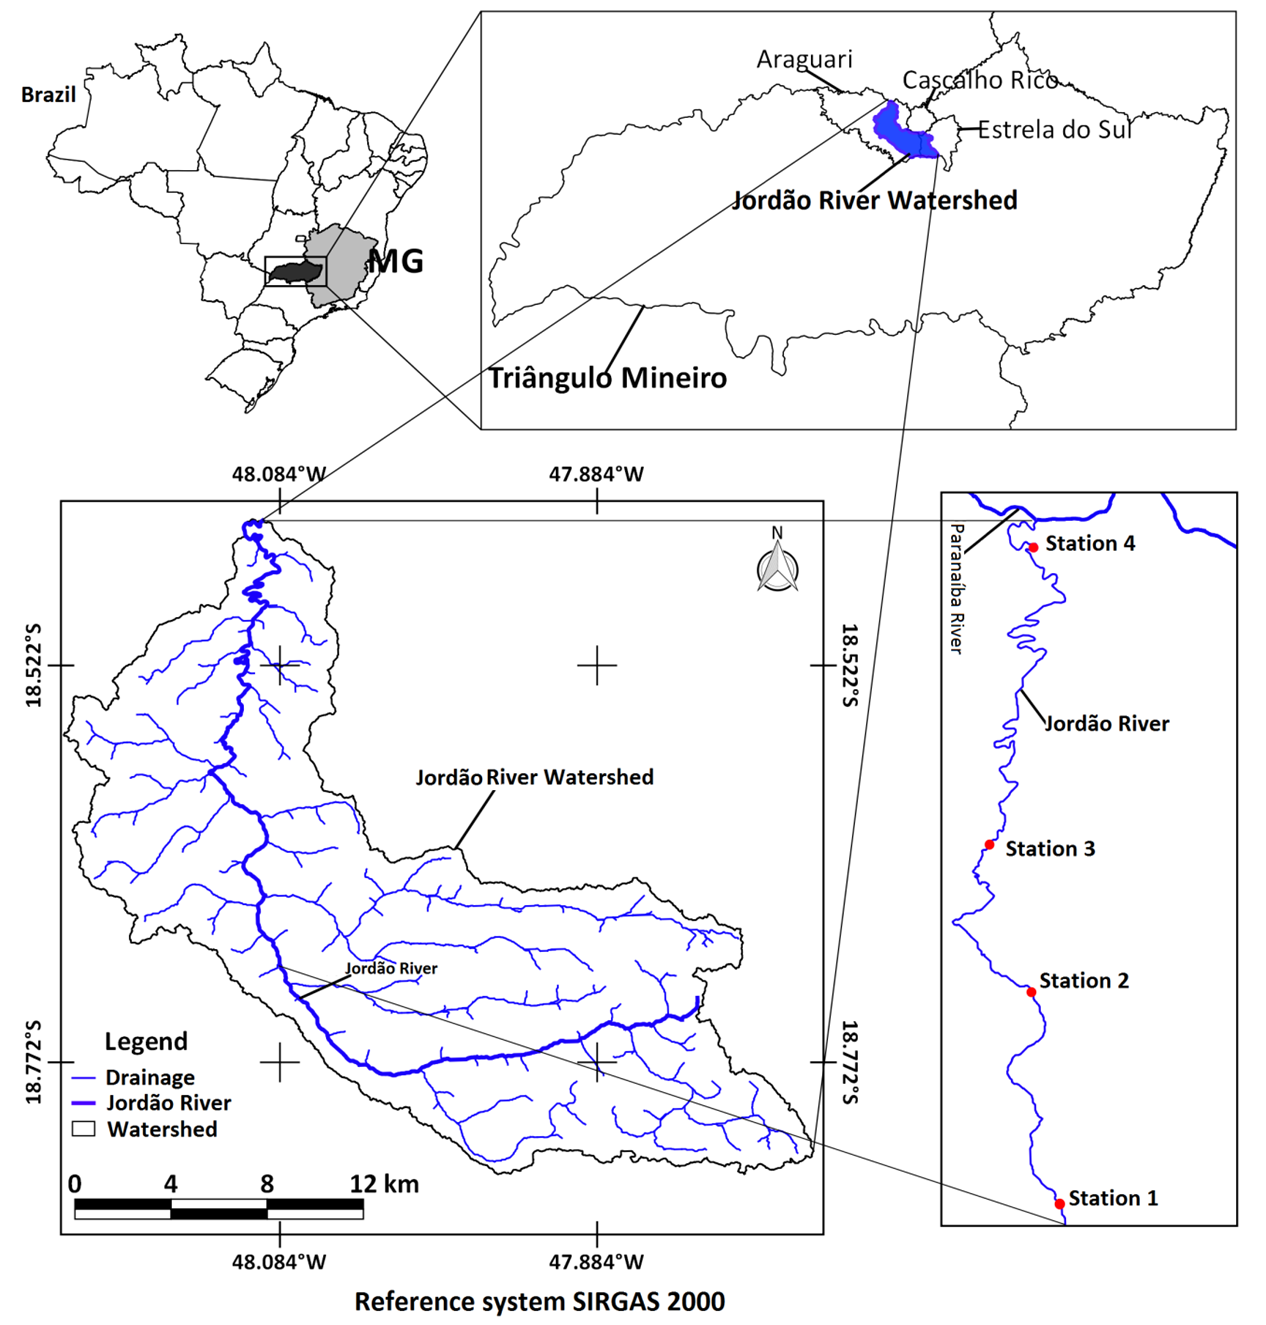
Figure 1. Representative map of the location of the Jordão River basin.
Four Fluoviosedimentometric stations were installed along the course of the river. Among the several tributaries of the River Jordão, the Brejo Alegre Stream stands out for its direct influence on the river; the stream mouth is located between Stations 2 and 3, where it is possible to verify the contribution of this stream in relation to the liquid and solid discharges. Collections were performed at points 1, 2, 3 and 4 and the length of the stretch between points 1 and 4 is approximately 55 Km (Figure 1). Point 4 is close to the mouth of the river, at the confluence of the Paranaíba River. The region under study is characterized by the presence of large agricultural areas, significant amount of pasture areas, as well as vegetation and urbanized patches.
Hydrological and sedimentological monitoring
A total of 14 campaigns were carried out with field activities for measurements and collections in dry and rainy seasons from August 2017 to December 2018. Between these periods there was no field activity in the months of April, June and August of 2018. Flow measurements and water samples for the analysis of suspended sediments were performed from month to month. For bed sediments, three collections and a sieving analysis were carried out throughout the research performed at the four stations. The stations with their respective photos of the sites are represented in Figure 2. Due to access difficulties at station 2, the decision was made to end sampling at that location from March 2018.
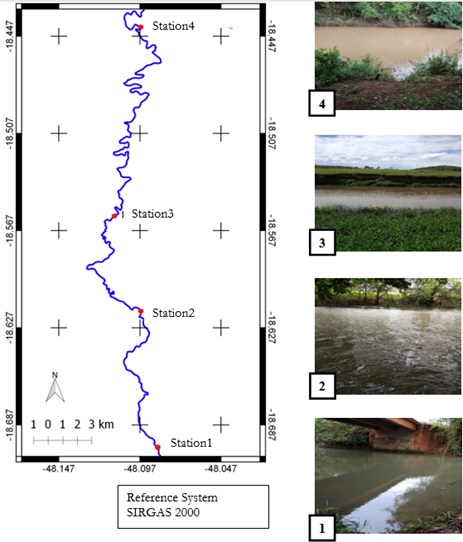
Figure 2. Fluviometric/sedimentological stations and respective images of the sites.
The four sampling stations are located at the following geographical coordinates: Station 1, 18º41'33.02 S and 48º05'39.7 "W, station 2, 18º36'57.19" S and 48º05'46.03 "W, station 3, 18º33'37.94 "S and 48º06'49.58" W and station 4, 18º26 "28.83" S and 48º05'43.99 "W.
The ADCP (Acoustic Doppler Current Profiler) or fluviometric windlass equipment was used to determine the cross section, velocity profile, point velocity and net flow rate of the watercourse. The Doppler effect is the fundamental principle used by the ADCP equipment, which is provided with transducers (emitters and receivers), these are responsible for the emission of sound waves of fixed frequency, which when coming in contact with the particles suspended in the water, these waves are reflected and detected by the transducers the moment the sound comes into contact with the particles. In the present research the flow rates at each section were obtained through field work.
In the field, a rope was tied to the ADCP that was connected to a notebook containing the River Surveyor software provided by the manufacturer. Then, with the aid of the rope, at least three crossings were carried out at each sampled section of the river. In regards to the profile from the bottom meter, the profiles and speed directions were recorded and the flow calculation was performed by the software. The fluviometric windlass was used to measure flow rates on the sections when the water level was below 30 cm and the ADCP was unable to record the flow rate. This device has a dynamic propeller that rotates under the action of river water movement and the number of revolutions of this propeller is registered on an electronic revolution counter. In the procedure performed in the field, a graduated rope was used to perform meter by meter readings with the verticals fixed (forming vertical subareas) along the actual cross section of the watercourse. The distance of 1 meter between the verticals was established according to the width of each section, as recommended by Santos et al. (2001).
The collection of water for analysis of suspended sediment concentration was performed by the indirect method of sampling by equal width increase – IIL (Carvalho, 2008). The procedure was performed with the aid of the North American series integrating sampler (U.S-DH 48). During sampling, the water and air temperature were measured using thermometers.
For sampling, each cross section of the river was divided into segments of equal widths (i) using a graded rope with the selection of 10 to 20 verticals. Samples were collected at the same vertical velocity, obtaining a series of sub-samples with different volumes. In all collections, the same sampler was used with the diameter of the 1/8"collection nozzle.
The analyzes of concentration and granulometry of suspended sediments were performed at the Laboratory of Sanitation (LABSAN) of the Faculty of Civil Engineering, as described by Carvalho, Filizola Júnior, Santos and Lima (2000) in the ANEEL guide for sedimentometric practices. Upon arriving from the field the samples were weighed to avoid errors in the calculations due to the possibility of water loss by evaporation. The sediment concentration analyses were performed by filtration methods in dry seasons with lower concentrations and evaporation in rainy season with higher concentrations. All analyses were performed in the shortest time possible to avoid changes in the characteristics of the samples.
The suspended sediment concentration Css (mg/L) was obtained in Equation 1, establishing the relationship between the mass of the sediment mss (mg) (dry sediment) and the volume of water with the collected sediment V (L).

With the determination of suspended sediments and liquid discharge measurements, the suspended solid discharge of each studied section was calculated. The solid discharge represents the amount of material transported in mass per unit of time according to Equation 2.

In which: Qss: suspended solid discharge (T/day); Q: liquid discharge (m³ / s); Css: Suspended sediment concentration (mg/L).
The particle size analysis on the bed sediment samples was carried out following the Brazilian Association of Technical Standards, ABNT (Associação Brasileira de Normas Técnicas [ABNT], 2016a), in order to identify the particle size or grain size and its distribution as a percentage of each grain diameter. The collected material was taken to the Geotechnical Laboratory and prepared according to ABNT (2016b). In order to determine the grain size distribution of the coarse sediment fraction (particles larger than 2.0 mm in diameter) and fines (particles smaller than 2.0 mm and greater than 0.075 mm), the sieving test was performed.
The apparatus and materials used in the test were: mechanical stirrer with sieves, # 50, # 38, # 25, # 19, # 9.5, # 4.8, # 2.0, # 1, 2, # 0.6, # 0.42, # 0.25, # 0.15 and # 0.075mm, brush with metal bristles, scale, capsules, mortar and greenhouse.
Samples from each collection point were air dried to near hygroscopic moisture. The dried material was de-corroded and homogenized. By quenching, the amount of material was reduced until a representative sample was obtained for performing the assay. For each sample, triplicate tests were performed with about 2.0 Kg of material.
Hydraulic and geometric characterization of the Jordão river
In order to estimate sediment discharge in the Jordão River, it was necessary to obtain hydraulic and geometric parameters of the analyzed sections. The flow (Q), mean velocity (U), mean depth (d), width (L) and the bathymetric top profile of the section were determined in the field. The slope of the water line, roughness coefficient, perimeter, area and hydraulic radius were determined from the River Surveyor program and by calculations with known equations from the literature.
The determination water line slope (S) was performed by the Manning Equation (3). Manning's formula is the most widely used for determining the slope in rivers and canals due to proven results on its validity and the large amount of data derived from the applications.
The roughness coefficient (n) was obtained from the mean of the Strickler formula (1923) changed to D50 and D90 (Equation 4 and 5). To determine the wetted perimeter (Pm), the sections were analyzed from the profiles obtained in the River Surveyor program. The wet area (Am) was obtained by the continuity Equation (6). The hydraulic radius was determined by the ratio of the wet area to the wetted perimeter.

Results and discussion
The hydraulic and geometric data of the sections in each campaign are presented on Tables 1, 2, 3 and 4.
Table 1. Hydraulic and geometric characteristics of station 1.

L: width; d: mean depth; U: average water velocity; Q: flow; Am: Wet area; Pm: Wetted perimeter; Rh: Hydraulic radius; S: slope.
Table 2. Hydraulic and geometric characteristics of station 2.

Table 3. Hydraulic and geometric characteristics of station 3.

Table 4. Hydraulic and geometric characteristics of station 4.

Analyzing all the Hydraulic and Geometric Data Tables, the wide variation in the characteristics of each section studied is evident. The values Q of flow in the river increased significantly in the season of sharp precipitations, which was already expected. In the dry period, the flow rates determined at the different stations were in the range of 0.39 to 5.17 m³ s-1. However, in the rainy months the flow rates were of 2.16 to 16.11 m³ s-1. In addition to the flow, the data of width, depth, hydraulic radius, slope and velocity were used to calculate sediment discharge.
Regarding the mean depth, the lowest values d were identified in section 1, with an average value of 0.4 m. The highest depth values d were obtained in section 3, with an average of 0.8 m. In the rainy season the depths were significantly higher, especially in season 4, where there was a variation of up to 0.7 m.
The highest values U of mean flow velocity were obtained in sections 2 and 4, with a value of 0.5 m s-1. Section 3 presented the lowest flow velocities with a mean of 0.3 m s-1. In the rainy season the velocities increased across all seasons, however, section 2 presented the most significant difference, with an average value 420% higher in the rainy season when compared to the dry season.
Regarding slope, station 3 had the lowest values of S with an average of 0.00003 m/m. However, the highest values of S remained in section 2. This parameter is very important as it directly influences sediment transport in the river.
The characterization of the granulometry of bed sediments was essential for the understanding of the granulometric distribution of the particles in the river. Figure 3 shows the grain size curves of the stations.
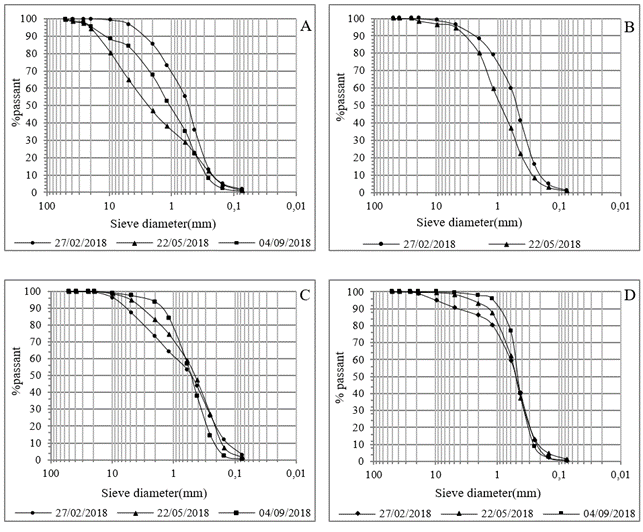
Figure 3. Granulometric curves of the bed material: A) Station 1; B) Station 2; C) Station 3; D) Station 4.
Analyzing particle size curves over the sections, it becomes evident that the bed particles in the Jordão River are basically composed of sand and gravel. In the comparison of the graphs, one notes that there is a tendency toward a decrease in particle size of the bed material in the sections downstream of the river. This occurs due to the transport of the fine particles from the high course to the low course of the river. Research by Brigante and Espíndola (2003) also confirmed this fact in their research work.
According to Brigante and Espíndola (2003), the turbulence provoked by the flow of water in the upper reaches of the rivers has a velocity capable of suspending the finer fractions of the sediment, transporting these along the course of the river towards the mouth. Thus, the tendency is that the sites closest to the river mouth have background sediments with smaller particles than the upstream sites. This fact is evidenced in the Jordão River, when station 1, upstream, is compared to station 4, near the mouth, it is clear that the bottom material of section 4 is composed of finer particles.
A well-known and widely used correlation, which can be called the sediment key curve, is that plotted using the suspended sediment concentration as a function of the liquid discharge. Thus, from the data obtained in the field and by the laboratory analyses, one could obtain the correlation between these variables, as shown in Figure 4.
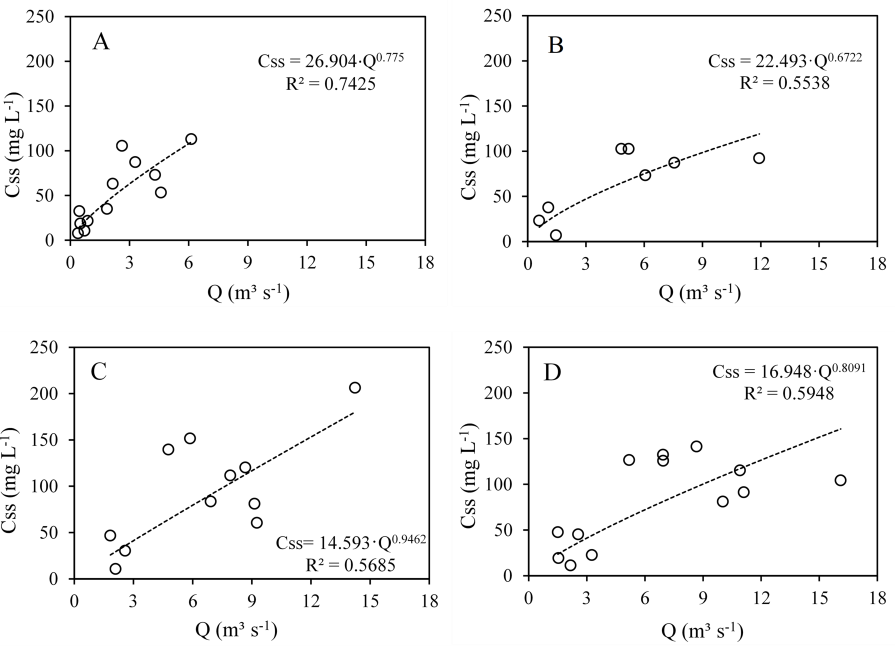
Figure 4. Correlation between sediment concentration and flow: A) Station 1; B) Station 2; C) Station 3; D) Station 4.
The adjustments of the concentration curves of each station had R² greater than 0.55. The best correlation between flow and sediment concentration data was obtained at station 1, with determination coefficient equal to 0.7425, while the worst correlation was found in section 2, with R² of 0.5538. The concentration data in all sections were pooled to assess the overall distribution of the results. A fairly similar distribution was obtained when each station was analyzed separately. Thus, the key curves of the Jordão River sediment concentrations were adjusted, as shown in Figure 5.
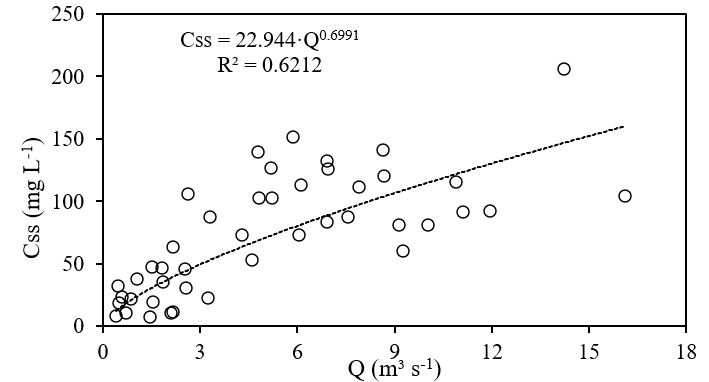
Figure 5. Correlation between sediment concentration and flow of the Jordão River.
The adjustment of the sediment concentration curve in suspension and flow for all sections of the river presented a determination coefficient of 0.6212 with adjustment parameters equal to 22.944 and 0.6991. Other authors obtained smaller determination coefficient values.
According to Glysson (1987) and Carvalho (2008), several factors can influence the tracing of the sediment key curves, those being the main derivatives of the seasonal variation, the time between the peak flow and the solid discharge or concentration, along with the extreme events of floods. This is well represented in the manuscript of Garrido et al. (2018). In this research, the data obtained show that the peak time between flow and concentration or suspended solid discharge and discharge, directly affects the coefficient of determination of the key curve. In periods of extreme floods, sediment production can be quite high, negatively affecting the correlation of the key curve.
The variation of the sediment concentration in each section and mainly between the different sampling periods is influenced by the different use and occupation of the soil in the river basin.
Discharge and concentration curves over time are shown in Figures 6, 7, 8 and 9.
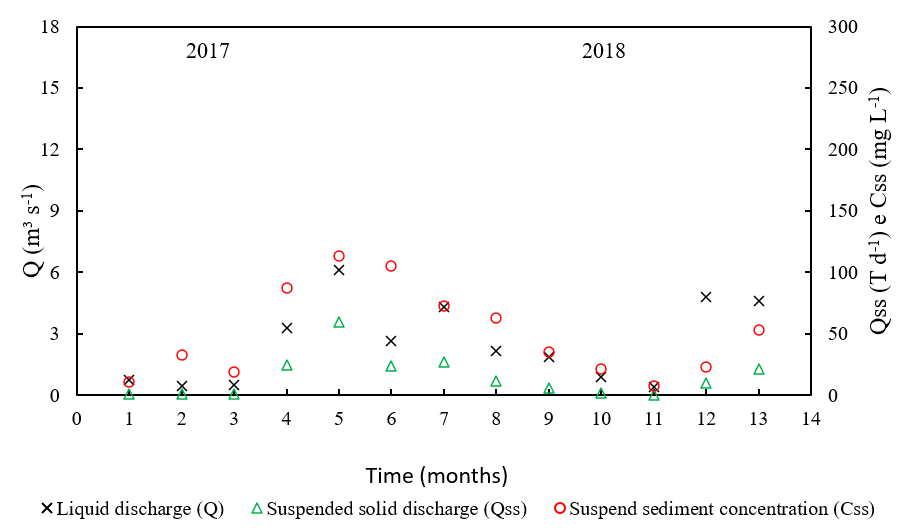
Figure 6. Liquid discharge, sediment concentration and solid discharge over time at station 1
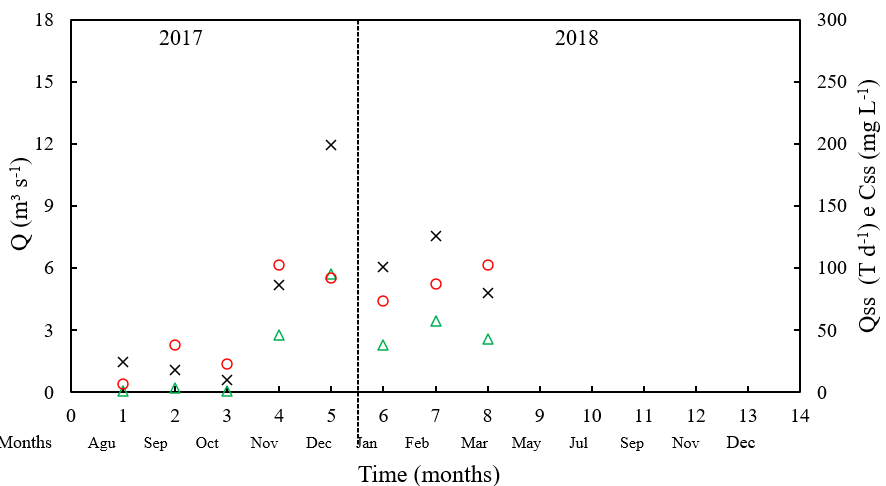
Figure 7. Liquid discharge, sedimentconcentration and solid discharge over time at station 2
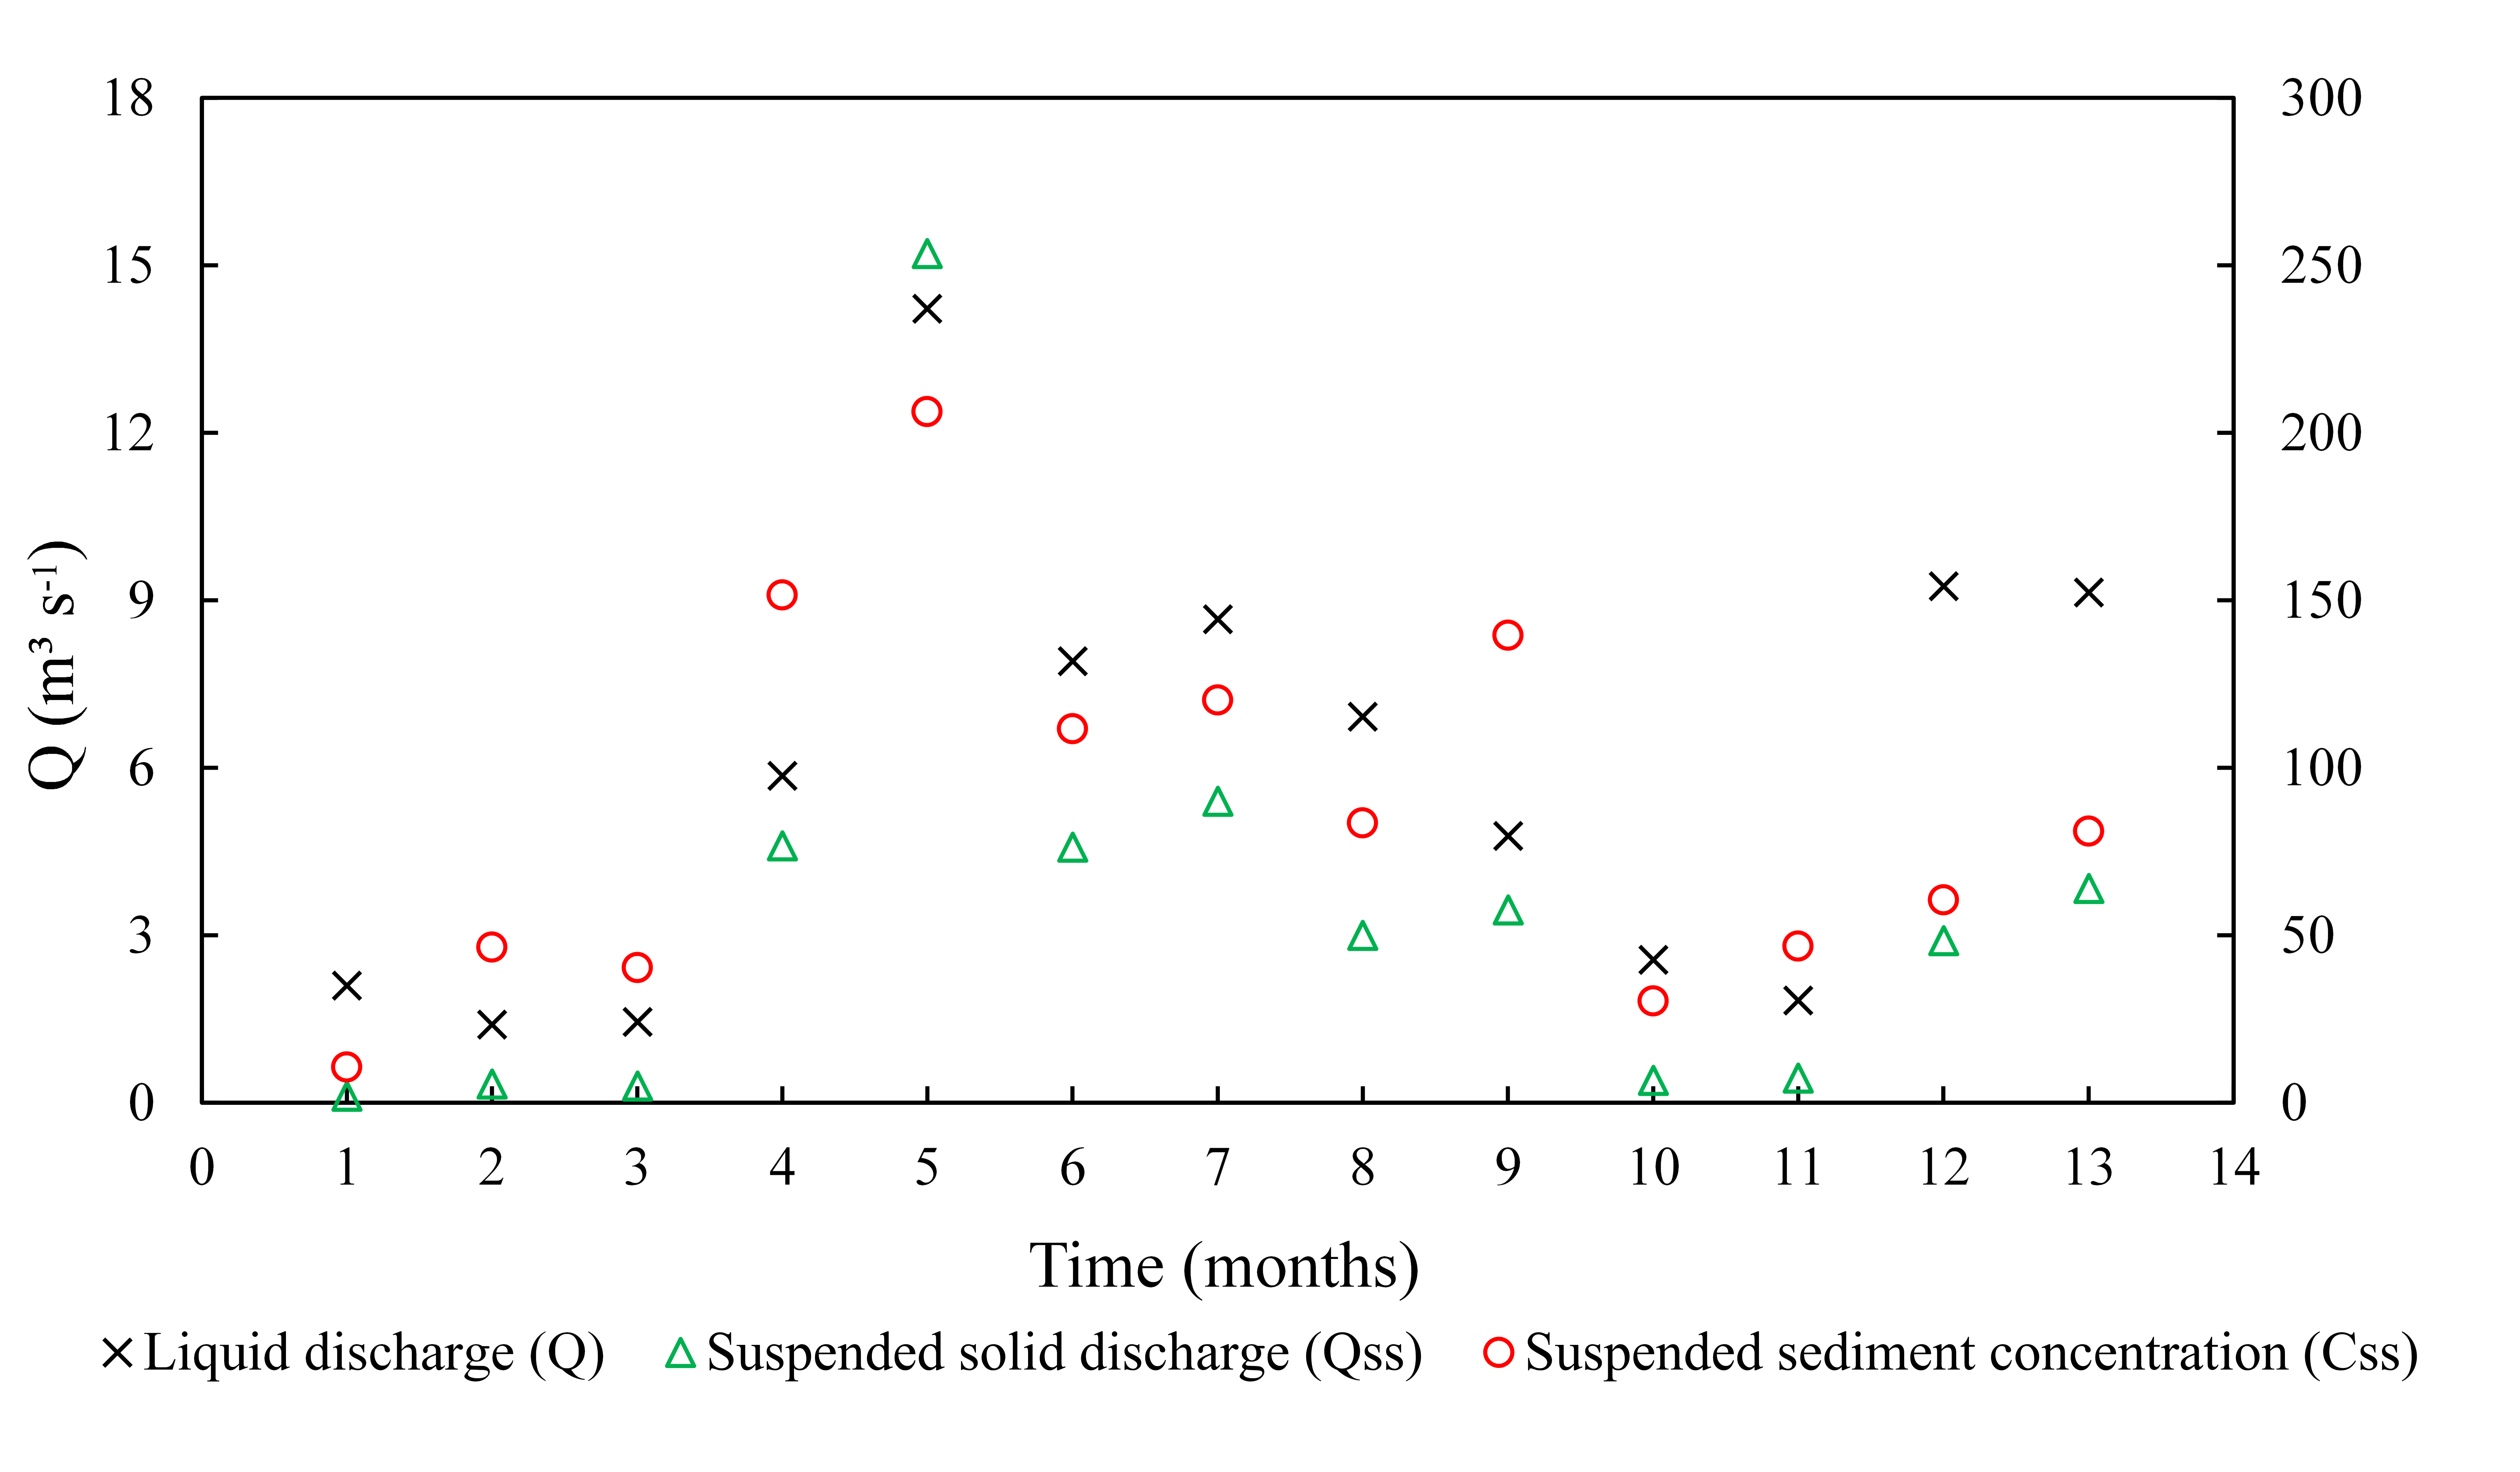
Figure 8. Liquid discharge, sedimentconcentration and solid discharge over time at station 3.
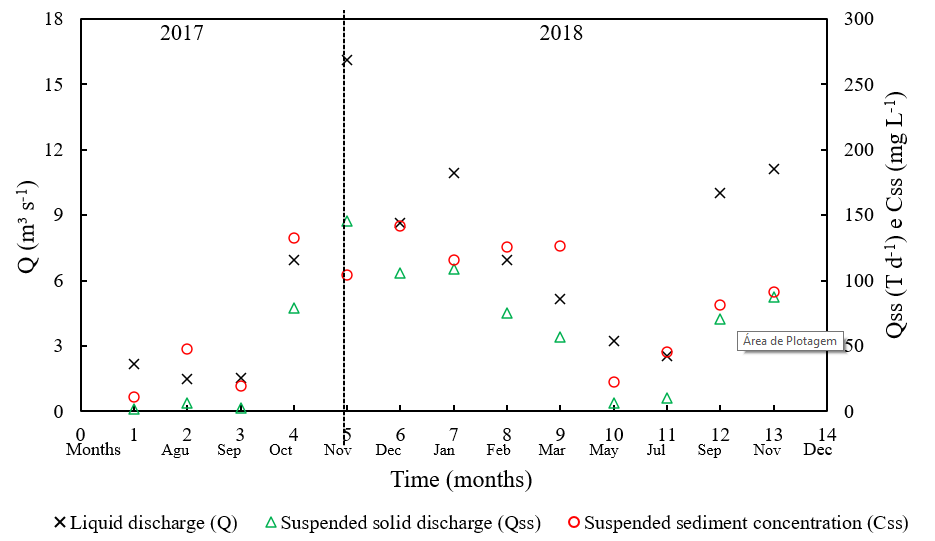
Figure 9. Liquid discharge, sediment concentration and solid discharge over time at station 4
By analyzing graphs for sediment discharge, concentration and liquid discharge over time, one notes that the highest intensity peaks occur mainly in the period with higher rainfall, as is the case in December. In the dry months, such as September, there is a marked decrease in flow, a concentration and a suspended solid discharge.
Noteworthy from the hydraulic and geometric parameters of the sections, (Table 1 to 4), is that conclusions can be reached on some important correlations with the data for flow, concentration and suspended solid discharge. Station 3, for example, had the highest sediment concentration values, especially in the rainy periods. This is a consequence of the increase in the turbulent flow regime, which facilitates the resuspension of particles that were deposited in large quantities on the river bed. This region presents a high accumulation of bed sediments due mainly to the low slope and consequently the small flow velocities. Even in this season, it is interesting to note that the average hydraulic radius value is higher than the other sections, showing the tendency of this region to present a greater wet area when compared to other stations, thus configuring a flow that interferes less in the background particles and therefore has less influence on the transport of these particles.
In stations 1 and 2, steep slopes and flow velocities are observed, with lower mean hydraulic radius values. In these stations, the finer particles, in particular, are greatly influenced by the flow forces causing the transport of these particles to lower regions, promoting an increase in the bottom sediment load at stations 3 and 4.
Suspended sediment discharge and discharge lines are similar across all seasons and the periods of these variables coincide most months. Regarding changes and leaks these do not show the same characteristics, since there is great variation between lines, and the numbers coincide for only a few months. In section 4, for example, a concentration line shows high intensity peaks in November 2017, January, and May 2018, while the peak leakage intensity peak is displayed only in December 2017.
According to Glysson (1987) and Carvalho (2008), the time between peak sediment concentration and peak leakage can dramatically affect sediment curves due to a large number of dispersion points. Therefore, as shown in the result graphs, a variation in the times of the directly affected peaks or in the key settings, as the peaks in times seem to be the case of sediment leakage and discharge produced by coefficient methods larger than what occur for leakage and concentration that showed peaks at different times, thus evidencing the statement made by the author.
Conclusion
The hydraulic and geometric characteristics obtained between August 2017 and December 2018 in the Jordão River showed variations between the seasons and the sampling periods. Flow in the river increased significantly during high precipitation. Stations 2 and 4 had the highest flow velocities, while station 3 presented the lowest values of velocity and mean slope.
The granulometric characterization of the bed sediments was essential for understanding the distribution of the particles on the bed. The granulometric curves indicated that the bed material of the studied sections is basically composed of sand and gravel.
The concentrations of suspended sediments also showed variations between the seasons and the sampling periods. In the rainy season the sediment load was higher than in the dry season, thus evidencing the great influence of precipitation on the amount of sediment in the river. Among the stations, the highest mean concentration was obtained along section 3 and the lowest along section 1.
Besides precipitation, factors such as slope and vegetation cover influence the sediment dynamics in the Jordão River. The removal of vegetation cover directly affects the amount and transport of particles in the river. The intensification of the sediment load in periods of higher precipitation may be a consequence of the large amount of agricultural areas and pasture in the river basin. The steep slope in the high lying regions of the studied stretch promotes the transporting of sediment to stations 3 and 4, which present higher sediment loads.
The sediment key curves that relate suspended sediment concentration and flow indicate a significant dispersion in the data with determination coefficients between 0.55 and 0.74. The good adjustment of the parameters and the obtaining of determination coefficients close to 1 is essential for enabling the use of the sediment key curves.
A preliminary understanding of the dynamics of the sediments in the Jordão River, obtained in this research, is essential for contributing to studies related to the sedimentation of reservoirs, construction of PCH, in addition to providing subsidies in decision making, which together aid in improving the management of water resources in the watershed.
Finally, we highlight the great difficulties in the development of work related to sedimentology. In the current context, the use of numerical modeling, coupled with reduced models, fieldwork and laboratory tests, are essential for further research and reliable understanding of the phenomenon. Furthermore, continued research and work based on the Jordão River basin is required.
Acknowledgements
The authors are grateful to Fundação de Amparo à Pesquisa do Estado de Minas Gerais (FAPEMIG), through grant number 3899/2016, for supporting this research, and Coordenação de Aperfeiçoamento de Pessoal de Nível Superior (CAPES) for granting a master’s scholarship to the first author.
References
Ackers, P., & White, W. R. (1973). Sediment transport: New aproach and analysis. Journal of the Hydraulics Division, 99(11), 2041-2060.
Agência Nacional de Energia Elétrica [ANEEL] (2018, 25 de julho). Relatório de acompanhamento de estudos e projetos de usinas hidrelétricas. Retrieved from: http://www.aneel.gov.br/scg/Doc/Carteira.xlsx
Associação Brasileira de Normas Técnicas [ABNT]. (2016a). ABNT NBR 7181: Solo – Análise granulométrica. Rio de Janeiro, RJ: Author.
Associação Brasileira de Normas Técnicas [ABNT]. (2016b). ABNT NBR 6457: Amostras de solo – Preparação para ensaios de compactação e ensaios de caracterização. Rio de Janeiro, RJ: Author.
Arcova, F. C. S., & Cicco, V. (1997). Características do deflúvio de duas microbacias hidrográficas no Laboratório de Hidrologia Florestal Walter Emmerich, Cunha-SP.Revista do Instituto Florestal, 9(2), 153-170. Retrieved from https://bit.ly/2IWvNls
Aparecido, C. F. F., Vanzela, L. S., Vazquez, G. H., & Lima, R. C. (2016). Manejo de bacias hidrográficas e sua influência sobre os recursos hídricos. Irriga, 21(2), 239-256. doi: 10.15809/irriga.2016v21n2p239-256
Beling, F. A, Paiva, J. B. D., & Scapin, J. (2007) Avaliação de métodos de cálculo de transporte de sedimentos em um pequeno rio urbano. Brazilian Journal of Water Resources, 12(4), 5-21. doi: 10.21168/rbrh.v12n4.p5-21
Brigante, J., & Espíndola, E. L. G. (2003). Limnologia fluvial: um estudo no rio Mogi-Guaçu. São Carlos, SP: RiMa.
Brito, R. N. R., Asp, N. E., Beasley, C. R., & Santos, H. S. S. (2009). Características sedimentares fluviais associadas ao grau de preservação da mata ciliar – rio Urumajó, Nordeste Paraense. Acta Amazônica, 1(39), 173-180. doi: 10.1590/S0044-59672009000100017
Cabral, S. L., & Reis, R. S. (2015). Influência do uso e ocupação do solo na produção de sedimentos na bacia do rio Jacarecica. Revista de Geografia (UFPE), 32(2), 147-157.
Carvalho, N. O. (2008). Hidrossedimentologia prática (2a ed.). Rio de Janeiro, RJ: Interciência.
Carvalho, N. O., Filizola Júnior, N. P., Santos, P. M. C., & Lima, J. E. F. W. (2000). Guia de práticas sedimentométricas. Brasília, DF: Agência Nacional de Energia Elétrica. Retrieved from https://bit.ly/32YtOED
Carvalho, A. P. V, Brumatti, D. V., & Dias, H. C. T. (2012). Importância do manejo da bacia hidrográfica e da determinação de processos hidrológicos. Revista Brasileira de Agropecuária Sustentável, 2(2), 148-156. doi: 10.21206/rbas.v2i2.177
Cobaner, M., Unal, B., & Kisi, O. (2009). Suspended sediment concentration estimation by an adaptive neuro-fuzzy and neural network approaches using hydro-meteorological data. Journal of Hydrology, 367(1-2), 52-61. doi: 10.1016/j.jhydrol.2008.12.024
Cheng, N. S. (2002). Exponential Formula for Bedload Transport. Journal of Hydraulic Engineering, ASCE, 128(10), 942-946. doi: 10.1061/(ASCE)0733-9429(2002)128:10(942)
Colby, B. R. (1957). Relationship of unmeasured sediment discharge to mean velocity. Transactions, American Geophysical Union, 38(5), 708-719. doi: 10.1029/TR038i005p00708
Colby, B. R., & Hembree, C. H. (1955). Computations of total sediment discharge niobrara river near Cody, Nebraska (Geological Survey Water-Supply Paper 1357). Washington, D.C. Retrieved from https://pubs.usgs.gov/wsp/1357/report.pdf
Einstein, H. A. (1950). The bed load function for sediment transportation in open channel flows (Technical Bulletin n. 1026). Washington, D.C.: US Department of Agriculture Soil Conservation Service.
Engelund, F., & Hansen, E. (1967). A monograph on sediment transport in alluvial streams (Hydraulic Engineering Reports). Copenhagen: Teknisk Verlag. Retrieved from http://resolver.tudelft.nl/uuid:81101b08-04b5-4082-9121-861949c336c9
Garrido, J. W. A., Sousa, T. M. I., Ismael, L. L., Crispim, D. L., Ferreira, P. M. L., & Queiroz, M. M. F. (2018). Determinação das curvas-chave de descargas de sedimentos em suspensão na bacia hidrográfica do rio Piancó-Piranhas-Açu. Engenharia Sanitária e Ambiental, 23(1), 69-75. doi: 10.1590/S1413-41522018138711
Glysson, G. D. (1987). Sediment-transport curves. Reston, VA: U.S. Geological Survey.
QGIS Development Team. (2016). QGIS (Version 2.18) [Software]. Retrieved from https://bit.ly/3nIdEab
Karim, F. (1998). Bed material discharge prediction for nonuniform bed sediments. Journal of Hydraulic Engineering, 124(6), 597-604. doi: 10.1061/(ASCE)0733-9429(1998)124:6(597)
Meyer-Peter, E., & Muller, R. (1948). Formulas for bed load transport. In Procedings of the 3rd Meeting of International Association Hydraulic Research (p. 39-64), Stockholm.
Salla, M. R., Pereira, C. E., Alamy Filho, J. E., Paula, L. M., & Pinheiro, A. M. (2013). Estudo da autodepuração do rio Jordão, localizado na bacia hidrográfica do rio Dourados. Engenharia Sanitária e Ambiental, 18(2), 105-114. doi: 10.1590/S1413-41522013000200002
Santos, I., Fill, H. D., Sugai, M. R.V. B., Buba, H., Kishi, R. T., Marone, E., & Lautert, L. F. C. (2001). Hidrometria aplicada. Curitiba, PR: Instituto de Tecnologia para o Desenvolvimento.
Van Rijn, L. C. (1984). Sediment transport, Part I: Bed load transport. Journal of Hydraulic Engineering, 110(10), 1431-1456. doi: 10.1061/(ASCE)0733-9429(1984)110:10(1431)
Van Rijn, L. C. (1984). Sediment transport, Part II: Suspended load transport. Journal of Hydraulic Engineering, 110(11), 1613-1641. doi: 10.1061/(ASCE)0733-9429(1984)110:11(1613)
Van Rijn, L. C. (1984). Sediment transport, Part III: Bed forms and alluvial rougness. Journal of Hydraulic Engineering, 110(12), 1733-1754. doi: 10.1061/(ASCE)0733-9429(1984)110:12(1733)
Vanzela, L. S., Hernandez, F. B. T., & Franco, R. A. M. (2010). Influência do uso e ocupação do solo nos recursos hídricos do córrego Três Barras, Marinópolis-SP. Revista Brasileira de Engenharia Agrícola e Ambiental, 14(1), 55-64. doi: 10.1590/S1415-43662010000100008
Zhang, G. -H., Liu, G. -B., Wang, G. -L., & Wang, Y. -X. (2011). Effects of vegetation cover and rainfall intensity on sediment-bound nutrient loss, size composition and volume fractal dimension of sediment particles. Pedosphere, 21(5), 676-684. doi: 10.1016/S1002-0160(11)60170-7
Wang, X. -M., Hao, R., Huo, J., & Zhang, J. -F. (2008). Modeling sediment transport in river networks. Physica A: Statistical Mechanics and its Applications, 387(25), 6421-6430. doi: 10.1016/j.physa.2008.07.027
Yang, C.T. (1973). Incipient Motion and Sediment Transport. Journal of the Hydraulics Division, ASCE, 99, (HY10), 1679-1701.
