Engenharia Mecânica
Recepción: 14 Octubre 2019
Aprobación: 29 Julio 2020
DOI: https://doi.org/10.4025/actascitechnol.v43i1.50363
Abstract: ABSTRACT. The Finite Element Method analysis of machining processes has become a ubiquitous feature to the area, however, there sometimes occur considerable deviations between experimental and simulated results due to the inherent complexity of the process. The basis for such may conceivably be related to imprecisions in the material and friction modelling, besides improper setup of mesh parameters. Elements should be small enough to allow for the proper representation of the chip formation, but taking into account that the computational time increases accordingly with mesh downsizing. Simulations of the milling process of Inconel 718 were conducted using the software Thirdwave AdvantEdge under different cutting conditions for three different meshes. Power and temperature output were compared to experimental results, most of which were measured via Hall-effect sensors and thermographic camera, respectively. The tool cutting edge radius was found to be an important factor and was estimated using Scanning Electron Microscope images. The influence of the finite element mesh size was higher for harsher cutting conditions, with effects felt on machining power only. In this case, finer mesh produced results that showed a higher agreement with experimental data, but at higher computational cost as shown by analysis of elapsed processing time. Although errors higher than 40% were observed, power and temperature trends from simulations were always in accordance with that found in experimental tests. Comparisons with experimental data from other studies showed the errors tend to grow for higher feed and cutting speed, which indicates the constitutive model of the material is more adequate for softer machining conditions. Simulation time seemed to be exponentially proportional to the inverse of minimum element size, and measured values might serve as a reference for other users.
Keywords: mesh downsizing, machining simulation, AdvantEdge, FEM, shoulder milling, Inconel 718.
Introduction
Milling is considered a complicated machining process, as the rotating tool and the intermittent cutting action produce varying chip loads and chip thicknesses (Man, Ren, Usui, Johnson, & Marusich, 2012). The cutting speed direction of the edge varies during chip removal, and machine stiffness and cutter geometry may have a significant influence over the final product. Furthermore, the nonlinear behavior of the material under ample plastic strain, high strain rate and high temperature are difficult to model, thus representing another challenge when investigating this process.
The application of the Finite Element Method (FEM) analysis is common practice in the study of machining processes. It enables the reduction in the number of experimental tests, saving time and reducing costs. In addition, it allows for the optimization of process parameters such as cutting speed, feed and tool geometry, as a way of predicting forces and tool deflection, cutting edge temperature and wear, as well as other variables that are hard to obtain experimentally, as in residual stress, accumulated plastic strain and strain rate. This method becomes even more relevant for high cost or difficult to machine materials, among which nickel super alloys are important examples (Batista et al., 2015).
Inconel 718 is a nickel-based alloy with a high chromium and iron content, and its most important feature is the retaining of its mechanical and chemical properties even at high temperatures. For this reason, it has been widely used in aerospace, automotive, oil and gas, and even biomedical industries. It has low thermal conductivity and it hardens substantially due to the work hardening effect, which increases tool wear (Favero Filho et al., 2019). However, it is expensive when compared to other metals and alloys, such as stainless steels and tool steels (Wang, Zhanga, Wu, & Luo, 2017).
Even though the application of FEM holds a number of advantages, results do not necessarily represent the cutting process accurately. Errors in machining forces can be as high as 35% (Maurel-Pantel, Fontaine, Thibaud, & Gelin, 2012), mainly due to nonlinearities in the material constitutive law, which models the softening effect at high temperatures and the strain hardening effect resultant from plastic deformation. Imperfections in friction modelling and difficulty in determining the optimum mesh refinement also contribute toward the deviation of results. Although high relative errors may be acceptable due to high complexity and difficulty of modelling the process, the current challenges in this area are to reduce the errors and uncertainties by better adjusting the input parameters so that the output reaches a higher level of agreement with the real phenomenon. It is also desirable to discover the conditions for which simulations diverge from experiments. For these reasons, most simulations are accompanied by experimental results to be compared to the simulation output. This way, if there is good agreement between both within a given range of machining conditions, then the input parameters were properly chosen.
Regarding mesh refinement in FEM, the size of the element should be small enough to allow for the proper representation of the chip formation and deformation process, otherwise results might be inaccurate and unusable. Nevertheless, elements should not be smaller than necessary, since the required memory and processing capacity grows when the element size decreases. Therefore, this paper aims at analyzing the influence of mesh refinement in the accuracy of FEM results related to milling of Inconel 718. In order to evaluate such influence, power and temperature are compared alongside experimental data from different cutting speeds and feed rates. Simulations were made with three different meshes and computational time was also taken into consideration.
FEM modelling and analysis
The machining simulations were carried out using the software Thirdwave AdvantEdge®. Its FEM model is based on an explicit dynamic Lagrangian approach, as explained in the studies of Man et al. (2012), Del Prete, Primo and Franchi (2013) and Niesłony, Grzesik, Chudy and Habrat (2015). Friction is calculated according to the Coulomb friction model and the material constitutive lawis based on a power-law model as shown in Equation (1), in which the equivalent stress σ is a function of the equivalent plastic strain α, plastic strain rate and temperature T.
 (1)
(1)In Equation (2) g(α) describes the strain hardening effect according to the initial yield stress σ0 of the non-deformed material, while in Eq. (3) Γ( ) is the strain rate sensitivity. Both Equation (2) and (3) were computed by power-law models. In Equation (4) Θ(T) is the thermal softening function which is described by a fifth-order polynomial.
 (2)
(2)
 (3)
(3)
 (4)
(4)The values of constant parameters are defined in the software library, produced by fitting stress-strain curves to data obtained from experimental material testing. As these experiments do not cover every condition of strain and temperature, the approximations made are an important source of errors. Rupture of the material is modelled by a damage model as in Equation (5) (Devotta, Beno, Siriki, Löf, & Eynian, 2017), which takes into consideration the accumulation of plastic deformation in relation to the strain at failure epf which is temperature dependent, as in Equation (6).
 (5)
(5)
 (6)
(6)The software automatically re-meshes the workpiece periodically in consonance with the deformation of the element (Bil, Engin Kılıc, & Erman Tekkaya, 2004), thus refining large elements and distorted areas, as well as coarsening small elements and non-distorted areas. It reduces the number of nodes and therefore decreases the calculations performed by the computer processing unity. If the elements deform excessively between iterations, errors may force the simulation to stop. Moreover, depending on the size of the elements, errors can appear caused by temperature divergence or failure in the region of contact between surfaces. Possible solutions usually involve changing the mesh parameters, such as minimum element size and the mesh refinement factor (Thirdwave Systems, 2015). Simultaneously, a satisfactory chip formation requires a minimum element size denoted aelem, as described in Equation (7).
 (7)
(7)Where ft represents the feed rate and τ is a scalar parameter, which in Maurel-Pantel et al. (2012) is recommend as being set at six or higher.
In this study, the simulation model was applied to a 2D geometry as a simplification of the machining system. It enables much faster simulations when compared to 3D analysis. The disadvantage is the restriction of simulating one single cutting action from one single edge, without taking into consideration the strain hardening effect on the machined surface after each pass, neither the thermal effect resultant from a consecutive intermittent cut.
The first of these noted disadvantages is expected to raise the required cutting power when compared to simulation results. The second would lead to higher temperatures along the cutting edge, which in turn could decrease the material resistance and diminish the necessary cutting power. Furthermore, the Coulomb friction model was reported by Bil et al. (2004) as a poor representation of friction in the tool-chip interface and lead to friction stresses higher than the material shear yield strength, which would arrive at physically incorrect analysis. These are some of the sources of errors in the simulation of machining processes.
The 2D representation of up-milling can be seen in Figure 1, where V is the cutting speed, woc is the width of cut, f is the maximum theoretical chip thickness, loc is the length of cut and doc is the axial depth of cut. In down milling, tool rotation and V are in the opposite direction, and so the chip is thicker at the beginning of the cut.
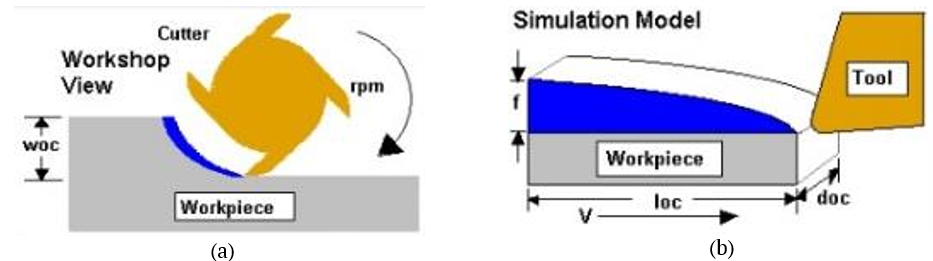
Figure 1. (a) Representation of actual 3D process. (b) 2D representation for simulation.
Source: Adapted from Thirdwave Systems (2015).
Material and methods
Experimental results for power were measured through two Hall effect sensors, one for each electrical phase of the machining center, as explained in detail in the study by Silva, Okada, Carvalho, Costa and Machado (2017). The working principle behind this sensor is described in detail by Ramsden (2006). In this configuration a HAS 50-S transducer from LEM was used to measure electric current, which is positioned around one of the conductors of the power supply. A LV 20-P transducer from LEM was positioned in parallel with the other conductor to measure the electric tension. Signals were amplified, attenuated and isolated by an electronic circuit assembled with operational amplifiers, resistors and capacitors, which allowed for constant gain. Correspondingly, a digital amplifier (741 series) and a NI USB-6221 data acquisition board were employed with 10 Khz acquisition rate. The cutting power was then estimated using Equation (8), where Pc is the average electrical power, i(t) and v(t) are respectively the instantaneous electric current and voltage for each time step t.
 (8)
(8)The signals obtained by the sensor can then be expressed as an infinity sum of the sinusoidal function of the integral multiples of the fundamental harmonics frequency for the electric line (60 hz), as shown in Equation (9), where Pf is the average power in the phase, Pdc is the constant component of the Fourier series and Pn are the harmonic components of the phase. Through this equation, the total average power can be obtained by the sum of the average over the powers in each voltage and electric current that are related harmonically. Since induction electric motors are manufactured in order to possess three-phase windings, the average power measured on each phase are, across the majority of the operational range, the same, and the effective cutting power can be measured using Equation (10).
 (9)
(9)
 (10)
(10)The temperature was assessed experimentally through an A325 thermographic camera from FLIR Tools®, which generates images with a frame resolution of 320 x 240 pixels. The machined material was painted in matte black in order to reduce workpiece reflectivity so that emissivity was adjusted to 0.95 after calibration. Frames were acquired at 30 Hz and each one was later converted to a numeric matrix in MATLAB®, through which the maximum temperature occurring in the frame was established. Figure 2 shows the position of the thermographic camera fixed to a CNC worktable. For this arrangement, the tool first approaches the camera focal point, indicated by the ascending region of Figure 3. The plateau region of the graph occurs when the tool is passing in the focal region; hence these points were used to calculate tool temperature as a mean value of 500 points at maximum temperature level. Although direct temperature measurements using thermocouple were not performed, the implemented methodology was previously validated by Soler, Childs and Arrazola (2015) and Da Silva et al. (2018), using thermocouples to assess whether the thermal camera emissivity calibration was performed correctly. This method was shown by these authors as a valid manner of evaluating temperature close to the tool-chip interface with regular precision.
The two output variables were evaluated in dry shoulder up-milling of an aged Inconel 718 plate supplied by Villares Metals S.A. with hardness of around 430 ± 2 BHN. In shoulder milling, as defined by SANDVIK (2019), two surfaces are generated simultaneously, which requires a combination of peripheral and face milling. Tests were run on a Romi Bridgeport Discovery-760 CNC machine center with 9 kW power capacity on the spindle. Micro-grain uncoated solid cemented carbide rods of class TMG30 and CTS18D were supplied by the Ceratizit Group, from which custom end mills with a 10 mm diameter, 4 cutting edges and 22 mm length of cutting edge were manufactured and sharpened by OSG Sulamericana. The edge radius was estimated at 10 µm through Scanning Electron Microscope (SEM) images, as shown in Figure 4. This parameter is an input for FEM software and has a pronounced effect in the simulation results based on the pretests conducted. According to Trent and Wright (2000), this parameter influences contact pressure between tool and material on region of cut during chip formation. Although the Alicona microscope would be more appropriate for estimating edge radius, previous studies (Ucun, Aslantas, & Bedir, 2013; Thepsonthi & Özel, 2013; Zhou et al., 2015) have used SEM and an optical microscope to measure cutting edge radius.
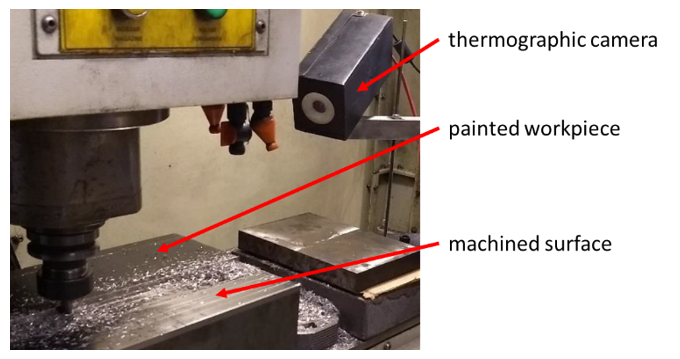
Figure 2. Setup of thermographic camera at the machining center during milling tests.
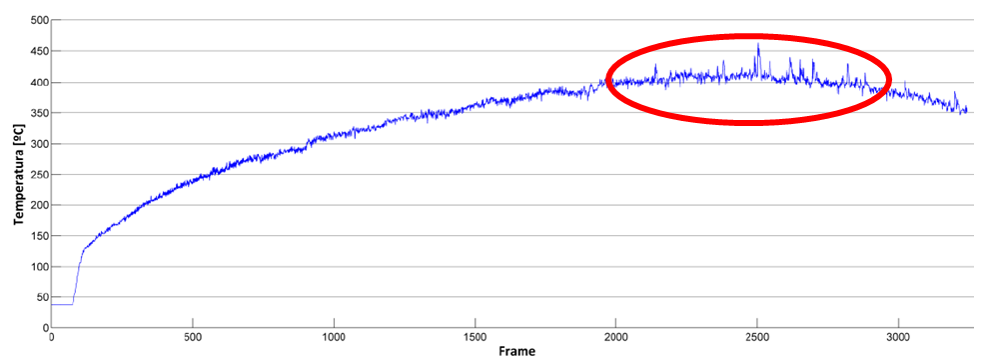
Figure 3. Temperature measured during course followed by the tool, where maximum values highlighted in red circle happen when the tool is in camera focus.
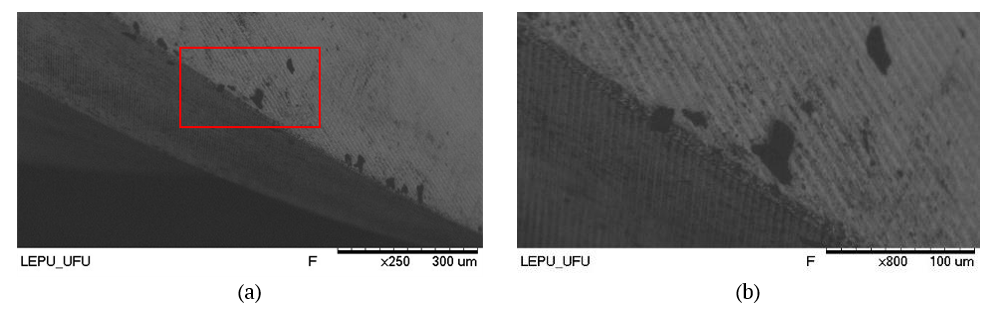
Figure 4. (a) View of the fresh helical cutting edge at 250x amplification and (b) highlighted area at 800x amplification.
Process parameters used in the experiments were reproduced in the simulations and are shown on Tab. 1, where V is the cutting speed, fz is the feed per tooth, doc is the depth of cut and woc is the width of cut. Theoretical length of cut (loc) was calculated analytically as explained by Machado, Abrão, Coelho and Silva (2009), which resulted in a length of cut of 2.26 mm. In regards to the software setup, the friction coefficient was set as 0.5. The collaborators in Melkote et al. (2017) affirm that since it is difficult to precisely model friction at the tool-chip interface, the Coulomb model is still widely used and normally set between 0.2 and 0.6. A simple sensitivity analysis was carried by altering values for the friction coefficient in this interval for all cutting conditions simulated, while observing the variation of cutting power and temperature. For all conditions, power did not change more than 10% while temperature did not change more than 7%. Due to these small variations, the arbitrary value 0.5 was chosen, as recommended by Thirdwave Systems (2015) when no other reliable data from experiments are available for the simulated conditions.
The tool material was set as K grade carbide, while minimum element size, maximum element size and mesh grading of the tool were fixed at 0.002 µm, 0.8 µm and 0.9, respectively. Regarding the K grade, this material class better represents the carbide used for these tools. In relation to tool element sizes and mesh grading, these determine the mesh refinement in tool area and their definitions are arbitrary, being adjusted according to the most convenient value after many pretests. This is natural since currently, most FEM machining software requires the user to find and define by themselves the most appropriate values for some given input parameters by verification of simulation quality through comparison of output with experimental data.
The initial temperature was set to 30 °C, the workpiece height was defined as 1.5 mm, which is more than 90 times the feed values tested, in agreement with the minimum of 5 times that established by Davim and Maranhão (2009). These authors recommend this parameter in order to guarantee closer representation of heat flux and temperature distribution in an actual thicker part where heat is conducted to the bulk, since during simulations a thinner part is defined to diminish the number of nodes calculated by the program.
Three different values for workpiece minimum element size were simulated and are also shown on Table 1, while Figure 5 shows the different meshes produced in accordance with this parameter.
Table 1. Cutting conditions and simulation parameters.
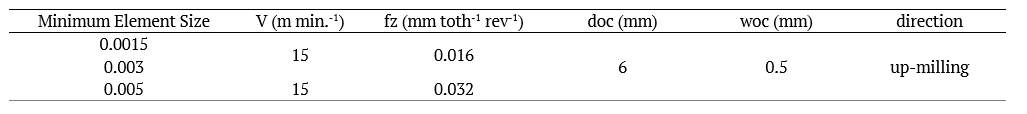
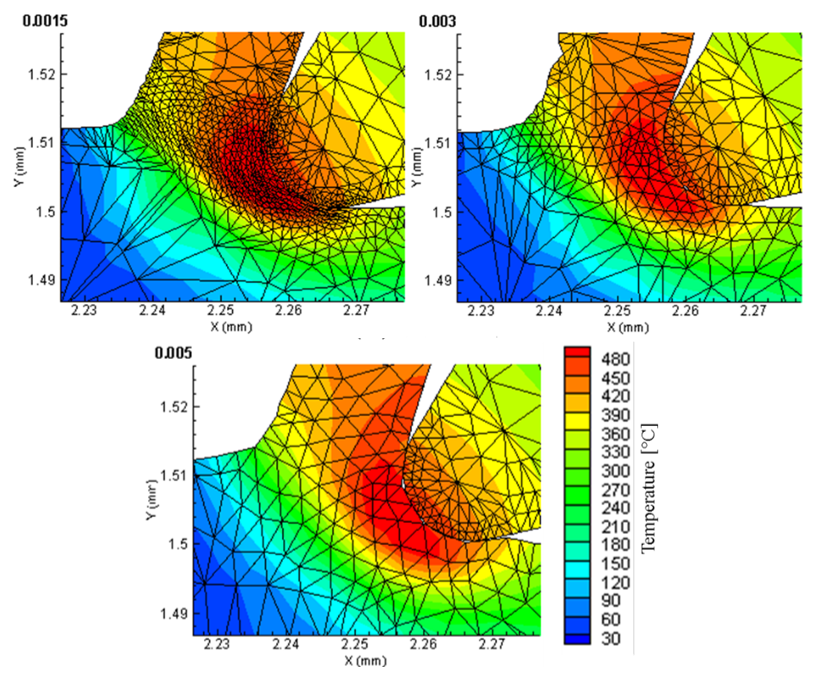
Figure 5. Mesh refinement and element sizes near tool-chip interface.
The software remeshes the geometry according to the mesh refinement factor and mesh coarsening factor, which are both set to a maximum of 8. The first factor refines the mesh near the cutting area, whereas the second coarsens the mesh away from the cutting region, focusing computational effort on high deformation areas, which are more important for model accuracy. FEM tests were run on a computer with an Intel Core i7-4790 @3.60 GHz processor, with 4 physical cores and up to 8 processing threads via hyper-threading, and 16 GB of RAM.
Results and discussion
The simulation output is seen in Figure 6, where it is compared with experimental results. Differently from experimental tests, software given solutions only change if input variables are modified, and for this reason no standard deviation was incorporated in the analysis. Furthermore, an important consideration is that the experimental temperature was measured as the highest value captured by the thermographic camera, which was centered on an area of the tool that comprised of a few square millimeters and over 15 seconds of milling. Meanwhile, FEM temperature results correspond to the highest value of temperature encountered throughout the simulation, which corresponds to a few square micrometers of area on the tool during one single cut. Even though the comparison of the two temperature readings is not the most appropriate, their correlation is a valid means for analysis, since there is no temperature measurement method capable of evaluating the temperature close to the tool-chip interface with great precision.
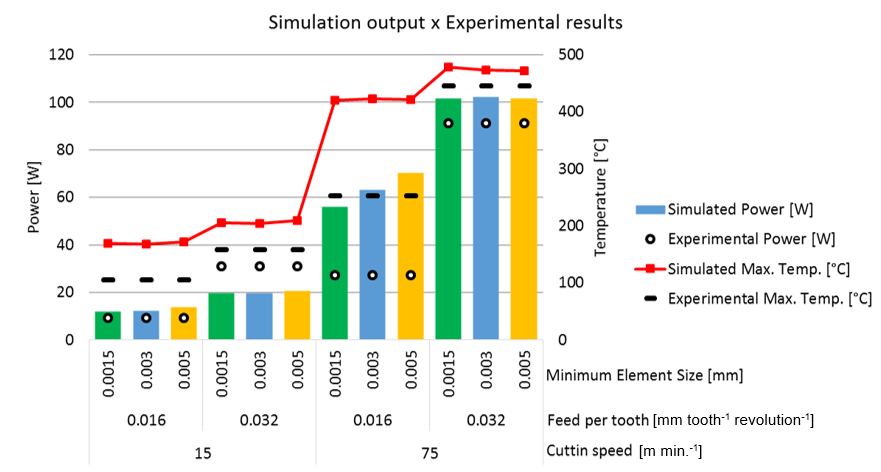
Figure 6. Comparison of experimental and simulation results for different cutting conditions and mesh parameters
Minimum element size does not seem to have a great effect on calculated power and temperature, except for process condition of cutting speed 75 m min.-1 and feed 0.016 mm teeth-1 revolution-1, for which there is a 15 W difference when minimum element size is increased from 0.0015 to 0.005 mm. In this scenario, the mesh with smaller elements showed better agreement regarding power results, whereas the coarser mesh showed the worst results. Furthermore, this cutting condition presents the highest relative error in both power and temperature when compared to experimental results.
The interdependency between these two variables in the FEM model may have been the cause of a buildup in the error that created greater deviation in both. As shown by Equation (1) and Equation (4), stress developed in the machined material is temperature-dependent and usually decreases when the temperature in the contact region rises. Simultaneously, Equation (5) and (6) show that maximum strain undergone by an element also varies with the temperature of the cutting region, though in this case, the limit of accumulated strain increases with temperature. In FEM calculations, the power required to cut an element can be understood as the product of stress needed to deform it multiplied by strain rate during its deformation, until the element reaches maximum accumulated strain and is separated from the base material according to criteria of Equation (6). Therefore, cutting power can increase or decrease when the temperature rises, depending on which stress or accumulated strain is affected to the greater degree. Furthermore, the energy turned into heat on the chip-tool interface increases in accordance with the cutting power and therefore, the temperature in the contact region is also dependent on machining power. This behavior shows the complexity of the phenomenon that occurs during machining and why it is so difficult to model it via the Finite Element Method.
Moreover, the fact that the uncut chip thickness is less than 10 times the value of the edge radius might also have contributed to the discrepancies observed. The authors Davim and Maranhão (2009) explained that in this case, where the cutting phenomena occurs within a small depth from the material surface, the simulation model does not provide a good representation of the process due to scale effect. Other possible reasons include inaccuracies in the material constitutive model and friction modelling, non-representation of intermittent cut and its effects during simulations.
Average relative errors and correlations for different process conditions were calculated for each set of mesh parameters employed and are shown in Figure 7. Results show that neither the relative errors nor the correlation between experimental and simulated temperature alter significantly for variations in mesh parameters. The same is not valid regarding power, for which the relative errors increased by almost 20% and correlation diminished from 0.91 to 0.84 when increasing the minimum element size from 0.0015 to 0.005 mm. This phenomenon is associated with the highest errors encountered for coarser mesh, particularly on the process condition of cutting speed 75 m min.-1 and feed 0.016 mm teeth-1 revolution-1. Additionally, except for one of the cutting conditions, the errors obtained are acceptable and even expected, according to Man et al. (2012). As shown in their study, errors tend to increase when feed value decreases or cutting speed increases, as such the cutting conditions investigated in the present study, which are typical of super-finishing operations, exhibited this very behavior. Although errors of about 35% might be reasonable according to this author, the correlation values produced indicate that deviations on the model are likely to be systematic in nature, and therefore could be corrected by better adjusting the FEM model. This is not a simple task as the model must encompass many different cutting conditions and its specific resulting phenomena into one single general equation.
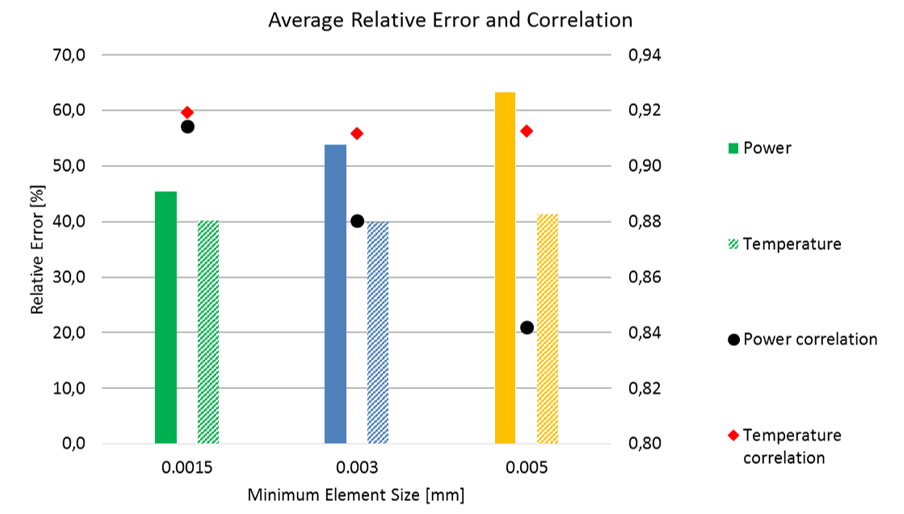
Figure 7. Error and correlation between experimental and simulated values of temperature and power.
Although the situation presented herein would indicate the finer mesh as the best, computational cost must also be taken into consideration. Figure 8 shows the average time among the four different cutting conditions calculated for each mesh. Linear and exponential fit were adjusted and R-squared calculated. This latter factor indicates that computational time is exponentially proportional to the inverse of the mesh size. This way, although the finest mesh produces lowest errors, it might not be the most appropriate due to the excessive time necessary, of about 14 hours for the finer mesh in comparison with 40 minutes for the coarser. In terms of processing time, this is shown to be 21 times higher, which should be considered before setting more refined meshes for simulations.
The shape of the chip is seen in Figure 9. The images show that no significant difference could be perceived in the temperature distribution when the mesh was altered. Although chip geometry was not studied in the experimental tests, smaller values for minimum element size likely provide a better representation of chip formation. At least, in this case, the coarser mesh produced a rougher chip. A valid consideration is that machining of high-temperature resistant materials, such as Inconel, may result in the segmented chip, but not necessarily. According to Trent and Wright (2000), the chip shape depends on many different factors, including process parameters such as cutting speed and feed.
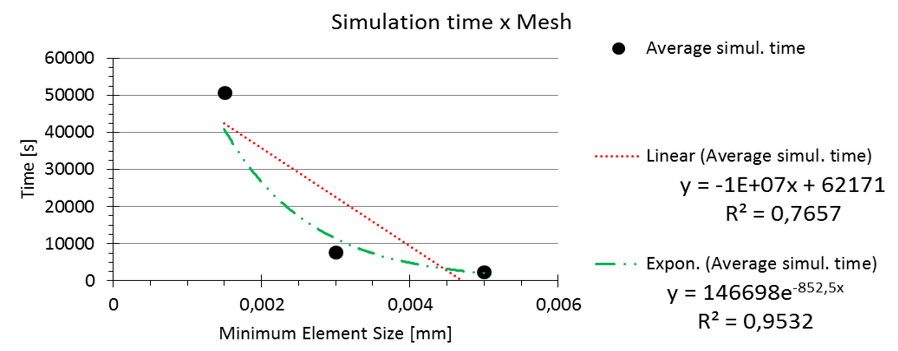
Figure 8. Evolution of consumed time for simulations with the variation of mesh parameters.
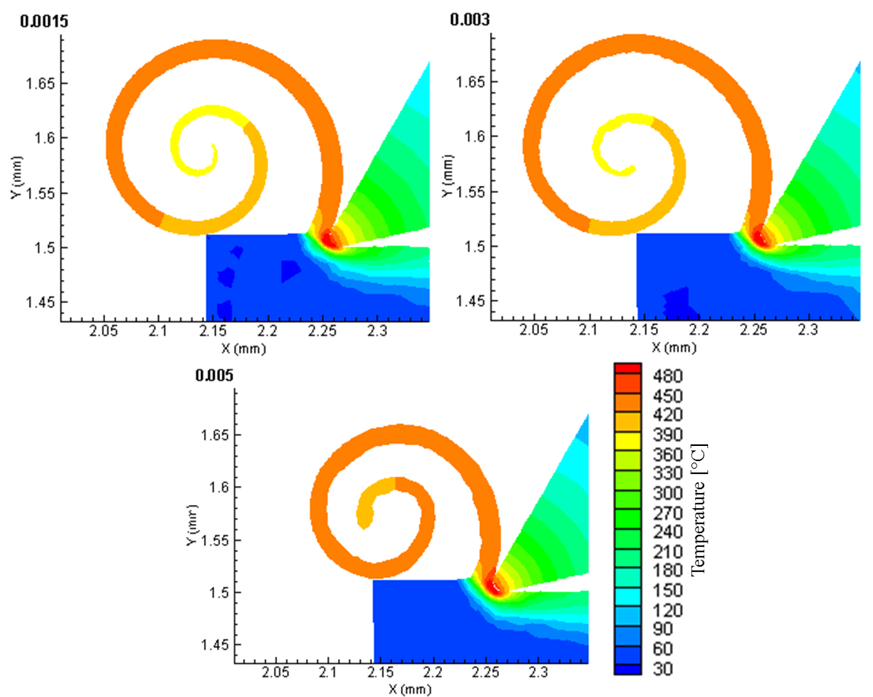
Figure 9. Temperature distribution in chip and tool tip.
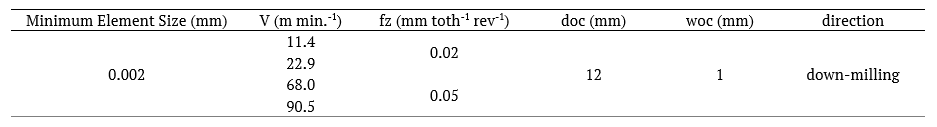
In order to better understand the conditions in which simulations diverge from experiments, additional tests of the down-milling process were considered. The same methodology was used, except that temperature was not measured. Simulations were carried out with a fixed material mesh of 0.002 mm minimum element size. To expand the analysis, similar studies were sought in the literature to find experimental tests with dry shoulder or side milling of Inconel 718 that used a carbide tool, so that more simulations could be compared for different cutting conditions. This information was found in the study by Liao, Lin and Wang (2008), in which these authors measured cutting force in side milling for two different feeds and several cutting speeds over a linear distance of 50 mm for each test case. The parameters used varied for experiments and FEM tests, and these are displayed on Table 2. Carbide tools of K grade were also used, but with a diameter of 12 mm. Since in the Liao et al. (2008) case only force was measured, the equivalent cutting power was calculated by simply multiplying cutting force by the test cutting speed, so that it can be compared with the simulation results. The other numeric parameters are the same for the up-milling tests. The relative errors for power output of all down-milling tests are shown in Figure 10.
In down-milling tests the higher relative errors are observed again for a cutting speed of 75 m-1 min.-1, especially for the lower feed of 0.016 mm tooth-1 rotation-1. Even though general results are mostly within the 40% tolerance for other speeds, it seems they tend to rise when approaching these specific cutting conditions. This indicates there is likely some specific physical phenomenon occurring in these cases, which is not well represented by the power law constitutive model. This could be related to variations in material surface regarding tensile resistance and ductility at higher strain rates. Since for the lower feed the tool tooth removes metal up to a layer only a few micrometers deep in the material surface, the strain hardening effect ensued by previous cuts or even by Inconel manufacturing could cause such discrepancies in material properties. As this FEM model does not consider any strain before the cut, this is the most probable cause of the high deviations observed in cutting power over certain machining conditions.
Table 2. Cutting conditions and simulation parameters of tests from Liao et al. (2008)
Cutting power error between experiments and FEM
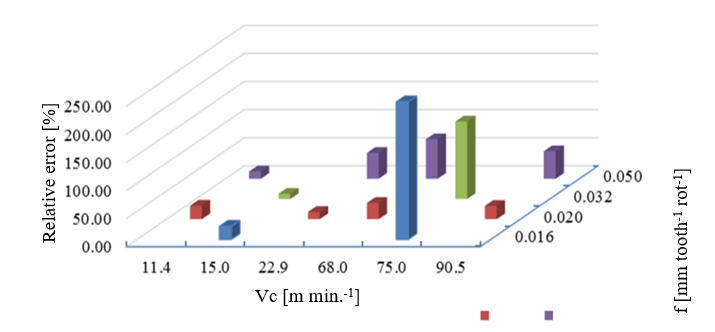
Figure 10. Relative error in cutting power for different machining conditions.
Note: Tests from Liao, Lin and Wang (2008).
The general correlation between experimental and numeric power results was of 0.98. Again, this indicates that simulation captures the trend of increase or decrease in power when cutting speed or feed are changed. This shows the ability for FEM to optimize power, temperature or other variables in manufacturing line routines. In these practical scenarios, machining might be limited by equipment power capabilities and stiffness or increased tool wear due high temperatures. In this way, the use of simulations before machining would not only avoid damage from incorrect choice of cutting parameters, but also help to improve manufacturing productivity.
Conclusion
In this paper, machining power and temperature results for FEM analysis were compared with experimental data for dry shoulder milling of Inconel 718. Mesh downsizing did not influence significantly the temperature in up-milling, but increased the error for machining power linearly and the processing time exponentially. Also, modeling the coupling between the mechanical and thermomechanical response remains one of the greatest challenges in the simulation of the machining process, especially in conditions of low volume of material removal and high cutting speeds. Nevertheless, the ability of the FEM model to reproduce power and temperature trends enables optimization of cutting parameters in manufacturing lines for improvements to productivity.
References
Batista, M., Morales, A., Gómez-Parra, A., Salguero, J., Puerta, F. J., & Marcos, M. (2015). 3D-FEM based methodology for analyzing contour milling processes of Ti Alloys. Procedia Engineering, 132, 1136-1143. doi: 10.1016/j.proeng.2015.12.606
Bil, H., Engin Kılıc, S., & Erman Tekkaya, A. (2004). A comparison of orthogonal cutting data from experiments with three different finite element models. International Journal of Machine Tools & Manufacture, 44(9), 933-944. doi: 10.1016/j.ijmachtools.2004.01.016
Davim, J. P., & Maranhão, C., (2009). A study of plastic strain and plastic strain rate in machining of steel AISI 1045 using FEM analysis. Materials and Design, 30(1), 160-165. doi: 10.1016/j.matdes.2008.04.029
Del Prete, A., Primo, T., & Franchi, R. (2013). Super-nickel orthogonal turning operations optimization. Procedia CIRP, 8, 164-169. doi: 10.1016/j.procir.2013.06.083
Devotta, A., Beno, T., Siriki, R., Löf, R., & Eynian, M. (2017). Finite element modeling and validation of chip segmentation in machining of AISI 1045 steel. Procedia CIRP, 58, 499-504. doi: 10.1016/j.procir.2017.03.259
Favero Filho, A., Silva, L. R. R., Souza Ruzzi, R., Costa, E. S., Sales, W. F., Jackson, M. J., & Machado, Á. R. (2019). Influence of milling direction in the machinability of Inconel 718 with submicron grain cemented carbide tools. The International Journal of Advanced Manufacturing Technology, 105(1-4), 1343-1355. doi: 10.1007/s00170-019-04328-3
Liao, Y. S., Lin, H. M., & Wang, J. H. (2008). Behaviors of end milling Inconel 718 superalloy by cemented carbide tools. Journal of Materials Processing Technology, 201(1-3), 460-465. doi: 10.1016/j.jmatprotec.2007.11.176
Machado, A. R., Abrão, A. M., Coelho, R. T., & Silva, M. B. (2009). Teoria da usinagem dos materiais. São Paulo, SP: Edgard Blucher.
Man, X., Ren, D., Usui, S., Johnson, C., & Marusich, T. D. (2012). Validation of finite element cutting force prediction for end milling. Procedia CIRP, 1, 663-668. doi: 10.1016/j.procir.2012.05.019
Maurel-Pantel, A., Fontaine, M., Thibaud, S., Gelin, J. C. (2012). 3D FEM simulations of shoulder milling operations on a 304L stainless steel. Simulation Modelling Practice and Theory, 22, 13-27. doi: 10.1016/j.simpat.2011.10.009
Melkote, S. N., Grzesik, W., Outeiro, J., Rech, J., Schulze, V., Attia, H., ... Saldana, C. (2017). Advances in material and friction data for modelling of metal machining. CIRP Annals, 66(2), 731-754. doi: 10.1016/j.cirp.2017.05.002
Niesłony, P., Grzesik, W., Chudy, R., & Habrat, W. (2015). Meshing strategies in FEM simulation of the machining process. Archives of Civil and Mechanical Engineering, 15(1), 62-70. doi: 10.1016/j.acme.2014.03.009
Ramsden, E. (2006). Hall-effect sensors: theory and application. Oxford, UK: Newnes.
SANDVIK. (2019). Shoulder milling. SANDVIK Coromant. Recovered from https://bitlybr.com/GhCCDWG
Silva, L. R. R., Okada, K. F. A., Carvalho, G. M., Costa, E. S., & Machado, A. R. (2017). Validation of a power measurement system in the milling process using Hall sensors. In Proceedings of the 24th ABCM International Congress of Mechanical Engineering. doi: 10.26678/ABCM.COBEM2017.COB17-5609
Silva, L. R. R., Favero Filho, A., Costa, E. S., Pico, D. F. M., Sales, W. F., Guesser, W. L., & Machado, A. R. (2018). Cutting temperatures in end milling of compacted graphite irons. Procedia Manufacturing, 26, 474-484. doi: 10.1016/j.promfg.2018.07.056
Soler, D., Childs, T. H., & Arrazola, P. J., (2015). A note on interpreting tool temperature measurements from thermography? Machining Science Technologies, 19(1), 174-181. doi: 10.1080/10910344.2014.991027
Thepsonthi, T., & Özel, T. (2013). Experimental and finite element simulation based investigations on micro-milling Ti-6Al-4V titanium alloy: effects of cBN coating on tool wear. Journal of Materials Processing Technology, 213(4), 532-542. doi: 10.1016/j.jmatprotec.2012.11.003
Thirdwave Systems (2015). AdvantEdge User Manual 7.1. Thirdwave Systems..
Trent, E. M., & Wright, P. K. (2000). Metal cutting. Woburn, US: Butterworth Heinemann.
Ucun, I., Aslantas, K., & Bedir, F. (2013). An experimental investigation of the effect of coating material on tool wear in micro milling of Inconel 718 super alloy. Wear, 300(1-2), 8-19. doi: 10.1016/j.wear.2013.01.103
Wang, J., Zhanga, D., Wu, B., & Luo, M. (2017). Numerical and empirical modelling of machining-induced residual stresses in ball end milling of Inconel 718. Procedia CIRP, 58, 7-12. doi: 10.1016/j.procir.2017.03.177
Zhou, L., Peng, F. Y., Yan, R., Yao, P. F., Yang, C. C., & Li, B. (2015). Analytical modeling and experimental validation of micro end-milling cutting forces considering edge radius and material strengthening effects. International Journal of Machine Tools and Manufacture, 97, 29-41. doi: 10.1016/j.ijmachtools.2015.07.001
Notas de autor
filipin_anjos@hotmail.com
