Engenharia Civil
Nano-silica added to Portland cement
Nano-silica added to Portland cement
Acta Scientiarum. Technology, vol. 43, e51699, 2021
Universidade Estadual de Maringá
Recepción: 06 Enero 2020
Aprobación: 03 Julio 2020
Abstract: For a controlled particle size distribution, nano-silica was added to three different cements. The chemical and mineralogical compositions of the cements were characterized by fluorescence and X-ray diffraction. The granulometric distributions of cements and nano-silicas were obtained by laser granulometry and dynamic lightning scattering. The specific surface area of the raw materials was determined by gas adsorption. The effect of nano-silica and type of cement on rheological behavior was evaluated by rotational rheometry. The mechanical performance was investigated through the compression strength. The microstructural analysis was performed by scanning electron microscopy. The water demand and the consumption of dispersant increases according to the nano-silica content. The reduction in the inter-particle separation, and the agglomeration of nano-silica led to an increase in the viscosity of the suspension. The mechanical performance was directly affected by the specific surface area of the cements. Microstructural analysis showed that nano-silica changed from a layered adsorbed structure, to a porous or agglomerated structure.
Keywords: particle size distribution, specific surface area, viscosity, compressive strength, microstructure.
Introduction
The use of nano-materials is a current trend, which can contribute to the improvement of the mechanical performance of cement-based materials. Many processes can be used to obtain nano-silica, such as quartz milling (Saleh, Ibrahim, & Salman, 2015), plants extraction (Fernandes, Sabino, & Rossetto, 2014) and the sol-gel processing, which consists of the solubilization of silica in sodium hydroxide solution (NaOH2), followed by the precipitation and stabilization of nano-silica, controlling the pH with hydrochloric acid (HCl) (Lima et al., 2011). For nano-silica obtained by sol-gel processing from ash of rice husk, Lima et al. (2011) presented a gain on the compressive strength of the mixtures formulated with 2.5 and 5 wt %-1, replacing the cement mass, when compared to the reference mixture without the nano-silica.
Comparing nano-silicas in suspension and powdered forms, with similar particle size distributions, Quercia, Lazaro, Geus and Browers (2013) related a higher compressive strength for concretes formulated with the suspension of nano-silica. For nano-silica stabilized in polycarboxylate dispersant, Abreu et al. (2017) revealed a gain on the compressive strength, when compared with the reference concrete without nano-silica. Haruehansapong, Pulgern and Chucheepsakul (2014) evaluated the effect of particle size for nano-silica with different specific surface areas. The authors suggested that optimum content of nano-silica, considering the compressive strength, does not depend on size of the particles in these nano-silica suspensions. Khaloo, Mobini and Hosseini (2016) also investigated the effect of specific surface area of nano-silica suspensions. The authors showed that compressive strength of mixtures varies according to the water/powder ratio and to the specific surface area of nano-silica. Comparing powdered nano-silica of different sizes, Givi, Rashid, Aziz and Salleh (2010) also revealed that the optimum content of nano-silica, considering the compressive strength, varies according to the particle size of nano-silica.
For the studies mentioned above, the granulometric distribution of nano-silica was not measured or controlled. So, for the references bellow, the particle size distribution of nano-silicas was determined by the Dynamic Lightening Scattering method (DLS). To assess the effect of particle size, Madani, Bagheri and Parhizkar (2012) investigated the effect of monodispersed particles of nano-silica on hydration of Portland cement pastes. Yu, Spiesz and Brouwers (2014) measured the granulometry of nano-silicas to adjust the granulometric distribution of concretes using the modified Andreasen and Andersen Equation. Quercia, Husken and Browers (2012) also proposed the use of modified Andreasen and Andersen Equation to adjust the granulometry of mixtures containing nano-silica.
The high specific surface area of nano-particles leads to a reduction on the workability or the fluidity of the Portland cement matrices, as published by Senff, Labrincha, Ferreira, Hotza and Repette (2009). And an increase on the water demand and on the consumption of dispersant was verified by Quercia et al. (2012) and Berra, Carassiti, Mangialardi, Paolini and Sebastiani (2012). The gelling effect is another result of the colloidal silica in the ceramic matrix, as reported by Anjos, Ismael, Oliveira and Pandofelli (2008) for nano-bonded refractories. The microstructure of the Portland cement matrix was also affected due to the incorporation of nano-silica. Rong, Sun, Xiao and Jiang (2015) reported a change in the pore size distribution, according to the content the nano-silica. The authors indicated the agglomeration of the nanoparticles as an important effect of nano-silica on the microstructure of the Portland cement matrix. (Error 1: La referencia nd Repette (2009). debe estar ligada) (Error 2: El tipo de referencia nd Repette (2009). es un elemento obligatorio) (Error 3: No existe una URL relacionada)
For these mentioned studies the type of cement evaluated was kept constant, there were no variations related to chemical and mineralogical composition or particle size distribution and specific surface. Thus, considering that interactions between cement characteristics and nano-silica can affect mechanical and rheological properties, as well as the microstructure of Portland cement matrix. The present study evaluates controlled granulometries of nano-silica as an addition to different cements.
Material and methods
A pure clinker (CP) powder was obtained by ball milling for 90 minutes, and sieved through a 200 mesh (75 μm). Portland cements CPV-ARI Votorantim (CPV-V) and CPV-ARI InterCement (CPV-I) were also employed as binders. Three nano-silicas Akzo Nobel Cembinder 8 (nS1), Cembinder 30 (nS2) and Cembinder 50 (nS3) were used as raw materials. The chemical composition of pure clinker and Portland cements were measured on molten samples, using fluorescence spectrometer P'ANalytical Axios Advanced. The specific surface area (S.S.A.) of all raw materials was measured by gas adsorption (B.E.T.) with BELSORP MAX equipment. The density of pure clinker and Portland cements were determined by picnometry of liquids (Table 1). The densities of the nano-silica Cembinder 8 (nS1), Cembinder 30 (nS2) and Cembinder 50 (nS3) were calculated from density and mass concentration of suspensions: 1.4 g cm-3 and 50%, 1.10 g cm-3 and 30%, 1.05 g cm-3 and 15%, respectively, resulting in 2.33, 2.25 and 2.54 g cm-3. The pH and the content of Na2O in the nano-silicas suspensions vary from 9.5 to 10.5, and 0.2 to 0.55 wt %-1, respectively, according to the product datasheet. BASF ADVA 505 poly-carboxylic acid (PC) was used as dispersant additive. The dispersant had a density of 1.06 g/cm3 and the solid concentration of 39.09% at 120oC.

The particles size distribution of pure clinker and Portland cements were determined with a Malvern 2200 laser granulometer. The particles size distribution of the nano-silicas was measured by dynamic lightning scattering (DLS), using Microtac Nano-Flex equipment. Figure 1 (a) shows granulometric distribution of raw materials, considering their frequencies in volume. Nano-silica Cembinder 8 (nS1) showed the coarsest particles, which reveals the presence of particles ranging from a micrometric size (1000 nm) to a nanometric size (< 100 nm). The nano-silica Cembinder 30 (nS2) presented a discontinuous granulometry, composed of particles thicker than 15 nm, and a secondary particles population between 1 and 5 nm. The nano-silica Cembinder 50 (nS3) showed a continuous granulometry, containing two characteristic populations of particles: one ranging from 2 to 10 nm and another thicker than 10 nm. As seen, the nano-silica Cembinder 30 is the finest granulometry, with the largest specific surface area (Table 2). The differences between the specific surface area and granulometry of nano-silicas suggest that coarse particles measured in granulometric analysis, may be composed by an agglomeration of nano-particles. But for the specific surface area, measured by gas adsorption, the nitrogen molecules may access these voids in these agglomerates of small nanoparticles.
The particles size distribution of nano-silicas, pure clinker and Portland cements CPV-V and CPV-I were adjusted by modified Andreasen and Andersen equation, according to Funk and Dinger (1994). Equation 1 with DL = 100 micrometer; DS = 0.001 micrometer (1 nm); and distribu tion coefficients q = 0.37, 0.50, 0.55 and 0.61. These three nano-silica suspensions were selected in order to adjust the granulometric distribution of the cement matrix to the granulometry calculated by the Equation 1. For the mixtures containing 0.85 and 0.42 wt %-1 of nano-silicas, replacing the cement mass, rates were obtained by dividing each nano-silica amount of the previous formulation by 2. Figure 1 (b) shows the cumulative frequency, or Cent Percent Finer Than (CPFT) from Equation 1, of mixtures containing the cements and nano-silicas. Table 2 shows the compositions of these formulations.
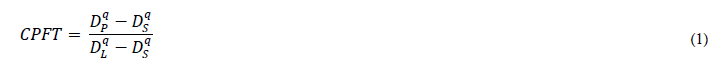
where:
CPFT – Cent Percent Finer Than
DP – Particle diameter;
DS – Particle diameter of smaller particle;
DL – Particle diameter of larger particle;
q – coefficient of distribution.
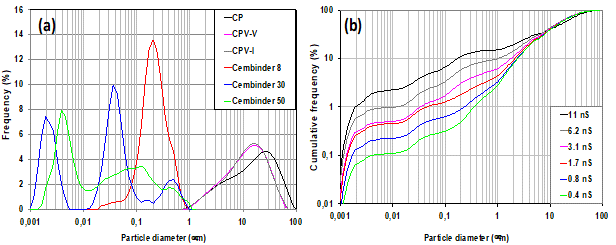
Figure 1. Particle size distribution raw materials (a) (b) Mixtures

The mineralogical composition of pure clinker and Portland cements was obtained by X-ray diffraction from pressed samples, using the Philips MPD1880 X-ray diffractometer (Cu 40 kV 30 mA Kα 2θ = 5-70° - 0.2o s-1). Figure 2 shows the diffractograms of pure clinker and Portland cements CPV-V and CPV-I. The characteristic peak of the gypsum (2θ = 11.6o) was identified only for the Portland cement CPV-V. Similar content of tetra calcium ferro-aluminate phase (C4AF) was identified for all samples (2θ = 12.2o and 60.1o). Tricalcium aluminate (C3A) was identified for the three cements (2θ = 33.2o). Portland cement CPV-I has the highest amount of di and tricalcium silicates (C3S/C2S), followed by Portland cement CPV-V and pure clinker (2θ = 29.5o and 32.2o).
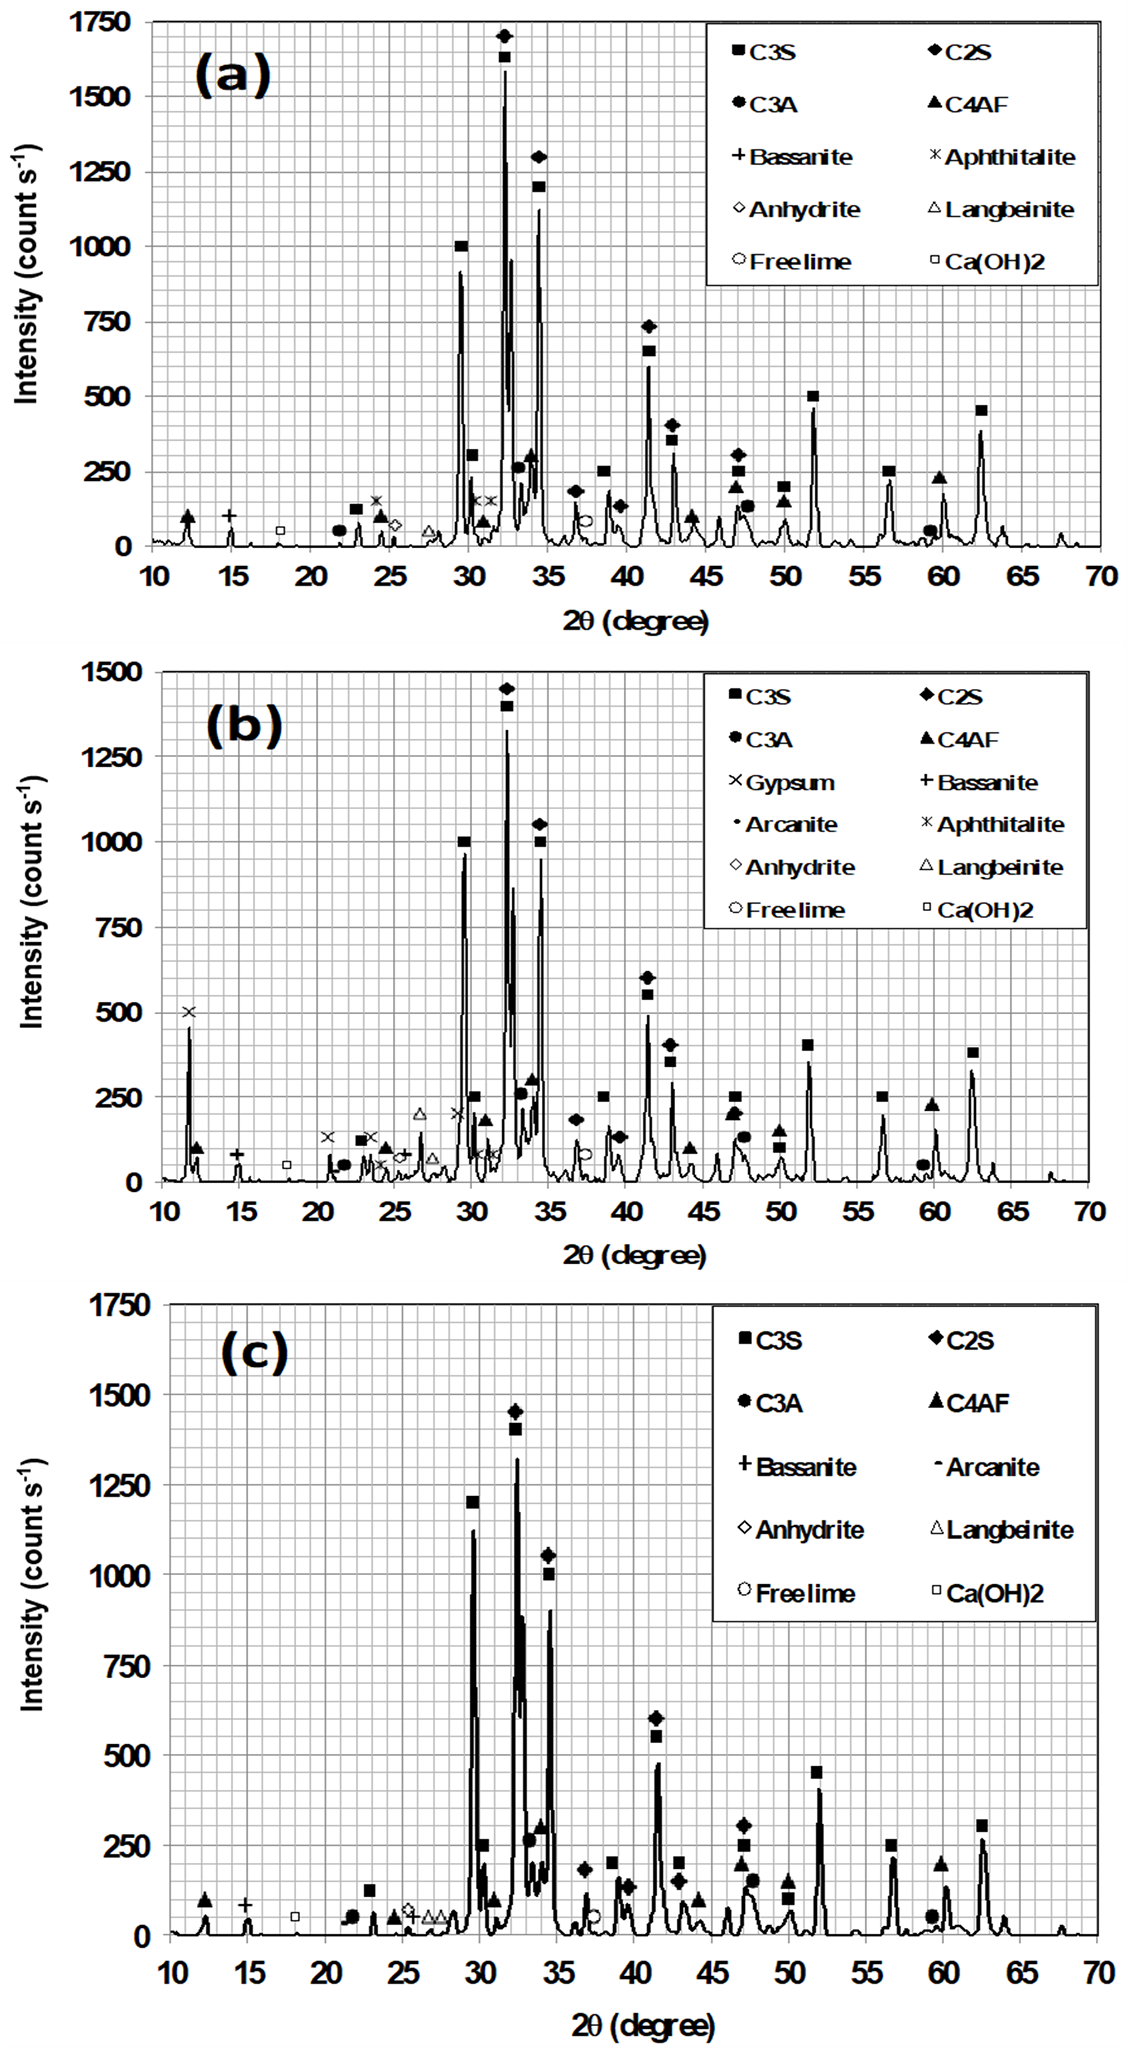
Figure 2. Diffractograms (a) Pure Clinker (b) Portland cement CPV-V (c) Portland cement CPV-I. (C3S) - 3CaO.SiO2, (C2S) - 2CaO.SiO2, (C3A) - 3CaO.Al2O3, (C4AF) 4CaO.Al2O3.Fe2O3, Gypsum - CaSO4.2H2O, Bassanite - CaSO4.1/2.H2O, Arcanite - K2SO4, Anhydrite - CaSO4, Langbeinite - K2Mg2(SO4)3, Aphthitalite - (K, Na)3Na(SO4)2, Free lime – CaO - Portlandite - Ca(OH)2.
Fonte: C1365 (American Society for Testing Materials [ASTM], 2011).
The water demand and the consumption of dispersant were adjusted to obtain a self-compacting rheological behavior for these suspensions, a very small value or close to zero, for the yield stress. The concentration of volumetric solids (VS) in suspensions was calculated from water/solid ratio (w/s); the volumetric surface area (VSA) was calculated from product of the specific surface area (SSA) and the density of compositions, following Funk and Dinger (1994). The initial porosity (P0) was estimated by applying the linear packing model developed by Yu and Standish (1991). The inter particle separation (IPS) of the mixtures was calculated from these results, and is listed in Table 3 (Funk and Dinger, 1994). The nano-silica suspensions and the dispersant were previously diluted with deionized water. The mixing was performed in a laboratory mixer, using a 6 cm diameter axial flow rod, cawles model. Applying the following process: (i) the dry powder was mixed at 586 rpm for 60s; (ii) 2/3 of the suspension (water + dispersant + nano-silicas) were added and mixed at 586 rpm for 120s; (iii) 1/3 of the suspension (water + dispersant + nano-silicas) was mixed at 586 rpm for 120s.

A temperature-controlled rheometer with concentric cylinders geometry was used to measure rheological properties of cement pastes. The rheograms were obtained using a control of the shear rate, varying from 10 to 100 s-1, in 10 s-1 intervals. The shear rate was increased from 10 to 100 s-1 (upper curve) and reduced from 100 to 10 s-1 (lower curve). The rheological behavior of cement pastes was measured 30 seconds after mixing. The tests were performed for 10 g of paste, maintained 30 seconds at each shear rate; values were recorded in the last 3 seconds. All tests were performed at 23oC. Bingham’s model was applied to calculate the yield stress and the viscosity of the suspensions, considering the lower curve. Six cylindrical samples (2:4 cm) were molded and compacted manually in order to avoid mold defects. According to the Brazilian Standard ABNT NBR 8045 (Associação Brasileira de Normas Técnicas [ABNT], 1993), the accelerated compressive strength for concretes can be obtained after an initial curing period of 24 hours, followed by a submerged curing in boiling water (> 100oC) for 2 hours. Since the three cements present different specific surface areas and, consequently, different reactivity rates. The samples were kept at room temperature (22oC) for 24 hours, and during 18 hours immersed in water at 85oC. This method was employed in order to achieve the accelerated compressive strength, avoiding a misunderstanding at 28 days. Li, Huang, Cao, Sun and Sah (2015) showed that this accelerated curing procedure led to a compressive strength 10% higher than the conventional one at 20oC for 28 days. The compressive strength was measured applying a loading rate of 2.5 MPa s-1. Graybel (2015) demonstrated that the increase in loading rate from 0.25 to 1 MPa/s does not affect the compressive strength measured for ultra-high strength concretes.
Results and discussion
The effect of nano-silica on rheological properties of Portland cement matrix was listed in Table 3. The dispersant consumption and water demand of the suspensions were directly affected by the incorporation of nano-silica. An increasing tendency can be observed to obtain a very small value, close to zero, for the yield stress. The high specific surface area (SSA) of nano-particles leads to an increase in the volumetric surface area (VSA) and, consequently, to a reduction in the inter-particle separation (IPS) of these suspensions. The yield stress of the studied mixtures showed values less than 1 Pa, but a value close to 7 Pa was found for the CPV-V 11 nS mixture. The CP 6.2 nS, CPV-V 11 nS, and CPV-V 6.2 nS mixtures showed the lowest inter particle separation (IPS), values close to 25 nm were observed for these formulations.
The effect of inter-particle separation (IPS) on the viscosity of suspensions is shown in Figure 4. Cement pastes containing pure clinker, which have the smallest specific surface area, showed the lowest average viscosity, when compared to Portland cements CPV-V and CPV-I. An increasing trend can be seen when the particles became closer. An atypical value was also obtained for the CPV-V 11 nS mixture that can be attributed to the probable agglomeration of nano-silica, leading to a higher viscosity of the studied compositions. Flatt and Bowen (2006) restricted to van der Walls the forces for modeling the suspensions’ yield stress, which is inversely proportional to the inter particle separation (1 IPS-2). Pileggi, Studard and Pandofelli (2000) presents the concept of particle crowding index (PCI), which relates the inter-particle separation (IPS) and particle diameters. This index is directly related to the viscosity of ceramic suspensions, and also inversely proportional to inter-particle separation.
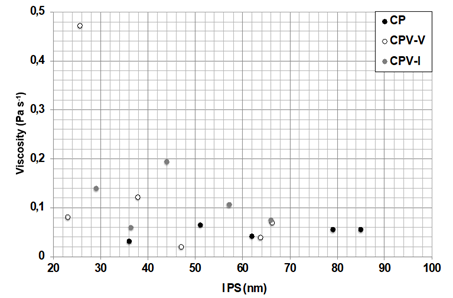
Figure 4. Effect of inter particle separation (IPS) on the plastic viscosity.
According to Nouri-Khezrabad, Braulio, Pandolfelli, Golestani-Fard and Rezaie (2013), colloidal silica can act as a flocculant or coagulant for ceramic suspensions, due to the forces of van der Waals and particle-to-particle bridging. The gelling effect can be obtained due to the siloxane bonds, which are accelerated by the calcium and magnesium hydroxides available during the hydration of Portland cement. According to Funk and Dinger (1994) the IPS is a major determinant of the rheology, for IPS distances less than 50 nm may flow, but they will exhibit high viscosity and also very severe dilatancy as shear rates increase. Browers and Radix, apud Quercia et al. (2012), reported a constant water layer of 25 nm for several powders tested, considering the mini spread-flow test. Resulting in a minimum IPS of 50 nm (IPS = 2b x 25 nm).
Figure 4 may be divided in two regions, for viscosities less than 0.1 MPa.s the suspensions present a good fluidity due to the dispersed condition of nano-silica. However, higher viscosity values indicate that the collisions between particles increases, due to the greater number of particles and the shorter distance between them. If there is not enough space for flowing, the nano-particles become agglomerated, leading to an increase in the viscosity of the suspensions. Thus, the flocculation and growth of these agglomerates depends on the inter particle separation and the content of nano-silica.
Figure 5 presents the effect of water/solids on the compressive strength of cementitious matrices containing nano-silica. When large amounts of nano-silica were added, an increase in the water demand was required, as seen on Table 3, leading to a reduction in the compressive strength. The dotted and dashed lines represent the exponential equations adjusted for mixtures formulated with Portland cement CPV-V and pure clinker, respectively. The continuous line is an average curve calculated from both. For Aictin (2000) due to variations in the strength efficiency from different supplementary cementitious materials, there is a wide range of water/binder for a given strength. If the efficiency of these different supplementary cementitious materials is not known from previous experiments, an average curve can be used for an initial estimative of the mixture.
Therefore, this approach can also be used in the formulation of cement pastes containing nano-silica. The specific surface area of cement can be used in order to estimate whether the compressive strength and water/solid relationships were represented by dotted, continuous or dashed lines.
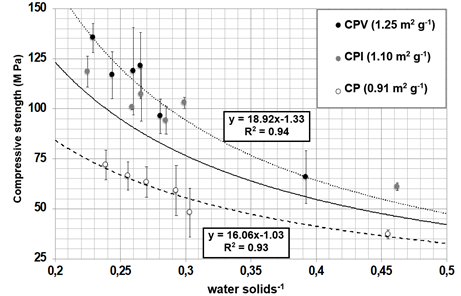
Figure 5. Effect of water/powder on compressive strength.
Thus, considering that pure clinker and Portland cements do not show a considerable difference in chemical and mineralogical composition and represent about 90% of binder. And that its specific surface area, considerably smaller than the specific surface area of nano-silica, is the main variable for mechanical performance. This result indicates that the low content of nano-silica or its agglomerated condition does not contribute effectively to the reactive surface area. For mixtures containing 10 and 20 of silica fume, and a fixed water/solids ratio Mendes, Repette, and Reis (2017) demonstrated that the content of silica fume contributes more to the surface reactivity than the nano-silica Cembinder 8, considering the compressive strength.
Figure 6 (a, b) shows the SEM micrographies of mixtures formulated with Portland cement CPV-V and 11 wt %-1 (a) and 3 wt %-1 (b) of nano-silica, respectively. Large agglomerates of nano-particles can be observed, when the content of nano-silica increases to 11 wt %-1, the size of these agglomerates also increases. Figure 6 (c) shows the SEM micrographies of mixtures formulated with Portland cement CPV-V and 1.7 wt %-1 of nano-silica. A change in the microstructure of nano-particles can be seen. The microstructure of nano-silica was arranged in a porous three-dimensional structured, with immersed grains of calcium hydroxide. Figure 6 (d) presents the SEM micrographies of mixture formulated with Portland cement CPV-V and 0.8 wt %-1 nano-silicas. As seen, nanoparticles adsorbed in Portland cement particle surface were observed in the delimited region. The chemical composition of this delimited region was obtained by the EDS probe, and shown in Figure 6 (f). The presence of silica and calcium, as well as iron and aluminum peaks, probably indicates a Portland cement particle covered by nano-silica adsorbed on the cement surface. Or, hydration products such as C-S-H/C-A-H/Afm/CH and others, which also have these chemical elements. Figure 6 (e) shows the mixture composed of cement CPV-V and 0.4 wt %-1 of nano-silicas. Nanoparticles were well dispersed and any agglomeration of nano-silica was identifiable.
The SEM micrographies published by Xu, Liu, Guo, Du and Hou (2012) also showed a three-dimensional porous structure of colloidal silica in a ceramic matrix. The results of mercury intrusion porosimetry published by Mendes and Repette (2019) showed this modification in the nanometric pores, according to the content of nano-silica. The microstructure observed in Portland cement pastes containing nano-silica suggests: in an initial condition, for a very low volume; nano-silica can be adsorbed to layers on the surface of Portland cement. When volume of nano-silica reaches enough content to cover the surface of Portland cement, nanoparticles form a three-dimensional porous structured. Finally, when the content of nano-silica reaches a high volume, it becomes agglomerated. If nano-silica was adsorbed on cement surface, this change in microstructure shall vary according to the specific surface area of the adsorbent material. Therefore, this change from adsorbed in layers to a three-dimensional porous or to agglomerated, dependents on the content of nano-silica and inter-particle separation, or the number of particles and probability of collisions between particles (Goudeli, Eggersdorfer & Pratsinis, 2015).
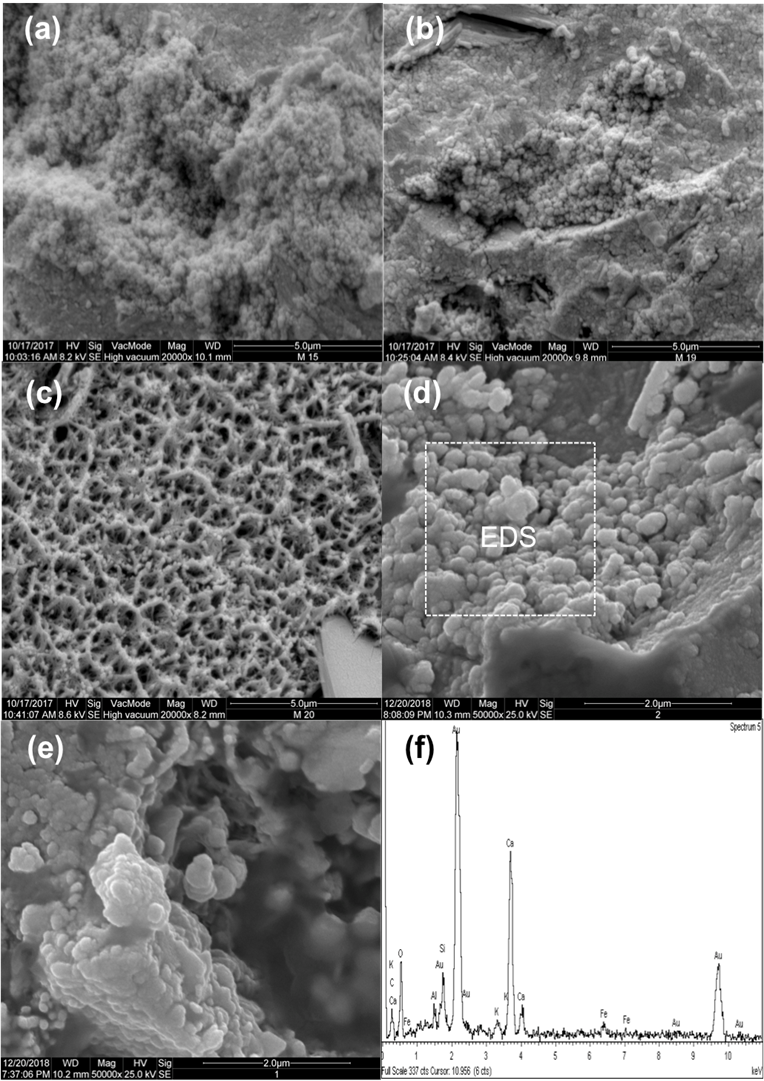
Figure 6. SEM micrographies of mixtures (a) CPV-V + 11 nS, (b) CPV-V + 3.1 nS, (c) CPV-V + 1.7 nS (d) CPV-V + 0.8 nS (e) CPV-V + 0.4 nS, (f) chemical composition by EDS of CPV-V + 0.8 nS.
Conclusion
Nano-silica content increases the water demand and the consumption of dispersant, and consequently, the reduction in the inter particle separation leads to an increase in viscosity of the suspensions.
For the same particle size distribution of nano-silica, the mechanical performance of cementitious matrix is related mainly to the specific surface area of cements.
Depending on the quantity, the nano-silica microstructure in the Portland cement matrix changes from a layered adsorbed structure, to a porous structure, or to an agglomerated structure.
Acknowledgements
The authors would like to thank the Araucaria Foundation, Coordination for the Improvement of Higher Education Personnel (CAPES) and National Council of Scientific and Technological Development (CNPq).
References
Abreu, G. B., Costa, S. M. M., Gumieri, A. G., Calixto, J. M. F., França, F. C., & Quinõnes (2017). Mechanical properties and microstructure of high-performance concrete containing stabilized nano-silica. Revista Matéria, 22(2). doi: 10.1590/s1517-707620170002.0156
Aictin, P. C. (2000). Concreto de alto desempenho. São Paulo, SP. Pini.
American Society for Testing Materials [ASTM]. (2011). ASTM C1365 - Standard method for determination of the proportion on phases of Portland cement and Portland cement clinker using powder diffraction analysis. Montgomery, PA: ASTM.
Anjos, R. D., Ismael, M. R., Oliveira, I. R., & Pandofelli, V. C. (2008) Workability and setting parameters evaluation of colloidal bonded refractory suspensions. Ceramics International, 34(1), 165-171. doi: 10.1016/j.ceramint.2006.09.004
Associação Brasileira de Normas Técnicas [ABNT]. (1993). ABNT NBR 8045: Concreto - Determinação da resistência acelerada à compressão – Método da água em ebulição. Rio de Janeiro, RJ. ABNT.
Berra, M., Carassiti, F., Mangialardi, T., Paolini, A.E., & Sebastiani, M. (2012) Effects of nanosilica addition on workability and compressive strength of Portland cement pastes. Construction and Building Materials, 35, 666-675. doi: 10.1016/j.conbuildmat.2012.04.132
Fernandes, L., Sabino, M. G., & Rossetto, H. L. (2014). Método de extração de sílica da casca do arroz. Cerâmica, 60, 160-163. doi: 10.1590/S0366-69132014000100022
Flatt, R. J., & Bowen, P. (2006). Yodel: a yield stress model for suspensions. Journal of American Ceramic Society, 89(4), 1244-1256. doi: 10.1111/j.1551-2916.2005.00888.x
Funk, J. E., & Dinger, D. (1994). Predictive process control of crowed particulate suspension. London, UK: Kluwer Publishers.
Givi, A. N., Rashid, S. A., Aziz, F. N. A., & Salleh, M. A. M. (2010). Experimental investigation on the size effects of SiO2 nano-particles on the mechanical properties of binary blended concrete. Composites Part B: Engineering, 41(8), 673-677. doi: 10.1016/j.compositesb.2010.08.003
Goudeli, E., Eggersdorfer, M. L., & Pratsinis, S. E. (2015). Coagulation-agglomeration of fractal-like particles: structure and self-preserving size distribution. Langmuir, 31(4), 1320-1327. doi: 10.1021/la504296z
Graybel, B. A. (2015). Compression testing of ultra-high performance concrete. Advances in Civil Engineering Materials, 4(2), 102-112. doi: 10.1520/ACEM20140027
Haruehansapong, S., Pulgern, T., & Chucheepsakul, S. (2014). Effect of particle size of nanosilica on the compressive strength and the optimum replacement content of mortar containing nano-SiO2. Construction and Building Materials, 50, 471-477. doi: 10.1016/j.conbuildmat.2013.10.002
Khaloo, A., Mobini, M. H., & Hosseini, P. (2016). Influence of different types of nano-SiO2 particles on the properties of high-performance concrete. Construction and Building Materials, 113, 188-201. doi: 10.1016/j.conbuildmat.2016.03.041
Li, W., Huang, Z., Cao, F., Sun, Z., & Sah, S. P. (2015). Effects of nano-silica and nano-limestone on flowtability and mechanical performance of ultra high performance matrix. Construction and Building Materials, 95, 366-374. doi: 10.1016/j.conbuildmat.2015.05.137
Lima, S. P. B., Vasconcelos, R. P., Paiva, O. A., Cordeiro, G. C., Chaves, M. R. M., Toledo Filho, R. D., & Fairbairn, E. M. R. (2011). Production of silica gel from residual husk ash. Química Nova, 34(1), 71-75. doi: 10.1590/S0100-40422011000100014
Madani, H., Bagheri, A., & Parhizkar, T. (2012). The pozzolanic reactivity of monodispersed nanosilica hydrosols and their influence on the hydration characteristics of Portland cement. Cement and Concrete Research, 42(12), 1563-1570. doi: 10.1016/j.cemconres.2012.09.004
Mendes, T. M., & Repette, W. L. (2019). Effect of nano-silica on Portland cement matrix. Revista Ibracon de Estruturas e Materiais, 12(6), 1383-1389. doi: 10.1590/s1983-41952019000600009
Mendes, T. M., Repette, W. L., & P. J. Reis. (2017). Effects of nano-silica on mechanical performance and microstructure of ultra-high strength concrete. Cerâmica, 63(367), 387-394. doi: 10.1590/0366-69132017633672037
Nouri-Khezrabad, M., Braulio, M. A. L., Pandolfelli, V. C., Golestani-Fard, F., & Rezaie, H. R. (2013). Nano-bonded refractories castables. Ceramics International, 39(4), 3479-3497. doi: 10.1016/j.ceramint.2012.11.028
Pileggi, R. G., Studard, A. R., & Pandolfelli, V. C. (2000). Um modelo para previsão da viscosidade mínima de suspensões cerâmicas. Cerâmica, 46(299), p. 160-165. doi: 10.1590/S0366-69132000000300008
Quercia, G., Husken, G., & Browers, H. J. H. (2012). Water demand of amorphous nano silica and its impact on the workability of cement paste. Cement and Concrete Research, 42(2), 344-357. doi: 10.1016/j.cemconres.2011.10.008
Quercia, G., Lazaro, A., Geus, J. W., & Browers, H. J. H. (2013). Characterization of morphology and texture of several amorphous nano-silica particles used in concrete. Cement and Concrete Composites, 44, 77-92. doi: 10.1016/j.cemconcomp.2013.05.006
Rong, Z., Sun, W., Xiao, H., & Jiang, G. (2015). Effects of nano-SiO2 particles on the mechanical and micro-structural properties of ultra-high performance cementitious composites. Cement and Concrete Composites, 56, 25-31. doi: 10.1016/j.cemconcomp.2014.11.001
Saleh, N. J., Ibrahim, R. I., & Salman, A. D. (2015). Characterization of nano-silica prepared from silica sand and its application in mortar using optimization technique. Advanced Powder Technology, 26(4), 1123-1133. doi: 10.1016/j.apt.2015.05.008
Senff, L., Labrincha, J. A., Ferreira, V. M., Hotza, D., & Repette, W. L. (2009). Effect of nano-silica on rheology and fresh properties of cement pastes and mortars. Construction and Building Materials, 23(8), 2487-2491. doi: 10.1016/j.conbuildmat.2009.02.005
Xu, H., Liu, J., Guo, A., Du, H., & Hou, Z. (2012). Porous silica ceramics with relative high strength and novel bi-modal pore structure prepared by a TBA-based gel-casting method. Ceramics International, 38(2), 1725-1729. doi: 10.1016/j.ceramint.2011.09.013
Yu, A. B., & Standish, N. (1991). Estimation of the porosity of particle mixtures by a linear-mixture packing model. Indsutrial & Engineering Chemistry Research, 30 (6), 1372-1385. doi: 10.1021/ie00054a045
Yu, R., Spiesz, P., & Brouwers, H. J. H. (2014). Effect of nano-silica on the hydration and microstructure development of Ultra-High-Performance Concrete (UHPC) with a low binder amount. Construction and Building Materials, 65, 140-150. doi: 10.1016/j.conbuildmat.2014.04.063