Geografia
The impacts of climate change on rainfall modeling in the Pantanal of Mato Grosso do Sul
The impacts of climate change on rainfall modeling in the Pantanal of Mato Grosso do Sul
Acta Scientiarum. Technology, vol. 43, e55112, 2021
Universidade Estadual de Maringá
Recepción: 05 Agosto 2020
Aprobación: 28 Octubre 2020
Abstract: The most significant and influential meteorological element in environmental conditions and human activities is precipitation. The objective of this study was to adjust eight probability distributions to monthly, seasonal and annual rainfall data in the Pantanal of Mato Grosso do Sul, Brazil, using a time series of data (1983-2013) by the National Meteorological Water Agency (ANA). The performance evaluation of different probability distribution models was assessed by the quality of fit of the selected probability distributions for precipitation data. Quality tests as chi-square, Kolmogorov-Smirnov (KS) and Anderson-Darling (AD), the information criteria as Akaike (AIC) and the Bayesian criterion (BIC) were used. Then the mean root square error (RMSE) and the coefficient of determination (R2) were applied. The analyzes were made monthly, annually and by seasons. The 3-parameter Lognormal distribution performs the best for all twelve months and provides the best-fit to the monthly rainfall data. Thus characterizing a dry period that runs from May to September and a rainy period between the months of October and April, it was observed that the 3-parameter Lognormal distribution has best adjustment for spring and summer, and for winter and autumn the 2-parameter Gamma and 3-parameter Gamma distribution performed better. For annual observations, the function that best fits is 3-parameter Weibull distribution.
Keywords: Rainfall, adjustments, probability distribution, quality tests, modeling.
Introduction
Considered a national heritage site and a biosphere reserve, the Pantanal is the largest floodplain on the planet and is home to an invaluable ecosystem. Located in the center of South America (SA), the Pantanal is included in the continuous floodplain of the Upper Paraguay basin, which occupies 361,666 km2, where highly diverse flora and fauna are sustained by seasonal floods (Louzada, Bergier, & Assine, 2020). Its territory has approximately 160,000 km2 divided between Paraguay, Bolivia and Brazil (Silva & Abdon, 1998; Junk & Cunha, 2005; Teodoro et al., 2016). The Brazilian territory occupies about 40% of this basin. The Brazilian Pantanal is divided into 7 municipalities in the state of Mato Grosso (MT) - (35%) and 9 municipalities in the state of Mato Grosso do Sul (MS) - (65%) (Silva & Abdon, 1998).
Quantitative data are lacking as input into environmental planning, as well as various types of socioeconomic and socio-environmental modeling methods, which can be combined with ecological or hydrological data in integrated approaches to connect human systems to environmental indicators, mainly in Protected areas (PAs), where PAs are fundamental for biodiversity conservation, yet their impacts on nearby residents are contested (Gray et al., 2018; Santiago, Correia Filho, Oliveira-Júnior, & Silva Junior, 2019;Naidoo et al., 2019).
Recent research has begun to report the interrelationships between economic indicators, livestock and a changing climate (Araújo et al., 2018; Bergier et al., 2019), but socio-environmental/rainfall issues beyond livestock are still less understood. There is also considerable literature on environmental planning in the Pantanal, for example, several government reports describing strategies for environmental conservation and economic development (Oliveira, 2002), of which the Conservation Plan for the Upper Paraguay Basin (O PCBAP, in Portuguese), is probably the most relevant (Brasil, 1997). This report identified some of the main challenges of environmental management in relation to the Pantanal, such as erosion or pollution of water courses with sediments, and sought to recommend appropriate economic development strategies. In this sense, the report is considered a precursor to ecological-economic zoning, recommended for spatial governance driven by data from the Pantanal (Schulz et al, 2019).
Much research has been carried out in the Pantanal on socio-environmental changes such as: agricultural transformation and its socio-economic and cultural implications, for example, Oliveira-Júnior et al. (2020), investigated the temporal variability of fire outbreaks in different biomes and their relationship to rainfall patterns in the state of MS. The Pantanal revealed the greatest occurrence of fire foci in relation to the Cerrado and Atlantic Forest. The largest records of fire foci in the Pantanal are caused by longer periods of drought and anthropogenic activities (based on extensive agriculture) - (Teodoro et al., 2015; Teodoro et al., 2016); Thielen et al. (2020) analyzed the spatial and temporal dynamics of rainfall and extremes resulting from the Upper Paraguay basin, together with a co-assessment of global sea surface temperature (SST) data; Ivory, McGlue, Spera, Silva, and Bergier (2019) using vegetation and remote sensing climate data to better understand the relationships between rainfall, flood pulse and vegetation in the wetland, rainfall is regionally synchronous, vegetation responses differ based on position in relation to flooded areas , suggests that the importance of the flood pulse time for vegetation productivity in flooded areas means that local conditions in wet areas may be the strongest controls in biogeochemical processes; Oliveira, Pla-Pueyo, and Hackney (2018) studied the natural and social aspects that affected wetlands and possible future impacts due to climate change and the effects of human activities, sensitive to changes in the flood, drought and deforestation regime, intrinsically related to global changes and places in the climate and intensification of livestock activities, which include deforestation and the introduction of cultivated pastures; agricultural transformation and its socioeconomic and cultural implications, (Rossetto, 2009; Wantzen et al., 2008; Calheiros, Oliveira, & Padovani, 2012; Ioris, 2012; Rossetto & Girardi, 2012; Bergier, 2013; Lacerda, 2017; Lacerda & Lima, 2015); conflicts over fishing (Mateus, Penha, & Petrere, 2004; Rossetto & Tocantins, 2015; Alho & Reis, 2017; Ávila, Silva, & Ferraz, 2018; Chiaravalloti, 2017; 2019); tourism (Rabelo, Arts, Girard, Ioris, & Figueiredo, 2017; Tortato & Izzo, 2017; Arts et al., 2018); traditional and local ecological knowledge (Calheiros, Seidl, & Ferreira, 2000; Abreu, McManus, & Santos, 2010; Silva, Silveira, & Nogueira, 2014; Girard, 2012; Bortolotto, Amorozo, Guarim Neto, Oldeland, & Damasceno-Junior, 2015); invasive species and biodiversity (Junk et al., 2006; Calheiros et al., 2012; Mamede, Benites, & Alho, 2017); social implications of the development of the water infrastructure, including dams and waterways (Hamilton, 1999; Junk & Cunha, 2005; Calheiros et al., 2012; Bergier, 2013;Crabb, Laing, Whitney, & Saito, 2017; Schulz, Martin-Ortega, Ioris, & Glenk, 2017; Schulz, Martin-Ortega, & Glenk, 2018); implications of climate change and variability (Silva et al., 2014; Ioris, Irigaray, & Girard, 2014; Araújo et al., 2018; Bergier et al., 2018, 2019); laws, policies and policies of the Pantanal (Oliveira, 2002;; Safford, 2010, 2012; Tozato, Dubreuil, & Théry, 2014). However, the gaps considered in the research remain.
The objective of this study is to model the historical rainfall series to determine the probability distribution that best fits the rainfall data in the Pantanal region, Mato Grosso do Sul, in central-western Brazil.
Material and methods
Study Area
The Pantanal is located between the parallels 16 and 22° S longitude and the meridians 55 and 58° W longitude, occupies an area in the Central West region of Brazil of 189,000 km2, and is divided between states MS (65%) and MT (35%), according to the Geographical Dictionary of Brazilian Institute of Geography and Statistics (Instituto Brasileiro de Geografia e Estatística [IBGE], 2010), with an average altitude of 110 m and a slope: from 6 to 12 cm per kilometer in the east-west direction and from 1 to 2 cm per kilometer in the north-south (N-S) direction (Figure 1).
In the state of MS, the following municipalities belong to the Pantanal of MS: Anastácio, Aquidauana, Bodoquena, Corumbá, Coxim, Miranda, Porto Murtinho and the main rivers that descend from the plateau to the plains are: from north to south, Paraguay, Bento Gomes, Cuiabá, São Lourenço - Itiquira, Taquari, Negro, Aquidauana - Miranda, Nabileque and Apa.
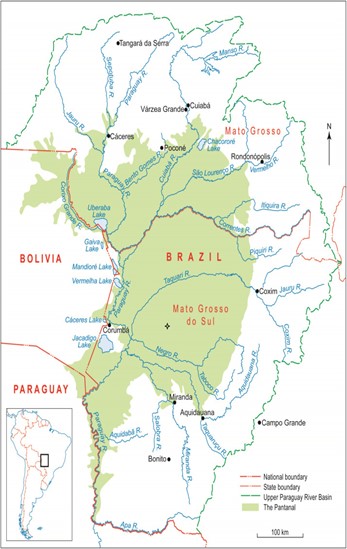
Figure 1. Location and extent of the Pantanal wetland in South America. Outline of the Pantanal based on Assine, Merino, Pupim, Macedo, and Santos (2015) and Schulz et al., 2019.
Climate in the Pantanal
The climate of Pantanal is classified as the “Aw” type or tropical with dry winter season (according to the Köppen-Geiger classification), with two defined seasons: i) dry (May to September) and ii) rainy (October to April). The annual average precipitation is 1,400 mm. Precipitation is in the range 800-1,600 mm, but in some years it can reach up to 2,000 (Alho & Silva, 2012). During the rainy season, floods occur and river water floods the low-lying areas of the Pantanal. The water level is highest in January and February, during March the water level slowly decreases. In contrast, during the dry season, water levels are low and lagoons and swamps dry out (Campos, 1969; Teodoro et al., 2016). Alho, Lacher, and Gonçalves (1988) showed the different features of the Pantanal determined by the relief conditions and climatic interactions in addition to the strong influence of neighboring biomes, such as the Cerrado, Amazonia and the Bolivian and Paraguayan Chacos.
Historical series of monthly rainfall
The historical series of rainfall data in the Pantanal region, MS (Figure 1)used in this study span a 30 year period from 1983 to 2013. The present study are used the average monthly, seasonal and annual rainfall data. The historical data were obtained from the hydro-meteorological database of the National Water Agency (Agência Nacional de Água [ANA, 2008], available on the Hidroweb portal - Hydrological Information System (http://www.ana.gov.br/). The criteria for the use of the data series, it was considered only the use of consistent data, with a minimum of 15 years, not being admitted years with annual failure percentage greater than 10%.
Probability distribution functions
In order to describe the behavior of rainfall data at a particular area it is required to identify the distribution, which best-fit the data. In this study eight probability distributions namely 2-parameter Weibull (W2P), 3-parameter Weibull (W3P), 2-parameter Rayleigh (RA2P), 2-parameter Gamma (G2P), 3-parameter Gamma (G3P), 2-parameter Lognormal (LN2P), 3-parameter Lognormal (LN3P) and Maximum Gumbel distributions (GUM) are used to model the rainfall data in the in the Pantanal region. The probability density functions (pdfs), corresponding cumulative distribution functions (cdfs), domains and parameters for these distributions are presented in Table 1.
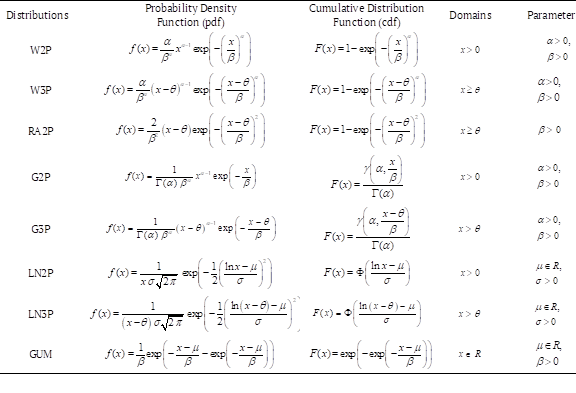
Legend: α is the shape parameter; β is the scale parameter; µ and Importar imagen are the location parameters; Importar imagen is the cdf of the standard normal distribution and Importar imagen, is the lower incomplete Gamma function.
It is known that several methods can be used to estimate the parameters of probability distributions, for example the maximum likelihood method, method of moments, least square method and method of L-moments. In this study the commonly used maximum likelihood method is applied to determine the estimates of parameters of each probability distribution. For more information about the parameter estimation method see: Rao (1973);Montgomery and Runger (1991); Coles (2001).
Goodness of fit tests and model selection criteria
Assessing the performance of different probability distribution models is necessary to provide more accurate information about rainfall at a particular location. In this study, in order to assess the goodness of fit (GOF) of the selected probability distributions for rainfall data the goodness of fit tests such as the chi-squared test, Kolmogorov-Smirnov test (KS) and Anderson-Darling test (AD) are first applied and next the information criteria such as the Akaike information criterion (AIC) and Bayesian information criterion (BIC) are used. Also, the root mean square error (RMSE) and the coefficient of determination (R2) are applied. The goodness of fit tests are briefly described below. The chi-squared test, Kolmogorov-Smirnov test and Anderson-Darling test are used to decide if the rainfall data follow the specified distribution.
Chi-squared test
Chi Squared test is applied when the data are arranged into bins (subintervals). The test statistic is given by
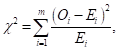 [1]
[1]Where, Oi is observed frequency for bin i and Ei is the expected frequency for bin i. The expected frequency is calculated by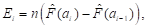 where
where  denotes the estimated cdf and
  are the lower and upper limits for bin i. The expected frequency should be at least 5. The hypothesis that data follow specified distribution is rejected at the significance level α if the test statistic
 is greater than the the critical value
  of the
  distribution, k is the number of estimated parameters and m is the number of bins.
Kolmogorov-Smirnov test
Kolmogorov-Smirnov (KS) test is based on the maximum difference between the sample cdf and the theoretical cdf. The KS test statistic is given by Equation (2):
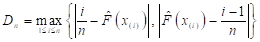 [2]
[2]Where, are observations in ascending order, so that
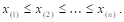 The hypothesis that data follow specified distribution is rejected at the significance level α if the test statistic Dn is greater than the critical value of the KS test Dn (α ).
Anderson-Darling test
Anderson-Darling (AD) test is a modification of the KS test. This test is considered to be best a suitable GOF test because it gives more weight to the tails of the distribution than does the KS test. The AD test statistic is given by Equation (3):
 [3]
[3]The hypothesis that data follow specified distribution is rejected at the significance level α if the test statistic A2 is greater than the critical value of the AD test.
Akaike information criterion
The Akaike information criterion (AIC) is known as commonly used model selection criterion that is calculated based on the maximized value of the log-likelihood function for the estimated model (Akaike, 1974). The AIC can be calculated as follows (Equation 4):
 [4]
[4]Where, lnL is the maximized value of the log-likelihood function for the estimated model, k is number of parameters to be estimated and n is number of observed data.
Bayesian information criterion
The Bayesian information criterion (BIC) is another commonly used information criterion and it is closely related to the AIC (Schwarz, 1978). The BIC can be calculated as follows (Equation 5):
 [5]
[5]Coefficient of determination
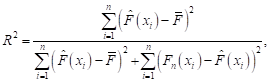
The coefficient of determination (R2) is utilized to measure the linear relationship between the observed and predicted probabilities of the distribution and is calculated as follows (Equation 6):
 [6]
[6]where is the estimated cdf,
  and
and  is the empirical distribution function, defined as follows
 where Importar imagen if and 0 otherwise.
Root mean square error
The root mean square error (RMSE) is based on the difference between the observed and predicted probabilities of the distribution and is calculated as follows (Equation 7):
 [7]
[7]The smaller values of X2, KS, AD, AIC, BIC, RMSE and highest values of R2 indicate the better fit of the theoretical distribution to the rainfall data than others.
Results and discussion
Statistical properties of monthly
annual and seasonal rainfall
Tables 2 and 3 present the descriptive statistics include mean, standard deviation (SD), minimum, maximum, median, coefficient of variation (CV%), coefficient of skewness and coefficient of kurtosis of monthly, annual and seasonal rainfall data, respectively. It was observed, that month January has the highest mean rainfall with the value 200.72 mm, while July has the lowest mean rainfall with the value 21.41 mm. The highest mean rainfall was observed in summer season with the value 163.57 mm and the lowest in winter with the value 35.34 mm. In general, in the spring and summer the highest maximum values of the mean rainfall, maximum, median and standard deviation were observed, similar to the results obtained previously by Teodoro et al. (2015) and Teodoro et al. (2016).


It was found that the values of coefficient of skewness are positive for all months and seasons, that indicate that all distributions are positively skewed to the right. The skewness for eight months are greater than 1, thus can be regarded the data as highly positively skewed, and three months lie within range 0.5-1, thus the data are moderately positively skewed. The coefficient of kurtosis is in the range 0.63-7.14. The months with high kurtosis are March to September, that is, rainfall data sets tend to have heavy tails, or outliers. The skewness for autumn and winter are greater than 1, that indicate the data are highly skewed to the right too. Furthermore, the coefficient of kurtosis is in the range 0.93-6.88. In winter and autumn the highest values of coefficient of kurtosis were observed (especially in winter), indicating a positive leptokurtic series in the heavy tail. The maximum value of CV% was observed in the winter with the value 113.34%, and furthermore, the highest value is in month August with the value 131.90%, which indicate a large fluctuation in the rainfall data in this season and month, respectively.
The distribution of rainfall in the Pantanal region via boxplot showed high variability in the time series in both seasonal and monthly scales, mainly in relation to the median and interquartile range - (Figure 2a). The registered monthly accumulations were highly variable, with emphasis on the summer and winter seasons (Figure 2b). The rainfall producing systems that contribute to the total rainfall recorded in the Pantanal are: the Frontal Systems (FS), South Atlantic Subtropical Anticyclone (SASA) and Upper Tropospheric Cyclonic Vortex – (UTCV), Chaco Low (CL), Bolivian High (BH), Low-Level Jet (LLJ) and South Atlantic Convergence Zone (SACZ) and Maden-Juliana Oscillation (MJO) – (Rao & Hada, 1990; Gan, Kousky, & Roupelewski, 2004; Teodoro et al., 2016; Teodoro et al., 2015).
Figure 2. Boxplot of mean rainfall (mm), (a) monthly and (b) seasonal.
Tables 4 and 5 show the maximum likelihood estimates of the parameters of the eight pdfs for the monthly, seasonal and annual data, respectively.
Probability distributions of monthly rainfall
When modeling rainfall by several pdfs, we can conclude that there are several acceptable models. In this study, the selection of the most appropriate pdf is based on the total score from all GOF tests and model selection criteria. This approach is chosen in situations if it is not clear which model to choose, or it is difficult to choose the best model. The pdfs are ranked based on their performances measured by the results of the GOF tests and model selection criteria. The GOF tests and model selection criteria are ranked from one (best-fit) to eight (least-fit) for all pdfs. The smallest ranking score indicates the best-fit.
The values of GOF tests and model selection criteria for monthly rainfall are summarized in Tables 6(a, b, c, d, e, f, g, h, i, j, k and l). The ranks of the pdfs according to the GOF values are also presented in Tables 6(a-l). Table 7 presents best ranked pdfs using different GOF tests and model selection criteria for each month and finally, Table 8 presents the top three pdfs for monthly rainfall.
The results from Tables 6-8 shown that the LN3P, G3P and GUM are the top three pdfs for modelling the monthly rainfall data in the Pantanal region. The results show the flexibility and efficiency of the LN3P distribution. The LN3P performs the best according to chi-square test, AD test (except April, where performs the best GUM, but LN3P is second the best), RMSE and R2. The LN3P with minimum total rank performs the best for all twelve months and thus provides the best-fit to the monthly rainfall data in the Pantanal region.The G3P ranks the second best for seven months (January, February, June, August, September, November, December), and GUM ranks the second best for four months (March, April, May, October). These distributions can be considered as a possible alternative to modeling the monthly rainfall data in the Pantanal region.
Probability distributions of seasonal and annual rainfall
The values of GOF tests and model selection criteria and the ranks of the pdfs for seasonal and annual data are summarized in Tables 9, 10, 11 and 12. Table 13 presents the best ranked pdfs using different GOF tests and model selection criteria for each season and annual data. Table 14 presents the top three pdfs for seasonal and annual rainfall.
The results from Tables 9-11 and 14, 15 indicate that the LN3P provides the best-fit to the rainfall data for summer and spring. This distribution ranks first and performs the best according to all GOF tests and model selection criteria. Second the best for these two seasons is the G3P. For autumn performs the best G3P and for winter the G2P. These pdfs can be selected as the most suitable for modelling the rainfall for autumn and winter, respectively, while a second potential alternative for autumn is the LN3P and for winter the G3P. Figure 3 shows the histograms and eight pdfs fitted to the seasonal rainfall data. Graphically it can be observed that the LN3P provides the best-fit for summer and spring, whereas the LN2P provides the poorest fit. Similarly, the G3P and G2P fit the best for winter and autumn, respectively.
Figure 4 shows the histograms and eight pdfs fitted to the annual rainfall data. Graphically it can be observed that the W3P provides the best-fit, the W2P fit the histogram to a lesser degree and the LN2P provides the poorest fit. For annual rainfall data the W3P, W2P and G3P are the top three pdfs. The W3P ranks first and performs the best according to four GOF, namely chi-square test, AD test, RMSE and R2. The W2P performs the best according the AIC and BIC, while the W3P performs the second best. The W3P can be considered as the most suitable pdf for modeling annual rainfall data in the Pantanal region.


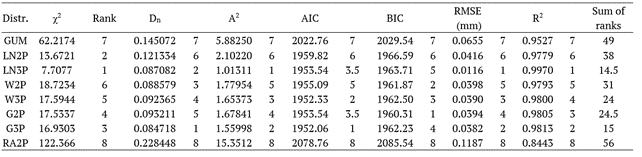
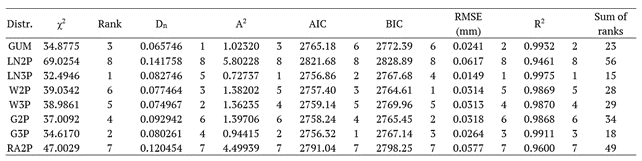
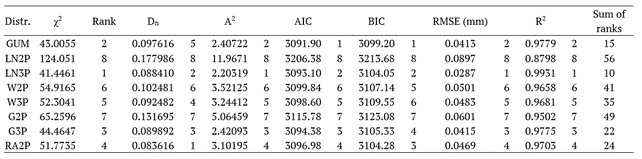
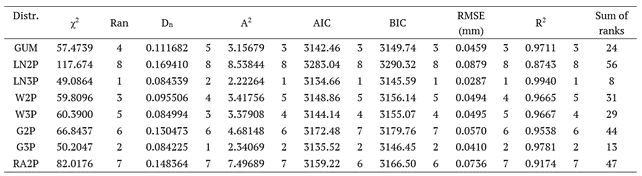
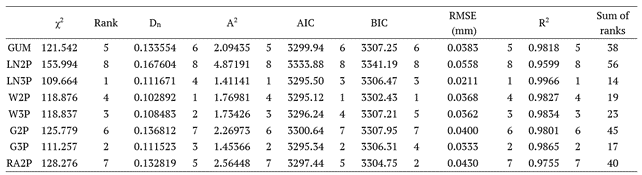
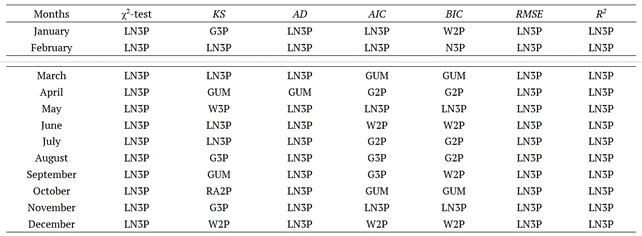
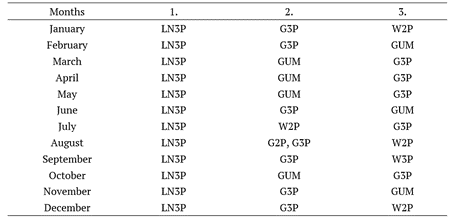
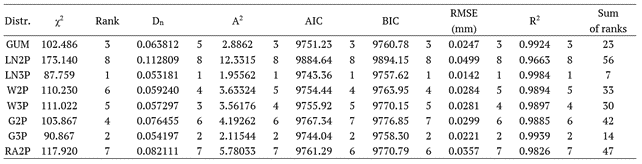
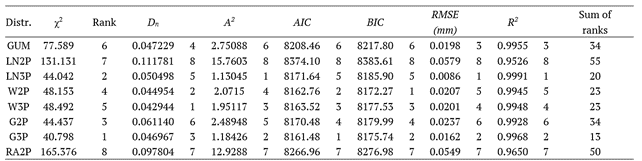
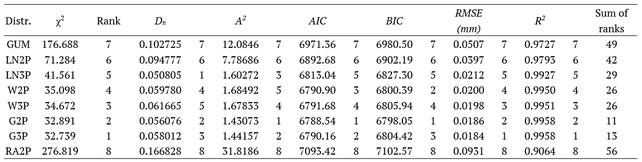
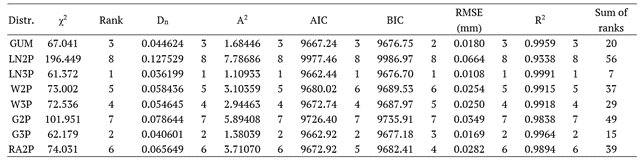
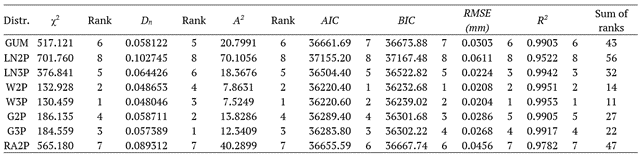
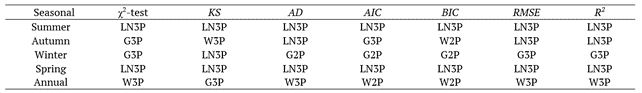
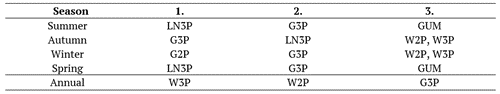
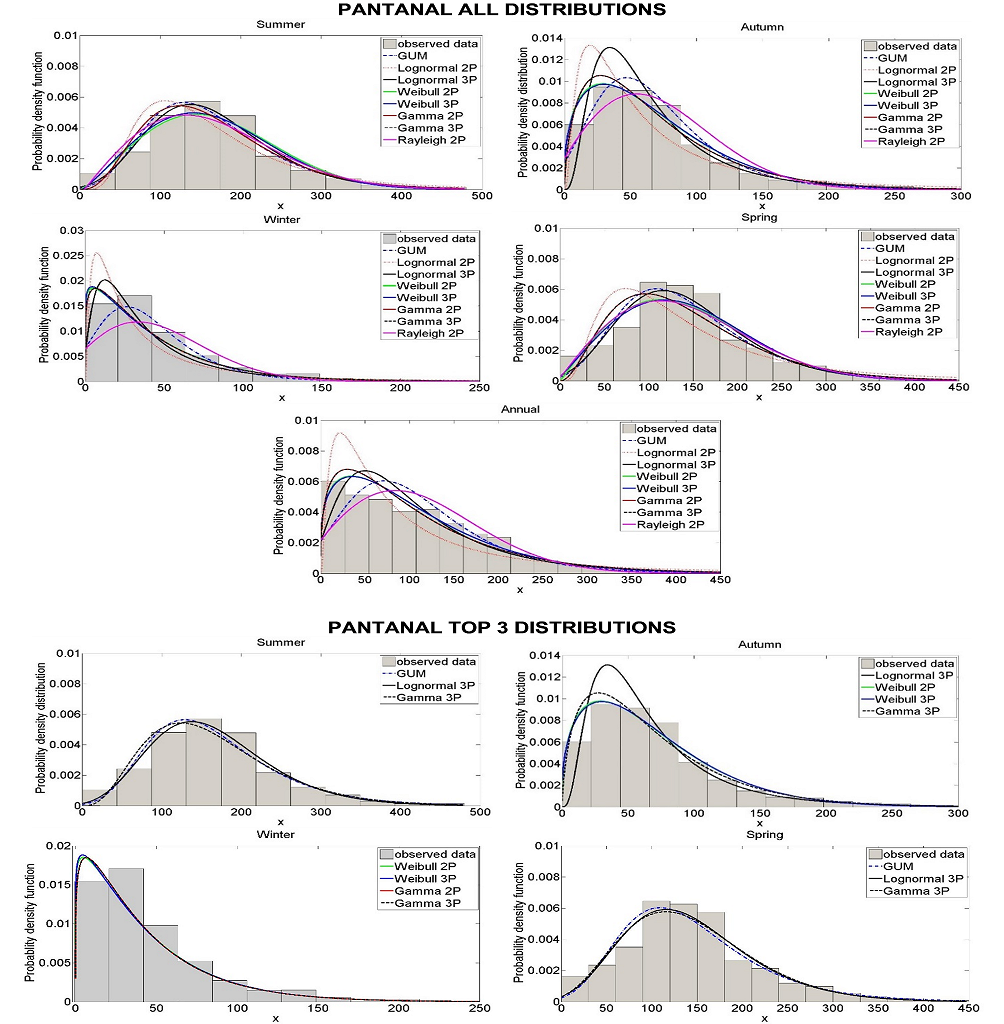
Figure 3. Histograms of observed data and eight fitted pdfs for summer, autumn, winter and spring precipitation
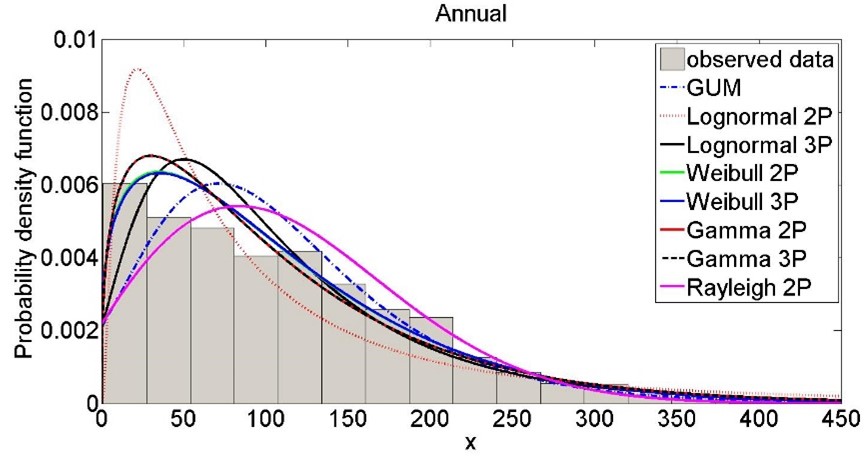
Figure 4. Histograms of observed data and eight fitted pdfs for annual precipitation.
One of the concerns about rain is the intensity and frequency of its occurrence, due to its potentially harmful effects, when in excess or due to scarcity. Thus, the knowledge of the probabilities of occurrence of rain becomes of paramount importance in planning related activities or in monitoring hydrological processes concerning hydrographic basins, being important for the planning of water resources and optimization of the calendar of agricultural activities (Santos, Blanco, & Oliveira Junior, 2019). In this context, the rainfall of a given location can be estimated, among other ways, in probabilistic terms, using theoretical distribution models adjusted to a historical series (Lyra, Garcia, Piedade, Sediyama, & Sentelhas, 2006; Teodoro et al., 2017).
In the Pantanal region has physical peculiarities such as terrain and vegetation that directly influence the spatial variability of rainfall, as well as geographic positioning, since it results from the coupling of several meteorological systems, and is strongly controlled by the Intertropical Convergence Zone (ITCZ), which results in rainfall in the southern summer (Figure 2). The rainfall, on average, is 1200 mm per year, from October to April, the low convergence in southern SA associated with ITCZ results in the advent of air masses moist by northwestern winds derived from the Amazon Basin (Carvalho, Jones, & Liebmann, 2004; Vieira, Satyamurty, & Andreoli, 2013; Bergier et al., 2018). Rainfall variability is thought to have strong links with El Niño – Southern Oscilattion (ENSO); however, recent studies have also pointed to the occurrence of almost periodic events of heavy rains associated with the SACZ, which are driven by the South Atlantic Convergence and the MJO (Carvalho et al., 2004; Carvalho et al., 2011; Novello et al., 2018), as the Convective System, the South Atlantic Convergence, BH and FS (Gan et al. 2004; Teodoro et al., 2016; Teodoro et al., 2015; Teodoro et al., 2017). The influence of the highlands, located in the center-west and east, respectively, is perceived in the spatial distribution of rainfall. Relief-induced rains can potentially occur in these regions, making them rainier compared to locations in the same latitudes, without the influence of altitude.
Seasonality and annual cycles
The areas where the river springs are located have an erosive potential, but are protected by the natural cover of the plants. With the advent of deforestation, erosion has become more severe. In the north of the Pantanal, floods occur between March and April, while in the south they occur from July to August. Between November and March, there is intense water loss due to evapotranspiration (ET). The most intense rains occur from October to March. River flows (m3.s-1) have their inflow from January to April, with peaks in March and discharges occur from April to October, with peaks from June to July, measured in Porto Esperança, on the Paraguay river (Hamilton, Sippel, Calheiros, & Melack, 1997).
The maximum seasonal flooding in the region occurs between February and April and decreases, with peak dry weather between October and December. In addition to annual floods, there are variations over longer periods, with no defined pattern. Such floods are influenced by several factors, both on the macro and on the micro scale. The variations in the level of the river depend fundamentally on the characteristics of the rainfall each year.
In some years, there were strong floods, the different trends of rainfall show the climatic diversity of the Pantanal. However, climatic variability tends to be homogeneous for the biome. The years with the highest rainfall were 1974, 1976, 1982 and 1998, while the greatest droughts occurred in 1978, 2002, with 45.6% of monthly values above average and 54.4% of monthly averages below average. This hydrological seasonality, with an annual hydraulic pattern, is ecologically decisive for the survival of wildlife in the Pantanal.
According to a bulletin from the ANA (2008), in early 2008 the rainfall was above the historical average in practically the entire Upper Paraguay Basin (BAP). Total rainfall in January and February exceeded the average by 100% and 50%, respectively. The increase in local rainfall contributed to a rapid increase in water levels in rivers at the beginning of the flood period.
The climatic conditions alone are not sufficient to explain the differences observed in the Paraguay River regime and in some of its tributaries. The complexity of the hydrological regime of the Paraguay River is related to the smooth slope of the terrain comprised by the plains and swamps of MT (between 50 and 30 cm km-1 in the east-west (E-W) direction and 3 to 1.5 cm km-1 from N to S). It is also due to the extension of the area, which periodically remains flooded with a large volume of water. The winding course of the river and the countless geographical features of the flooded plains contribute to the slow flow of water.
Conclusion
To evaluate the performance of different probability distributions, and identifying the distribution of more appropriate probability for rainfall data in the Pantanal region, it was observed that the best fit was the distribution lognormal 3 parameters (LN3P) for spring and summer; for winter and autumn, the 2-parameter Gamma (G2P) and 3-parameter Gamma (G3P) distributions achieved better performance. For annual observations, the function that best fits the rainfall data is the 3-parameter Weibull distribution (W3P). The 3-parameter Lognormal distribution (LN3P) provides the best fit for monthly precipitation data.
Acknowledgements
The authors thank their Universities for their support.
References
Abreu, U. G. P. d., McManus, C., & Santos, S. A. (2010). Cattle ranching, conservation and transhumance in the Brazilian Pantanal. Pastoralism – Research, Policy and Practice, 1(1), 99–114.
Agência Nacional de Águas [ANA]. (2008). Boletim de monitoramento da Bacia do Alto Paraguai. ANA, 3(3), 1-21. Available from https://bitlybr.com/f593G
Akaike, H. (1974). A new look at the statistical model identification. IEEE Transactions on Automatic Control, 19(6), 716-723. DOI: http://doi.org/10.1109/TAC.1974.1100705
Alho, C. J. R., Lacher, T. E., & Goncalves, H. C. (1988). Environmental degradation in the Pantanal Ecosystem: In Brazil, the world`s largest wetland is being threatened by human activities. BioScience, 38(3), 164-171. DOI: http://doi.org/10.2307/1310449
Alho, C. J. R., & Reis, R. E. (2017). Exposure of fishery resources to environmental and socioeconomic threats within the Pantanal Wetland of South America. International Journal of Aquaculture and Fishery Sciences, 3(2), 22-29. DOI: http://doi.org/10.17352/2455-8400.000024
Alho, C. J. R., & Silva, J. d. S. V. d. (2012). Effects of severe floods and droughts on wildlife of the Pantanal wetland (Brazil)—A review. Animals, 2(4), 591-610. DOI: http://doi.org/10.3390/ani2040591
Araújo, A. G. J., Obregón, G. O., Sampaio, G., Monteiro, A. M. V., Silva, L. T. d., Soriano, B., … Farias J. F. S. (2018). Relationships between variability in precipitation, river levels, and beef cattle production in the Brazilian Pantanal. Wetlands Ecology Management, 26(5), 829–848. DOI: http://doi.org/10.1007/s11273-018-9612-0
Arts, K., Rabelo, M. T. O., Figueiredo, D. M. d., Maffey, G., Ioris, A. A. R., & Girard, P. (2018). Online and offline representations of biocultural diversity: a political ecology perspective on nature-based tourism and indigenous communities in the Brazilian Pantanal. Sustainability, 10(10), 3643-3653. DOI: http://doi.org/10.3390/su10103643
Assine, M. L., Merino, E. R., Pupim, F. N., Macedo, H. A., & Santos, M. G. M. (2015). The Quaternary alluvial systems tract of the Pantanal Basin. Brazilian Journal of Geology, 45(3), 475–489. DOI: https://doi.org/10.1590/2317-4889201520150014
Ávila, G. R. P. T., Silva, C. J., & Ferraz, L. (2018). Pesca e comunidades ribeirinhas. In D. M. Figueiredo, E. F. G. C. Dores & Z. M. Lima (Eds.), Bacia do rio Cuiabá: uma abordagem socioambiental (p. 25-55). Cuiabá, MT: EdUFMT.
Bergier, I. (2013). Effects of highland land-use over lowlands of the Brazilian Pantanal. Science of Total Environment, 463-464, 1060–1066. DOI: http://doi.org/10.1016/j.scitotenv.2013.06.036
Bergier, I., Assine, M. L., McGlue, M. M., Alho, C. J. R., Silva, A., Guerreiro, R. L., & Carvalho, J. C. (2018). Amazon rainforest modulation of water security in the Pantanal wetland. Science of the Total Environment, 619-620, 1116–1125. DOI: http://doi.org/10.1016/j.scitotenv.2017.11.163
Bergier, I., Silva, A. P. S., Abreu, U. G. P. d., Oliveira, L. O. F. d., Tomazi, M., Dias, F. R. T., … Silva J. C. B. (2019). Could bovine livestock intensification in Pantanal be neutral regarding enteric methane emissions? Science of the Total Environment, 655, 463–472. DOI: http://doi.org/10.1016/j.scitotenv.2018.11.178
Bortolotto, I. M., Amorozo, M. C. d. M., Guarim Neto, G., Oldeland, J., Damasceno-Junior, G. A. (2015). Knowledge and use of wild edible plants in rural communities along Paraguay River, Pantanal, Brazil. Journal of Ethnobiology and Ethnomedicine, 11(46), 1-14. DOI: http://doi.org/10.1186/s13002-015-0026-2
Brasil. (1997). Plano de Conservação da Bacia do Alto Paraguai (Pantanal): PCBAP (Vol. 1-3). Brasília, DF: PNMA.
Calheiros, D. F., Oliveira, M. D., & Padovani, C. R. (2012). Hydro-ecological processes and anthropogenic impacts on the ecosystem services of the Pantanal wetland. In A. A. R. Ioris (Ed.), Tropical wetland management: the South-American Pantanal and the international experience (p. 29-57). Farnham, UK: Ashgate Publishing.
Calheiros, D. F., Seidl, A. F., & Ferreira, C. J. A. (2000). Participatory research methods in environmental science: local and scientific knowledge of a limnological phenomenon in the Pantanal wetland of Brazil. Journal of Applied Ecology, 37(4), 684–696. DOI: http://doi.org/10.1046/j.1365-2664.2000.00524.x
Campos, F.V. d. (1969). Retrato de Mato Grosso. São Paulo, SP: Brasil-Oeste.
Carvalho, L. M. V., Jones, C., & Liebmann, B. (2004). The South Atlantic convergence zone: intensity, form,persistence, and relationships with intraseasonal to interannual activity and extreme rainfall. Journal of Climate, 17(1), 88–108. DOI: http://doi.org/10.1175/1520-0442(2004)017<0088:TSACZI>2.0.CO;2
Carvalho, L. M. V., Silva, A. E., Jones, C., Liebmann, B., Dias, P. L. S., & Rocha, H. R. (2011). Moisture transport and intraseasonal variability in the South America monsoon system. Climate Dynamics, 36(9-10), 1865–80. DOI: http://doi.org/10.1007/s00382-010-0806-2
Chiaravalloti, R. M. (2017). Overfishing or over reacting? Management of fisheries in the Pantanal wetland, Brazil. Conservation & Society, 15(1), 111–122.
Chiaravalloti, R. M. (2019). The displacement of insufficiently ‘traditional’ communities: local fisheries in the Pantanal. Conservation & Society, 17(2), 173–183.
Coles, S. (2001). An introduction to statistical modeling of extreme values (Springer series in statistics). London, UK: Springer Verlag.
Crabb, L., Laing, A., Whitney, B., & Saito, C. (November 6, 2017). Hydroelectric dams threaten Brazil's mysterious Pantanal - one of the world's great wetlands. The Conversation. Recovered from https://theconversation.com/hydroelectric-dams-threaten-brazils- mysterious-pantanal-one-of-the-worlds-great-wetlands-86588
Gan, M. A., Kousky, V. E., & Roupelewski, C. F. (2004). The South America Monsoon Rainfall over West-Central Brazil. Journal of Climate, 17(1), 47-66.
Girard, P. (2012). The Pantaneiros, perceptions and conflicts about the environment in the Pantanal. In A. A. R. Ioris. (Ed.), Tropical wetland management: The South-American Pantanal and the international experience(p. 7-27). Farnham, UK: Ashgate Publishing.
Gray, S., Voinov, A., Paolisso, M., Jordan, R., BenDor, T, Bommel, P., … Zellner, M. (2018). Purpose, processes, partnerships, and products: four Ps to advance participatory socio‐environmental modeling. Ecological Applications - Ecological Society of America, 28(1), 46-61. DOI: http://doi.org/10.1002/eap.1627
Hamilton, S. K. (1999). Potential effects of a major navigation project (Paraguay-Parana Hidrovia) on inundation in the Pantanal floodplains. Regulated Rivers-Research & Management, 15(4), 289–299.
Hamilton, S. K., Sippel, S. J., Calheiros, D. F., & Melack, J. M. (1997). An anoxic event and other biogeochemical effects of the Pantanal wetland on the Paraguay River. Limnology and Oceanography, 42(2), 257-272. DOI: http://doi.org/10.4319/lo.1997.42.2.0257
Instituto Brasileiro de Geografia e Estatística [IBGE]. (2010). Censo demográfico 2010 [dataset]. Retrieved form https://ww2.ibge.gov.br/home/estatistica/populacao/ censo2010/default.shtm
Ioris, A. A. R. (2012). Reassessing development: Pantanal's history, dilemmas and prospects. In A. A. R. Ioris (Ed.), Tropical wetland management: The South-American Pantanal and the international experience (p. 199-222). Farnham, UK: Ashgate Publishing.
Ioris, A. A. R., Irigaray, C. T., & Girard, P. (2014). Institutional responses to climate change: opportunities and barriers for adaptation in the Pantanal and the Upper Paraguay River Basin. Climatic Change, 127(1), 139–151. DOI: http://doi.org/10.1007/s10584-014-1134-z
Ivory, S. J., McGlue, M. M., Spera, S., Silva, A., & Bergier, I. (2019). Vegetation, rainfall, and pulsing hydrology in the Pantanal, the world’s largest tropical wetland. Environmental Research Letters, 14(12), 124017.
Junk., W. J., & Cunha, C. N. d. (2005). Pantanal: a large South American wetland at a Crossroads. Ecological Engineering, 24(4), 391-401. DOI: http://doi.org/10.1016/j.ecoleng.2004.11.012
Junk, W. J., Cunha, C. N. d., Wantzen, K. M., Petermann, P., Struüssmann, C., Marques, M. I., & Adis, J. (2006). Biodiversity and its conservation in the Pantanal of Mato Grosso, Brazil. Aquatic Sciences, 68(3), 278–309. DOI: http://doi.org/10.1007/s00027-006-0851-4
Lacerda, A. R. (2017). Mudanças em desejos e oportunidades no status de pecuarista pantaneiro. REPAD - Revista Estudos e Pesquisas em Administração, 1(1), 30–40.
Lacerda, A. L. R., Lima J. V. R. B. d. C. (2015). Impactos da modernização sobre as estruturas sociais: o exemplo dos pecuaristas de Poconé-MT. RES – Revistas de Estudos Sociais, 17(33), 132–143. DOI: http://doi.org/10.19093/res.v17i33.2526
Louzada, R. O., Bergier, I., & Assine, M. L. (2020). Landscape changes in avulsive river systems: case study of Taquari River on Brazilian Pantanal wetlands. Science of The Total Environment, 723, 138067. DOI: http://doi.org/10.1016/j.scitotenv.2020.138067
Lyra, G. B., Garcia, B. I. L., Piedade, S. M. d. S., Sediyama, G. C., & Sentelhas, P. C. (2006). Regiões homogêneas e funções de distribuição de probabilidade da precipitação pluvial no Estado de Táchira, Venezuela. Pesquisa Agropecuária Brasileira, 41(2), 202-215.
Mamede, S., Benites, M., & Alho, C. J. R. (2017). Ciência cidadã e sua contribuição na proteção e conservação da biodiversidade na reserva da biosfera do Pantanal. Revista Brasileira de Educação Ambiental, 12(4), 153–164. DOI: http://doi.org/10.34024/revbea.2017.v12.2473
Mateus, L. A. F., Penha, J. M. F., & Petrere, M. (2004). Fishing resources in the Rio Cuiabá basin, Pantanal do Mato Grosso, Brazil. Neotropical Ichthyology, 2(4), 217–227. DOI: http://doi.org/10.1590/S1679-62252004000400004
Montgomery, D. C., & Runger, G. C. (1991). Applied statistics and probability for engineers. New York, NY: John Wiley & Sons.
Naidoo, R., Gerkey, D., Hole, D., Pfaff, A., Ellis, A. M., Golden, C. D., … Fisher, B. (2019). Evaluating the impacts of protected areas on human well-being across the developing world. Science Advances, 5(4), eaav3006. DOI: http://doi.org/10.1126/sciadv.aav3006
Novello, V. F., Cruz, F. W., Moquet, J. S., Vuille, M., Paula M. S. d., Nunes, D., … Campos, J. L. P. S. (2018). Two millennia of South Atlantic convergence zone variability reconstructed from isotopic proxies. Geophysical Research Letters, 45(10), 5045–5051. DOI: http://doi.org/10.1029/2017GL076838
Oliveira, A. A. (2002). Análise dos impactos das políticas de desenvolvimento regional na bacia do Alto Paraguai. Ensaios e Ciência: Ciências Biológicas, Agrárias e da Saúde, 6(3), 13-37.
Oliveira, E. C., Pla-Pueyo, S., & Hackney, C. R. (2018). Natural and anthropogenic influences on the Nhecolândia wetlands, SE Pantanal. Geological Society, London, Special Publications, 488(1), 167488. DOI: https://doi.org/10.1144/SP488.5
Oliveira-Júnior, J. F., Teodoro, P. E., Silva Junior, C. A. d., Baio, F. H. R., Gava, R., Silva, G.F. C., … Costa, M. d. S. (2020). Fire foci related to rainfall and biomes of the state of Mato Grosso do Sul, Brazil. Agricultural and Forest Meteorology, 282-283, 1-13. DOI: http://doi.org/10.1016/j.agrformet.2019.107861
Rabelo, M. T. O., Arts, K. A. J., Girard, P., Ioris, A. R., & Figueiredo, D. M. (2017). Percepção dos atores sociais do turismo sobre o pulso de inundação do Pantanal (MT). Revista Brasileira de Ecoturismo, 10(3), 708–736. DOI: http://doi.org/10.34024/rbecotur.2017.v10.6649
Rao, C. R. (1973). Linear statistical inference and its applications (2nd ed.). Hoboken, NJ: Wiley.
Rao, V. B., & Hada, K. (1990) Characteristics of rainfall over Brazil: Annual variations and connections with the southern oscillation. Theoretical and Applied Climatology, 42, 81-91. DOI: http://dx.doi.org/10.1007/BF00868215
Rossetto, O. C. (2009). Sustentabilidade ambiental do Pantanal mato-grossense: interfaces entre cultura, economia e globalização. Revista NERA, (15), 88–105.
Rossetto, O. C., & Girardi, E.P. (2012). Dinâmica agrária e sustentabilidade socioambiental no Pantanal brasileiro. Revista NERA, 15(21), 135-161.
Rossetto, O. C., & Tocantins, N. (2015). Características socioeconômicas dos pescadores profissionais artesanais da Bacia do Alto Paraguai (BAP) e do Pantanal norte mato- grossense. In O. C. Rossetto & N. Tocantins (Eds.), Ambiente agrário do Pantanal brasileiro: socioeconomia & conservação da biodiversidade (p. 157–192). Porto Alegre, RS: Imprensa Livre.
Safford, T. G. (2010). The political-technical divide and collaborative management in Brazil's Taquari Basin. The Journal of Environment & Development, 19(1), 68–90. DOI: http://doi.org/10.1177/1070496509355275
Safford, T. G. (2012). Organizational complexity and stakeholder engagement in the management of the Pantanal wetland. In A. A. R. Ioris (Ed.), Tropical wetland management: the South-American Pantanal and the international experience (p. 173-198). Farnham, UK: Ashgate Publishing.
Santiago D. B., Correia Filho, W. L. F., Oliveira-Júnior, J. F., & Silva Junior, C. A. (2019). Mathematical modeling and use of orbital products in the environmental degradation of the Araripe Forest in the Brazilian Northeast. Modeling Earth Systems and Environment, 5, 1429–1441. DOI: http://doi.org/10.1007/s40808-019-00614-x
Santos, V. C., Blanco, C., & Oliveira Junior, J. F. (2019). Distribution of rainfall probability in the Tapajos River basin, Amazonia, Brazil. Revista Ambiente & Água, 14(3),1-21. DOI: http://doi.org/10.4136/ambi-agua.2284
Schulz, C., Martin-Ortega, J., & Glenk, K. (2018). Value landscapes and their impact on public water policy preferences. Global Environmental Change, 53, 209–224. DOI: http://doi.org/10.1016/j.gloenvcha.2018.09.015
Schulz, C., Martin-Ortega, J., Ioris, A. A. R., & Glenk, K. (2017). Applying a ‘value landscapes approach’ to conflicts in water governance: the case of the Paraguay-Paraná Waterway. Ecological Economics, 138, 47-55. DOI: http://doi.org/10.1016/j.ecolecon.2017.03.033
Schulz, C., Whitney, B. S., Rossetto, O. C., Neves, D. M., Crabb, L., Oliveira, E. C., … Saito, C. H. (2019). Physical, ecological and human dimensions of environmental change in Brazil's Pantanal wetland: synthesis and research agenda. Science of The Total Environment, 687, 1011-1027. DOI: http://doi.org/10.1016/j.scitotenv.2019.06.023
Schwarz, G. (1978). Estimating the dimension of a model. Annals of Statistics, 6(2), 461-464. DOI: http://doi.org/10.1214/aos/1176344136
Silva, C. J. d., Silveira, R. A., & Nogueira, P. S. (2014). Perceptions on climate change of the traditional community Cuiabá Mirim, Pantanal Wetland, Mato Grosso, Brazil. Climatic Change, 127(1), 83–92. DOI: http://doi.org/10.1007/s10584-014-1150-z
Silva, J. d. S. V. d., & Abdon, M. d. M. (1998). Delimitação do Pantanal brasileiro e suas sub-regiões. Pesquisa Agropecuária Brasileira, 33, 1703–1711.
Teodoro, P. E., Correa, C. C. G., Torres, F. E., Oliveira Júnior, J. F., Silva Júnior, C. A., Gois, G., & Delgado, R. C. (2015). Analysis of the occurrence of wet and drought periods using standardized precipitation index in Mato Grosso do Sul state, Brazil. Journal of Agronomy, 14(2), 80-86. DOI: http://doi.org/10.3923/ja.2015.80.86
Teodoro, P. E., Oliveira-Júnior., J. F., Cunha, E. R., Correa, C. C. G., Torres, F. E., Bacani, V. M., … Ribeiro, L. P. (2016). Cluster analysis applied to the spatial and temporal variability of monthly rainfall in Mato Grosso do Sul State, Brazil. Meteorology and Atmospheric Physics, 128(2), 197-209. DOI: http://doi.org/10.1007/s00703-015-0408-y
Teodoro, P. E., Silva Junior, C. A., Oliveira-Júnior, J. F., Delgado, R. C., Gois, G., Correa, C. C. G., & Torres, F. E. (2017). Probable monthly rainfall associated with distinct biomes of Mato Grosso do Sul state. Bioscience Journal, 33(3), 747-753. DOI: http://doi.org/10.14393/BJ-v33n3-34944
Thielen, D., Schuchmann, K-L., Perazzi, P. R., Marquez, M., Rojas, W., Quintero, J. I., & Marques, M. I. (2020). Quo vadis Pantanal? Expected precipitation extremes and drought dynamics from changing sea surface temperature. PLoS One,15(1), e0227437. DOI: http://doi.org/10.1371/journal.pone.0227437
Tortato, F. R., & Izzo, T. J. (2017). Advances and barriers to the development of jaguar-tourism in the Brazilian Pantanal. Perspectives in Ecology and Conservation, 15(1), 61–63. DOI: http://doi.org/10.1016/j.pecon.2017.02.003
Tozato, H. C., Dubreuil, V., & Théry, N. A. M. (2014). Tendências e rupturas climato-hidrológicas no sítio Ramsar Parna Pantanal (MT, Brasil). Revista Brasileira de Climatologia, 13, 164-184. DOI: http://doi.org/10.5380/abclima.v13i0.34111
Vieira, S. O., Satyamurty, P., & Andreoli, R. V. (2013). On the south Atlantic convergence zone affecting southern Amazonia in austral summer. Atmospheric Science Letters, 14(1), 1–6. DOI: http://doi.org/10.1002/asl2.401
Wantzen, K. M., Cunha, C. N., Junk, W. J., Girard, P., Rossetto, O. C., Penha, J. M., … Callil, C. (2008). Towards a sustainable management concept for ecosystem services of the Pantanal wetland. Ecohydrology & Hydrobiology, 8(2-4), 115–138. DOI: http://doi.org/10.2478/v10104-009-0009-9
Notas de autor
amaury.de@uol.com.br