Abstract: Blueberry is a fruit consumed fresh and as an ingredient in formulations such as jam, juice, and wine. Wine is a widely consumed beverage and produced from different berries and fruits. Blueberry wine contains bio-compounds that could have a beneficial effect on health. Therefore, this study aimed to optimize blueberry wine by two response variables (total soluble solids and fermentation time) to obtain the highest alcohol percentage, pH, and lightness. In order to optimize the fermentation process, a central composite design was used. The optimized blueberry wine was obtained at total soluble solids of 25°Brix and fermentation time of 16 d. The optimized blueberry characteristics estimated were: alcohol percentage of 11.91%, pH of 2.98, and lightness (L.) of 26.22, and the optimized blueberry characteristics experimental were: alcohol percentage of 11.93±0.02%, pH of 2.97±0.01, and L. of 25.42±1.80. The optimized blueberry wine had a total phenolic content of 360.27±18.09 mg of gallic acid equivalents L-1, total anthocyanin content of 46.27±3.66 mg cyanidin-3 glucoside L-1, antioxidant capacity by ABTS and DDPH assays of 1,539.8±92.18 and 1,688.07±57.57 mM Trolox equivalent L-1, respectively. The results suggest that optimized blueberry wine can be considered a drink with potential health applications.
Keywords: Alcoholic beverage, berries, optimization, antioxidants.
Ciência, Tecnologia Alimentar e Engenharia de Alimentos
Antioxidant capacity and evaluation of total phenolic content of optimized blueberry (Vaccinium corymbosum) wine
Universidade Estadual de Maringá
Recepción: 06 Agosto 2020
Aprobación: 30 Noviembre 2020
Wine is an ancestral product that has been transformed and studied over time; this drink has a significant social and economic impact due to its wide distribution and consumption throughout the world (Albergamo et al., 2020; Tsegay, Sathyanarayana, & Lemma, 2018). Wine is a drink rich in phytochemicals as polyphenols, which has a beneficial effect on human health. In this sense, the principal groups of polyphenols in wine are anthocyanins (cyanidin-3-glucoside), phenolic acids (gallic acid, p-hydroxybenzoic acid, vanillic acid, protocatechuic acid, chlorogenic acid, caffeic acid, and syringic acid), and flavonoids (Albergamo et al., 2020; Chay et al., 2020; Podsędek, 2007; Wang et al., 2015). Likewise, it has been reported that phenolic compounds are the most important phytochemicals that modified sensory and organoleptic characteristics of the wine, such as color and lightness (Šćepanović, Wendelin, Raičević, & Eder, 2019; Vilas-Boas, Nassur, Henrique, Pereira, & Lima, 2019).
Wine is produced from different sources like rice, grapes, and other fruits (Albergamo et al., 2020; Chay et al., 2020; Miller & Block, 2020; Tsegay et al., 2018). Blueberry (Vaccinium spp.) is an alternative to grapes for wine production because contains similar characteristics like sugar content and acidity (He et al., 2016). Blueberry is a fruit widely distributed due to its organoleptic properties. Its bittersweet taste and dark-blue color are appealing to the consumer ; being consumed fresh and also in jams, juices, and wine (Michalska & Łysiak, 2015; Zhang, Li, & Gao, 2016). Furthermore, these berries are a good source of phenolic compounds like anthocyanins, flavonols and chlorogenic acid, which are linked to beneficial health effects on non-communicable diseases as neurodegenerative diseases, cardiovascular disorders, and cancer (Cutler, Gholami, Chua, Kuberan, & Babu, 2018; Routray & Orsat, 2011; Seeram et al., 2006; Zhang et al., 2016).
It has been reported that wine is modified by different process variables such as fermentation time, mold or yeast concentration, temperature, sugar concentration, among others (Chay et al., 2020; Miller & Block, 2020). Therefore, statistical tools have been proposed for optimizing the process variables and interactions. In this sense, response surface methodology has been widely used to found interaction between process and response variables through mathematical equations (Bezerra, Santelli, Oliveira, Villar, & Escaleira, 2008).
So far, in our literature review, optimizing conditions for blueberry wine production have not been reported yet. Thus, this study aimed to optimize two process variables (total soluble solids and fermentation time) to obtain a wine with quality characteristics such as alcohol percentage, pH, lightness, antioxidant activity, and phenolic content, using a strain of Saccharomyces cerevisiae.
Fresh blueberry fruits (Vaccinium corymbosum), table sugar, and Red Star Premier Rouge (California, USA) commercial yeast (Saccharomyces cerevisiae) were purchased from a local market in Culiacán, Mexico. Blueberries were stored at 8°C during transportation to the laboratory and kept refrigerated until use.
Ethanol, methanol, hydrochloric acid, sodium carbonate, and potassium persulfate were used in analytical grade. Also, 2,2'-azino-bis (3-ethylbenzothiazoline-6-sulphonic acid) (ABTS) (Sigma 10102946001), 2,2-diphenyl-1-picrylhydrazyl (DPPH) (Sigma 9132), 6-hydroxy-2,5,7,8-tetramethylchroman-2-carboxylic acid (Trolox) (Sigma 238813), Folin & Ciocalteu’s phenol reagent (Sigma 9252), and gallic acid (Sigma 7384) were also purchased from Sigma (Toluca, México).
The blueberry wine process was carried out following Shet & Belur (2015) methodology, with slight modifications. About 0.2 kg of blueberry were used for each fermentation process, being washed and pressed manually at room temperature. The blueberry juice was filtered and mixed with water and sugar until reaching a volume of 450 mL and total soluble solids value by experimental design. The rehydrated dry yeast (Saccharomyces cerevisiae) was used in a ratio of 0.5 g of dry yeast L-1. Blueberry juice solution was sterilized and mixed with rehydrated yeast. The fermentation was carried out in sterilized cylindrical flasks with a central lid equipped with an airlock, at room temperature (25 ± 1°C), in the dark, with fermentation times according to experimental design (Table 1). After fermentation, the mixture was filtered and clarified using a siphon (Brewmaster, Ohio, USA). The clarified sample was stored in amber bottles at 4°C until analysis.
Table 1. Central composite design of factors with codes for blueberry fermentation

Color measurements were performed by the AOAC official method 976.11 (Association of Official Analytical Chemists [AOAC], 2012) with slight modifications. A sample of 10 mL of blueberry wine was analyzed using a spectrophotometer Minolta (Konica CM-2600d, Minolta Inc., Osaka, Japan) coupled to a computer. The results were analyzed by the On-Color QC version 5 software. The analysis was performed in triplicates, and results were reported as lightness (L*).
Titratable acidity and pH were evaluated following the AOAC official method 981.12 and 942.15, respectively (AOAC, 2012) with slight modification. A 10 mL sample of blueberry wine was homogenized and measured with a potentiometer (Apera Instruments, PH700, Columbus, Ohio, USA). Likewise, titratable acidity was determined by titration of the sample with a NaOH solution 0.1 N until reaching a pH of 8.1 ± 0.2 with an automatic titrator (Metter Toledo DL-21, Mexico City, Mexico). The pH and titratable acidity were evaluated by triplicates and expressed as pH and citric acid percentages, respectively.
Total soluble solids were determined following the AOAC official method 932.12 (AOAC, 2012). A 2 mL sample of blueberry wine was placed in a digital refractometer (Metter Toledo RE40D, Mexico City, Mexico); distilled water was used as blank. The results were evaluated and expressed as degree Brix (°Brix).
The blueberry wine alcohol percentage was determined by the Gay-Lussac degrees following the method OVI-MA-AS312-01B (International Organisation of Vine and Wine, 2018). A sample of 200 mL of clarified blueberry wine was distilled in a rotavapor, and the refractive index was measured in a digital refractometer (Metter Toledo RE40D, Mexico City, Mexico) using a drop of the distilled sample obtained. The density was measured by densimeter (Brewmaster, Ohio, USA). The results were calculated and expressed as the alcohol percentage (%).
Response surface methodology (RSM) was used to optimize the fermentation process. Two variables set of 13 experiments were performed, with each variable at five levels (Table 1). Total soluble solids (X1) and time (X2) were considered as independent variables, and alcohol percentage, pH and lightness (L*) as dependent variables. Individual experiments were carried out in random order. The quadratic polynomial regression model was assumed for predicting (Y) response variables. Models of the following form were developed to describe the two response surfaces (Y), according to Equation (1).
 [1]
[1]Where Y is the value of the considered experimental predicted response variable (alcohol percentage, pH or lightness), β0 is the constant value, β1 and β2 are linear coefficients, β12 is the interaction coefficient, β11 and β22 are quadratic coefficients. The significant terms (p ≤ 0.05) for the second-order polynomial model were recalculated to obtain a predictive model for each variable (Milán-Carrillo, Montoya-Rodríguez, Gutiérrez-Dorado, Perales-Sánchez, & Reyes-Moreno, 2012; Zhang et al., 2016). All the results were analyzed by the statistical software "Design Expert" (Version 7.0.0, Stat-Ease Inc., Minneapolis, USA) to determine the optimum conditions for the fermentation process. The optimal levels of these variables were obtained by the graphs' contour plots and by solving the regression equations (Gamal, El-Tayeb, Raffat, Ibrahim, & Bashandy, 2016).
Folin-Ciocalteu's assay was used with some modifications (Swain & Hillis, 1959). This procedure was carried out by adding 10 μL of optimized blueberry wine, 230 μL of distilled water, and 10 μL of Folin-Ciocalteu reagent in a 96 -well microplate. After 3 min., the mixture was mixed with 25 μL of 4M Na2CO3 and incubated at 25°C for 2 h in darkness. The absorbance was measured at 725 nm using a Synergy HT spectrometer (Synergy HT, Bio-Tek Instruments, Inc., Winooski, Vt., USA), and methanol was used as blank. The results were calculated by a gallic acid standard curve (Gutiérrez-Grijalva, Angulo-Escalante, León-Félix, & Heredia, 2017). The total phenolic content was expressed as milligrams of gallic acid per mL of optimized blueberry wine (mg GAE mL-1).
The total anthocyanins assay was carried out by a colorimetric method reported by Abdel-Aal and Hucl (1999), with some modifications. A sample of 2 mL of optimized blueberry wine was mixed with 10 mL of cold acid ethanol (HCl was used to decrease the pH to 1). The mixture was centrifuged using a HERMLE centrifuge (HERMLE Z 36 HK, Labortechnik, Wehingen, Baden-Wurtemberg, Germany) at 7,500 x g (rotor 221.22) for 15 min. at 4°C, and the supernatant was collected to carry out the assay. Later, the supernatant was brought up to 25 mL volume using acid ethanol. The absorbance at 535 nm was measured using a Synergy HT spectrometer; acid ethanol was used as blank. The results were expressed as mg cyanidin-3-O-glucoside (C3G) equivalent per litter of optimized blueberry wine (mg C3G L-1), according to Equation (2).
 [2]
[2]Where A = absorbance at 535 nm, ϵ = extinction coefficient (25,965 1 M-1, cm), L = total volume (25 mL), Mw = molecular weight (449.2 g mol-1) and v = sample volume.
The samples' antioxidant activity was measured using the ABTS method, as reported by Karadag, Ozcelik, and Saner (2009), with some modifications. A sample of 10 mL of optimized blueberry wine was centrifuged using a HERMLE centrifuge at 7,500 x g for 15 min. at 4°C, and the supernatant was collected to carry out the assay. A 10 µL of the obtained extract was mixed with 190 µL of ABTS solution (7.4 mM ABTS, 2.6 mM K2S2O8, and 80% ethanol) and incubated for 2h at room temperature, and protected from light. The absorbance at 734 nm was measured using a Synergy HT spectrometer, and a solution of ethanol was used as a blank. The results were expressed as Trolox equivalent millimoles per litter of optimized blueberry wine (mM TE L-1).
The DPPH radical scavenging assay was used with some modifications reported by Karadag et al. (2009). 10 µL of the obtained extract was mixed with 190 µL of the DPPH solution, and then incubated for 30 min. at room temperature and protected from light. The absorbance at 540 nm was measured using a Synergy HT spectrometer, and a solution of ethanol was used as a blank. The results were expressed as Trolox equivalent millimoles per litter of optimized blueberry wine (mM TE L-1).
The data of antioxidant activity (ABTS and DPPH), phenolic compounds, and anthocyanins content of optimized wine were analyzed using the statistical package Minitab 17 (Minitab Inc. USA). Each experiment was performed in quintuplets. Data were reported as mean ± standard deviations.
Three predictive models were obtained to fit the second-order polynomial of Equation (1) to the experimental data of the different combinations effects from the fermentation process variables on three response functions (alcohol percentage, pH, and lightness) as shown in Table 1. These predictive models were tested for adequacy and fitness by analyses of variance (ANOVA, Table 2). It has been reported that a good predictive model should have an adjusted R2 (coefficient of determination) ≥ 0.80, a significance level of p < 0.05, coefficients of variance (CV) values ≤ 10%, and lack of fit test > 0.1; all these parameters could be used to decide the satisfaction of the modeling (Milán-Carrillo et al., 2012). The alcohol percentage varied from 2.5 to 12.05%, the pH varied from 2.91 to 3.01, and lightness from 24.93 to 27.524 (Table 1).
Our results showed that alcohol percentages were significantly dependent on linear terms of total soluble solids [TSS, p < 0.01] and fermentation time [t, p < 0.01)], and on quadratic terms of TSS and t [(TSS)2, p < 0.01, (t)2, p < 0.017]. Predictive models for the alcohol percentage (YAP) are shown in Equation 3 and 4.
Using coded variables:
 [3]
[3]Using original variables:
 [4]
[4]The predictive model explained 98.583% of the total variation (p < 0.05) in alcohol percentage values (Table 2). Furthermore, the relative dispersion of the experimental points from the models' predictions (CV) was found to be 4.86%. These values indicated that the experimental model was adequate and reproducible. Maximum values of alcohol percentage were observed at TSS 21.25 - 25% and t = 14.5 – 16 days (Figure 1).
Table 2. Regression coefficients and variance analysis of second-order polynomial models for blueberry wine.

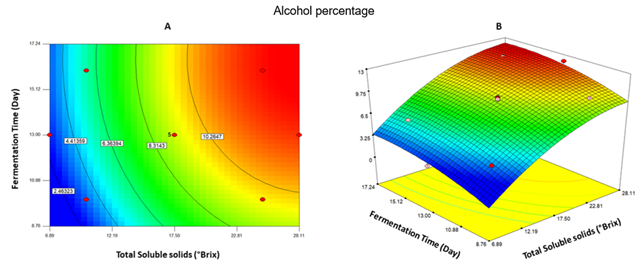
Figure 1. Contour plots (A) and response surface (B) for the effect of total soluble solids (°Brix) and fermentation time (Day) on alcohol percentage of blueberry fermentation.
Similarly, the analysis of variance showed that pH was significantly dependent on linear terms of total soluble solids [TSS, p < 0.01] and fermentation time [t, p < 0.01)], and on quadratic terms of TSS [(TSS)2, p < 0.01]. Predictive models for the pH (YpH) are shown in Equation 5 and 6.
Using coded variables:
 [5]
[5]Using original variables:
 [6]
[6]The predictive model explained 95.45% of the total variation (p < 0.05) in pH values (Table 2). Furthermore, the relative dispersion of the experimental points from the models' predictions (CV) was found to be 0.26%. These values indicated that the experimental model was adequate and reproducible. Maximum values of pH were observed at TSS 22.81 – 28.11% and t = 8.76 – 17.24 days (Figure 2).
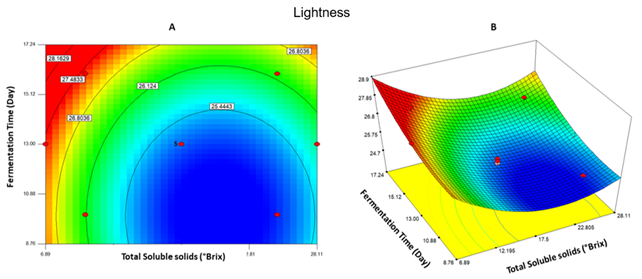
Figure 2. Contour plots (A) and response surface (B) for the effect of total soluble solids (°Brix) and fermentation time (Day) on pH of blueberry fermentation.
Based on the variable factor test, the analysis of variance showed that lightness was significantly dependent on linear terms of total soluble solids [TSS, p < 0.01] and fermentation time [t, p < 0.01)], and on quadratic terms of TSS and t [(TSS)2, p < 0.01, (t)2, p < 0.02]. Equations 6 and 7 explain the effects of process variables on lightness (YL*), both in encoded and original variables:
Using coded variables:
 [7]
[7]Using original variables:
 [8]
[8]The predictive model explained 93.05% of the total variation (p < 0.05) in lightness values (Table 2). Furthermore, the relative dispersion of the experimental points from the models' predictions (CV) was found to be 1.14%. These values indicated that the experimental model was adequate and reproducible. Minimum lightness values were observed at TSS 12.19 – 28.11% and t = 6.89 – 15.12 day (Figure 3).
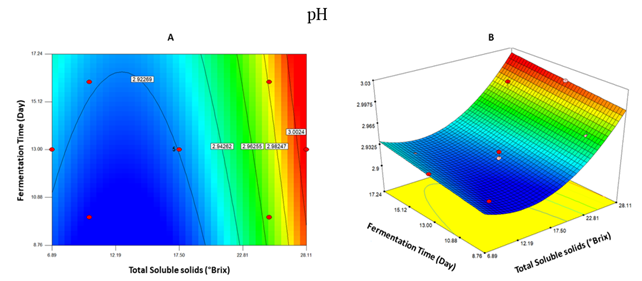
Figure 3. Contour plots (A) and response surface (B) for the effect of total soluble solids (°Brix) and fermentation time (Day) on lightness (L*) of blueberry fermentation.
The blueberry wine process' optimal fermentation condition was at total soluble solids of 25 °Brix and fermentation time of 16 days. Likewise, it was found global desirability of 0.81, which, according to previous reports, an optimum value is 1 and a desirability value > 0.6 is considered acceptable (Milán-Carrillo et al., 2012; Montgomery, 2002).
Three response variables were studied to optimize the blueberry wine process, for which the maximum response was sought (alcohol percentage, pH, and luminosity). The optimal conditions of the fermentation process for blueberry wine were carried out by the graphical method. In this sense, Figures 1A, 2A and 3A showed the effect of total soluble solids (TSS) and fermentation time (t) on alcohol percentage, pH, and lightness, respectively.
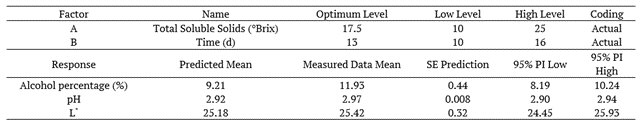
The superposition of these contour plots was carried out to obtain a new contour plot (Figure 4), which was utilized to select the best combination of fermentation process variables to produce optimized blueberry wine with high alcohol percentage and pH, and low lightness. The central point of the optimized region in Figure 4 corresponds to a combination process variable of STT = 25 °Brix and t = 16 days. Under these conditions, blueberry wine was estimated with alcohol percentage of 11.91%, pH of 2.98, and lightness of 26.22 (Table 3). The experiment with the optimal conditions was performed to validate the predictive models. The measured variables showed an alcohol percentage of 11.93 ± 0.02%, a pH of 2.97 ± 0.01, and a lightness of 25.42 ± 1.80.
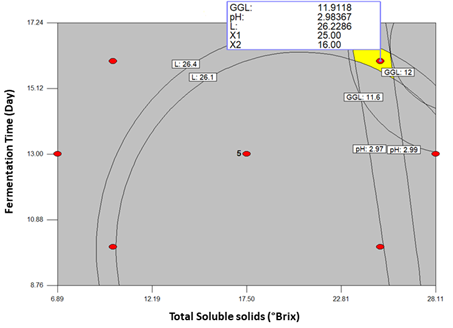
Figure 4. The optimal condition of process variables (total soluble solids/fermentation time) for blueberry wine.
It has been reported that during the blueberry fermentation process, the lightness varied due to the production of alcohol, secondary metabolites, and sugar consumption (Wang et al., 2015). Therefore, it is critical to study the lightness parameter during the blueberry fermentation process.
In this sense, Zhang et al. (2016) reported a variation of L* during the fermentation of 10 blueberry varieties with values ranging from 15.92 to 38.43, which contained high phenolic content (884.47 and 674.89, respectively).
Table 3. Confirmation report of optimized blueberry wine.
The L value could be related to phenolic compounds and anthocyanins, since there are reports of an increase in these compounds as the L value increased (Wang et al., 2015; Zhang et al., 2016). However, other studies have reported a negative interaction between lightness (L*) and phenolic compounds, as well as lightness and total anthocyanin content, since these compounds could contribute to the dark color of wines (Johnson & De Mejia, 2012; Zhang et al., 2016). Our lightness results showed a similar value to previous reports. In this work, a higher lightness (L*) was sought. Therefore, we can assume that optimized blueberry wine may have phenolic compounds.
In contrast, our optimized blueberry wine had a higher alcohol percentage % than the one reported by Santos et al. (2016) who used three blueberry wine cultivars and obtained an alcohol percentage that varied from 5.2 to 11.1%. Also, Čakar, Petrović, Janković, Pejin, Vajs, Čakar, and Djordjević et al. (2018) reported pH and alcohol percentage from 2.86 to 2.94 and 8.27 to 11.31%, respectively.
Similarly, our results agree with commercial blueberry wines studied by Ortiz, Marín-Arroyo, Noriega-Domínguez, Navarro, and Arozarena (2013), who analyzed the chemical characteristics of commercial blueberry wines from Ecuador. They reported that alcoholic percentage and pH varied from 12 to 12.9% and 2.8 to 3.0, respectively. Differences with previous reports could be attributed to the blueberry varieties and the fermentation conditions. Optimized blueberry wine had similar characteristics in comparison to commercial blueberry wine; therefore, it could compete with other wines.
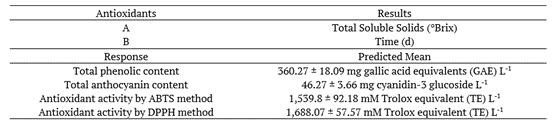
The optimized blueberry wine characteristics are shown in Table 4. The total phenolic content of optimized blueberry wine was 360.27 ± 18.09 mg GAE L-1. Our results showed a lower phenolic content in comparison to several reports. In this sense, Zhang et al. (2016), Santos et al. (2016), Čakar, Petrović, Janković, Pejin, Vajs, Čakar, and Djordjević et al. (2018), Su and Chien (2007), and Fonseca et al. (2018) reported values of 506-1205, 1803-2824, 2259-2459, 858-1150, and 706 mg GAE L-1, respectively. This disparity between these author's results and ours might be attributed to the blueberry varieties used in the winemaking. This fermentation process includes yeast concentration, total soluble solids, and fermentation time.
Table 4. Antioxidant assays of optimized blueberry wine.
It is also important to mention that the Folin-Ciocalteu assay results can be altered by the concentration of reduced sugars (Sánchez-Rangel, Benavides, Heredia, Cisneros-Zevallos, & Jacobo-Velázquez, 2013).
In contrast, Ortiz et al. (2013) analyzed the total phenolic content of commercial blueberry wines. They reported that the phenolic compounds varied from 854 to 1,386 mg GAE L-1. These results are higher than the ones obtained from optimized blueberry wine. However, it is important to remember that commercial wines are aged, so that difference could be due to the fact that the optimized blueberry wine has aged less (16 days of fermentation). It has been reported that fermentation time and aging could contribute to wine characteristics like phenolic content (Miller & Block, 2020).
The optimized blueberry wine showed a total anthocyanin content of 46.27 ± 3.66 mg cyanidin-3 glucoside L-1. Our results are lower than the total anthocyanin content reported by several authors. For instance, Su and Chien (2007), Santos et al. (2016) and Fonseca et al. (2018) reported values of 56-99, 198, and 105-213 mg C3G L-1, respectively. However, our results agree with those reported by Zhang et al. (2016), who reported a total anthocyanidin content of 41-316 mg C3G L-1. On the other hand, our results showed a higher total anthocyanin content than commercial blueberry wines produced in Illinois (10.71-37.29 mg cyanidin-3 glucoside L-1) (Johnson & De Mejia, 2012).
Regarding the phenolic compounds content, differences in the anthocyanin content could be due to blueberry cultivars characteristics, the winemaking process and climatic growing conditions. It has been reported that wines made from grapes in higher altitudes have higher anthocyanin content (Liu, Zhang, Shi, Duan, & He, 2019; Vilas-Boas et al., 2019), so that the wine obtained from blueberries at sea level may be different from those reported in the literature.
The antioxidant activity of optimized blueberry wine was evaluated by the ABTS and DPPH assays. In this sense, the ABTS method's optimized blueberry wine showed antioxidant activity of 1,539.8 ± 92.18 mM Trolox equivalent L-1, while by DPPH method was 1,688.07 ± 57.57 mM Trolox equivalent L-1. Our results differ from those reported by some authors; in this sense, Zhang et al. (2016) reported the antioxidant activity by DPPH assay of wines from ten blueberry cultivars. The results varied from 11.3 to 41.23 mg of vitamin C equivalent per liter of blueberry wine. Similarly, Su and Chien (2007) reported a high free radical-scavenging (51-78%) of blueberry wine by DPPH assay. Also, Santos et al. (2016) studied the IC50 of blueberry wine by DPPH assay and they reported a variation from 3.3 to 6.4. Similarly, Fonseca et al. (2018) reported the antioxidant activity by ABTS and DPPH assays of 3,564.1 and 1,614.2 mM Trolox equivalent L-1, respectively.
In contrast, the optimized blueberry wine from this study had a highest antioxidant activity than the one reported by Ortiz et al. (2013), who studied commercial blueberry wines from Ecuador. They reported an antioxidant activity by DPPH assay of 5.4 ± 0.8 mM Trolox equivalent L-1. Differences with these reports could be attributed to the aging, winemaking process, and blueberry varieties. Likewise, the results suggest that our optimized blueberry wine also exhibited antioxidant activity, when comparing to previous reports of other authors and commercial blueberry wines analyzed by DPPH and ABTS assays. The berries have a high concentration of phenolic compounds. It has been reported that antioxidant activity is linked to the content of phenolic compounds. In addition, they have been associated with disease prevention (mainly cardiovascular disease) in in vitro and in vivo models. It has also been shown that during the winemaking process of berries, the phenolic compounds are increased by enzymatic reactions. There are even mathematical models to predict the production of these compounds during the winemaking process. In this work, we found that optimized blueberry wine had phenolic compounds, as reported by other authors for wines from blueberry; thus, we can conclude that the consumption of optimized blueberry wine could have beneficial effects on health, just like other types of wines that have been previously studied (Castaldo et al., 2019; Miller & Block, 2020; Olas, 2018; Ortiz et al., 2013; Vilas-Boas et al., 2019).
It also must be highlighted that Čakar, Grozdanić, Pejin, Vasić, Čakar, Petrović, and Djordjević et al. (2018) reported the inhibitory potential of the α-glucosidase enzyme (related to diabetes mellitus) by berry wines; in this sense, they reported that blueberry wine further inhibited the enzyme (IC50 ~ 27 ± 1µg mL-1), thus optimized blueberry wine could have a beneficial effect on diabetes.
The optimal conditions to obtain blueberry wine were: total soluble solid content of 25°Brix and fermentation time of 16 days. With these conditions, we obtained a wine with alcoholic content similar to commercial wines, which also showed soluble phenolics, anthocyanins and antioxidant activity as in previous reports. For future studies, we suggest to focus on the sensory analysis and chromatographic characterization of phenolic compounds from optimized blueberry wine.
jbheredia@ciad.mx
Table 1. Central composite design of factors with codes for blueberry fermentation
Table 2. Regression coefficients and variance analysis of second-order polynomial models for blueberry wine.
Figure 1. Contour plots (A) and response surface (B) for the effect of total soluble solids (°Brix) and fermentation time (Day) on alcohol percentage of blueberry fermentation.
Figure 2. Contour plots (A) and response surface (B) for the effect of total soluble solids (°Brix) and fermentation time (Day) on pH of blueberry fermentation.
Figure 3. Contour plots (A) and response surface (B) for the effect of total soluble solids (°Brix) and fermentation time (Day) on lightness (L*) of blueberry fermentation.
Figure 4. The optimal condition of process variables (total soluble solids/fermentation time) for blueberry wine.
Table 3. Confirmation report of optimized blueberry wine.
Table 4. Antioxidant assays of optimized blueberry wine.
