Abstract: Medicine and engineering sciences have been working in close contact for common purposes. Machine learning algorithms are used in the medical field for early diagnosis prediction. The major aim of this study is to evaluate machine learning algorithms and deep learning algorithms using computed tomography scan (CT-scan) images for automated detection of the coronavirus disease 2019 (COVID-19) patients. We obtained seven hundred and fifty-seven (757) CT-scan images from a public platform. We applied four automated traditional classification methods to predict COVID-19 using deep learning and machine learning. These algorithms are SVM, AdaBoost, NASNetMobile, and InceptionV3. Comparative analyses are presented among the four models by considering metric performance factors to find the best model. The results show that the InceptionV3 model achieves better performance in terms of accuracy, precision, recall, Cohen’s kappa, F.- score, root mean squared error (RMSE), and receiver operating characteristic- area under the curve (ROC-AUC), in comparison with the other Covid-19 classifiers. Accordingly, the InceptionV3 approach is recommended for the automatic diagnosis of Covid-19 and assessments. This research can present a second point of view to medical experts and it can save time for researchers as the performance of standard machine learning methods in detecting COVID-19 is evaluated.
Keywords: coronavirus, machine learning, SVM, AdaBoost, NASNetMobile, InceptionV3.
Ciência da Computação
Automatic Classification of COVID-19 using CT-Scan Images
Universidade Estadual de Maringá
Recepción: 11 Agosto 2020
Aprobación: 15 Noviembre 2020
Automated detection approaches based-on artificial intelligence (AI) techniques have increased in scientific fields (Ozturk et al., 2020). Many tasks included by the machine learning (ML) methodology of analyzing a medical image may also be applied using deep learning methods (Farhat, Sakr, & Kilany, 2020). Deep learning (DL) is a type of machine learning (Goodfellow, Bengio, & Courville, 2016). With the increase in the power of computers, machine learning has started being used in the medicine field (Latif, Xiao, Imran, & Tu, 2019). Thus, the information we obtain from medical images has been diversified (Wernick, Yang, Brankov, Yourganov, & Strother, 2010) such as prediction of medical cases (Kuhlmann, Lehnertz, Richardson, Schelter, & Zaveri, 2018), computer-aided detection (Shin et al., 2016) and diagnosis (Kermany et al., 2018). In addition, deep learning architectures are used in many areas such as classification, registration, regression, clustering, segmentation, and image reconstruction (Hatcher & Yu, 2018; Sahiner et al., 2019). As of 5 November 2020, the Coronavirus disease (COVID-19) pandemic has spread to 216 countries, 1 211 986 deaths has been reported, and 47 362 304 cases has been confirmed in the world by the World Health Organization (WHO, 2020). COVID-19, which had started to spread from Wuhan (China) as of the end of December 2019 (Huang et al., 2020; Wu et al., 2020), today has affected the whole world. Computed tomography (CT) uses a major supportive method (Zhu et al., 2020; Ojha, Mani, Pandey, Sharma, & Kumar, 2020; Wang et al., 2020) using real-time polymerase chain reaction (RT-PCR) for the diagnosis of COVID-19 (Corman et al., 2020;Fang et al., 2020). CT plays a vital role in the early identification of COVID-19 pneumonia (Zu et al., 2020; Hani et al., 2020). CT findings and differential diagnosis in COVID-19 have been reported in the different researches in literature (Salehi, Abedi, Balakrishnan, & Gholamrezanezhad, 2020). Pereira, Bertolini, Teixeira, Silla Jr., and Costa (2020) have proposed a classification schema considering multi-class classifications and hierarchical classification using chest X-ray images since pneumonia can be structured as a hierarchy. A mathematical approach based on machine learning algorithms was devised to identify biomarkers of COVID-19 patient mortality (Yan et al., 2020). AI -based techniques are used to perform definite tasks on many types of diseases using various medical images (Farhat et al., 2020). In addition, a few types of research about AI-based detection algorithms for COVID-19 are presented in the literature. A review of artificial intelligence techniques in the detection and classification of COVID-19 medical images has been presented by Albahri et al. (2020). The literature was limited to articles published from January 1, 2020, until the time of today.
This study aims to detect automatic COVID-19 patients using CT-Scan images and SVM, AdaBoost, NASNetMobile, InceptionV3 algorithms. This paper presents an overview of the literature of machine-deep learning applications to the specific of COVID-19 detection. Although radiologists play a vital role due to their experience in COVID-19 detection, accurate and fast AI models may be helpful for early diagnosis prediction and also these models may provide time and may save costs (Caobelli, 2020; Ozturk et al., 2020).
This paper is structured as follows: Section 2 explains briefly models and the framework of the algorithms is presented visually. Data collection and features are also presented. Then, Statistical approaches are given. In section 3, results and comparative performance of the proposed machine and deep learning classifiers are investigated and discussed. In section 4; finally, the conclusions have been given.
Machine learning techniques have been applied to CT-scan image classification. In this study, we first introduce the fundamentals of algorithms for image classification and then introduce an application of the classification of COVID-19 CT-scan images. Two different approaches are presented in the study. The first is the GPU and the same dataset, the second is the CPU and random dataset approach. Thus, the responses of the algorithms for the two situations are evaluated.
Python programming language was used to train the models. We used the keras deep learning library with the tensorflow backend to implement our models and the scikit-learn machine learning library to implement our models. This study was done on a laptop equipped with an Intel i5 processor, 6 GB of RAM, and a GTX 940MX NVidia GPU with 2GB of VRAM. We collected 757 CT-scan images - 216 patient cases from GitHub (2020) that is a public platform and got 328 CT images labeled as being positive for COVID-19. CT-scan images have different sizes and different standards. The minimum, average, and maximum height are 153 pixels, 491 pixels, and 1853 pixels. And the minimum, average, and maximum width are 124 pixels, 383 pixels, and 1485 pixels (Yang et al., 2020). We retrospectively analysed and evaluated the data set. Because of the heterogeneity of data, the process of all of the CT-scan images was performed in accordance with the standard pre-processing (size-pixels). The CT-scan images were divided into two different classes with COVID-19 and non-COVID-19. The classification is the main task in deep learning and machine learning for the early treatment of the patient (Latif et al., 2019). The classification can use multiple images as input with a single diagnostic output class as a result of COVID-19 or non-COVID-19. Table 1 presents methods used and statistics of the same dataset for COVID-19 prediction.
Table 1. Distribution of images used algorithms.

The support vector machine (SVM) algorithm was discovered by Vapnik (1998). SVM is a supervised machine learning algorithm and is a discriminative classifier formally defined by a separating hyperplane that is given labelled training data. It gives an output of an optimal hyperplane that categorizes new examples (Machine Learning, 2020). SVM builds a hyperplane or set of hyperplanes in a high or infinite-dimensional space. Intuitively, the best splitting is achieved by the hyper-plane with the largest distance to any class’s nearest training data points (Smola & Schölkopf, 2004). It is effective in high-dimensional spaces and easy to train. The radial based kernel function is used during the training data for the training datasets that must remain within the specified boundaries (Jain et al., 2020) (Figure 1).
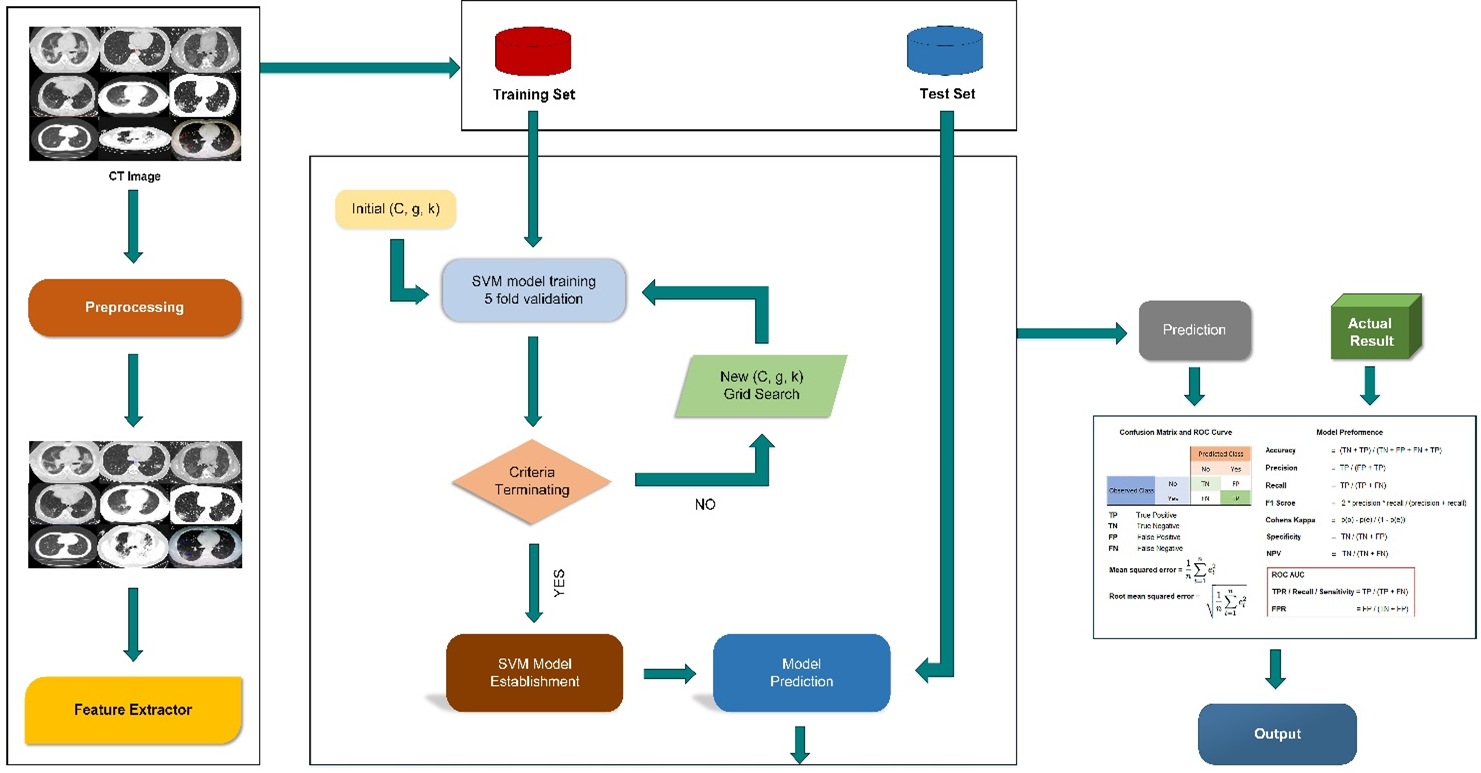
Figure 1. Framework of the SVM.
The AdaBoost algorithm is a machine learning algorithm introduced in 1995 by Freund and Schapire (Freund & Schapire, 1997). Adaboost is an iterative ensemble method boosting classifier. Badly classified data take a higher weight than well-classified data (Maaji, Cosma, Taherkhani, Alani, & McGinnity, 2018). It is not appropriate to directly handle the multiple classification problems. It can be made by converting into a few binary classification problems (Luo, Dai, Chen, Chen, & Jian, 2020). The AdaBoost classifier trained interactively on different weighted training samples and each iteration, tried to minimize the training error (Figure 2).
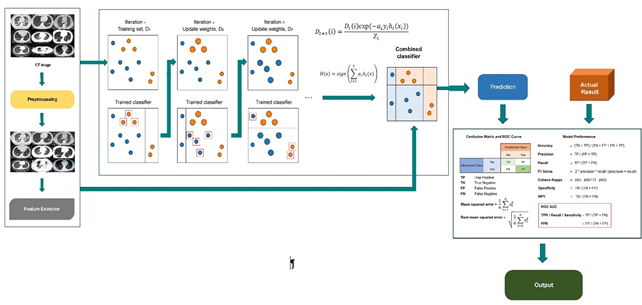
Figure 2. Framework of the Adaboost.
The InceptionV3 model is Convolution Neural Network, developed by Szegedy in 2015 (Szegedy et al., 2015). It has got three versions as inceptionV1, inceptionV2, and inceptionV3. VersionV3 has several symmetrical and asymmetrical building blocks. It has parallel convolution layers with a 3D filter. Each block consists of several branches of convolutions, average pooling, max-pooling, concatenated, dropouts, and fully-connected layers (Hemdan, Shouman, & Karar, 2020) (Figure 3).
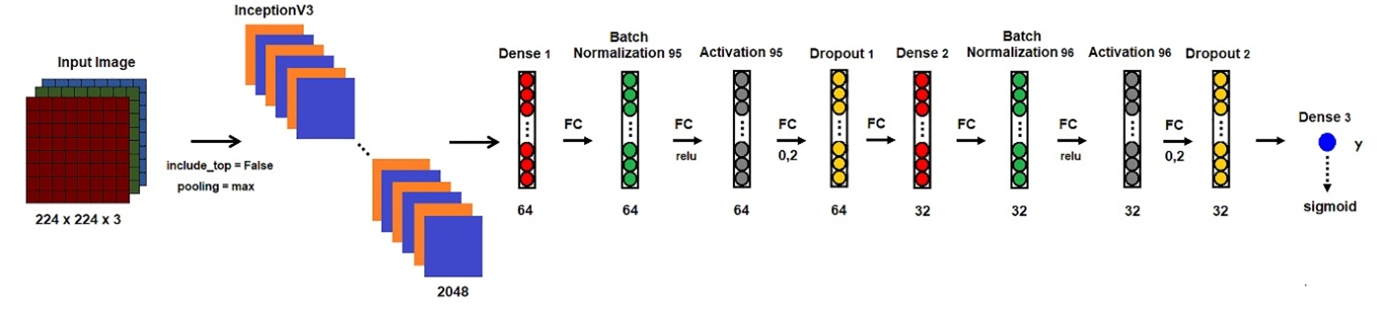
Figure 3. Framework of the InceptionV3.
NASNet is a scalable CNN architecture that consists of a cell that combines blocks that are optimized using reinforcement learning (Zoph, Vasudevan, Shlens, & Le, 2018). The NASNet architecture has got two versions as NASNetLarge and NASNetMobile. NASNetMobile consists of 12 cells with 5.3 million parameters and 564 million multiply-accumulates (Saxen et al., 2019) (Figure 4).
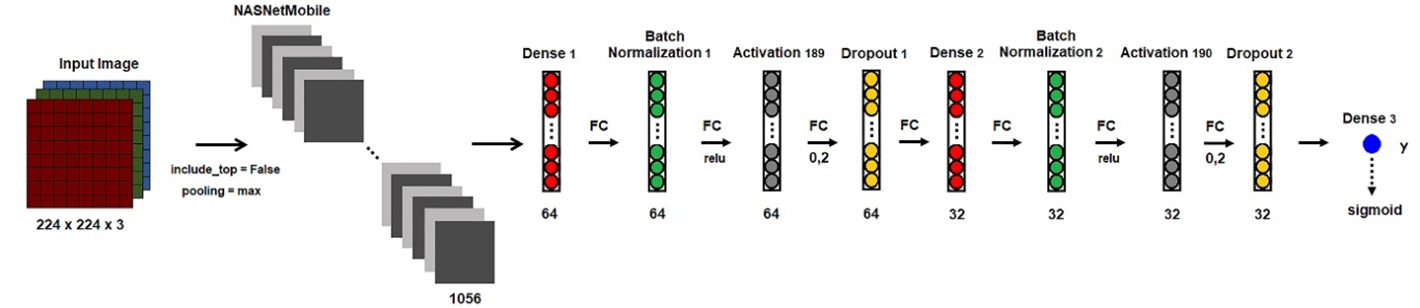
Figure 4. Framework of the NASNetMobile.
Statistical analyses were performed using RMSE, Accuracy, Precision, Recall, F1-score, Cohen’s kappa, ROC curve for performance assessment. The receiver operating characteristic (ROC) curve is a probability curve for different classes. The area under the curve (AUC) can be considered as a summary of model skill, in other words, model performance (Tilaki, 2013). RMSE (root mean square error) is the standard deviation of the residuals (prediction errors). Parameters are defined as follows (Perez, Tah, & Mosavi, 2019):
where: TP is the number of true positives, FP is the number of false positives, FN is number of false negatives, and TN is the true negative.
Accuracy= (TP + TN)/ (TP + TN + FP + FN) (1)
Precision= TP / (TP +FP) (2)
Recall= TP / (TP + FN) (3)
F1 score=2*(Recall * Precision) / (Recall + Precision) (4)
Cohen's kappa statistic (κ);
The following formula is defined for agreement between two rates;
 (5)
(5)where: po is the relative observed agreement among raters; pe is the hypothetical probability of chance agreement.
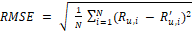 (6)
(6)where: R_(u,i)^' is estimated value and R_(u,i) is real value.
Table 2 and Table 3 summarise the hyper-parameters used during the training of the different classifiers for the same test and val. Batch_size (64) was selected according to our CPU performance. In deep learning-based architectural studies, the performances may vary according to the parameters used. The best performing optimization method was Adam. Epoch 50 was chosen and binary cross-entropy loss use for only two label classes (COVID-19 and non-COVID-19). Random State (0) was selected.
Table 2. Hyper-parameter for deep learning architectures.

Table 3. Hyper-parameter for machine learning architectures.

Default "SVC", which is the GridSearchCV parameter, is used and default "rbf "was selected for kernel type and regularization parameter (C) is used as 10 for SVM. n_estimators were used 100 (int) , algorithm "SAMME" was selected for a multiclass boosting algorithm and Random_state was selected none for AdaBoost model.
Table 4 and 5 present the hyper parameters used in the random dataset. 100 epochs and batch_size (32) are used. We provided the best accuracy and learning in 100 epochs. Default parameters are used for Adaboost model and SVM model.
Table 4. Hyper-parameter for deep learning architectures (random select).

Table 5. Hyper-parameter for machine learning architectures (random select).

In the present study, the classifiers’ performance of the machine and deep learning algorithms for detecting COVID-19 were investigated. We performed experiments to detect and classify COVID-19 using CT-scan images in four standards methods. First, we have trained the models to classify CT scan images into two categories: COVID-19 and non-COVID-19.
Firstly, all classifiers were trained using GPU for 50 epochs. The result of confusion matrixes for the binary classification in detecting COVID-19 is shown in Table 6. Also, RMSE, MSE, Accuracy, Precision, Recall, F1 score, Cohen’s kappa, and ROC curve results for the binary classification comparative are given in Table 7 for the same test and same validation dataset. Figure 5 shows the accuracy and loss during training and validation per epoch for the InceptionV3 model and a comparison of ROC curves for four architectures trained in Figure 6 for the same test and same validation dataset.
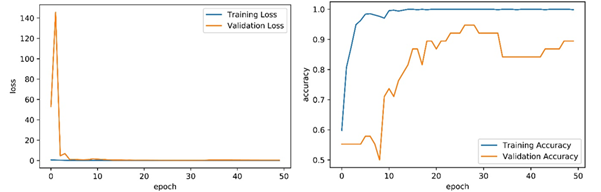
Figure 5. Training loss (left) and accuracy (right) obtained for InceptionV3 model.
Table 6. Comparative confusion matrix of models.

We have obtained FN value of 2 for InceptionV3. The lower the RMSE value, the higher the predictive performance of the InceptionV3 model.
Table 7. Comparison of the performances of the algorithms.

The results showed the highest classifier performance as an accuracy of 81.6%, a recall of 86.7%, F1-score of 78.8%, a Cohen’s kappa of 62.8%, and an AUC of 82.5% for the InceptionV3 model and a precision of 81.8 % for NASNetMobile.
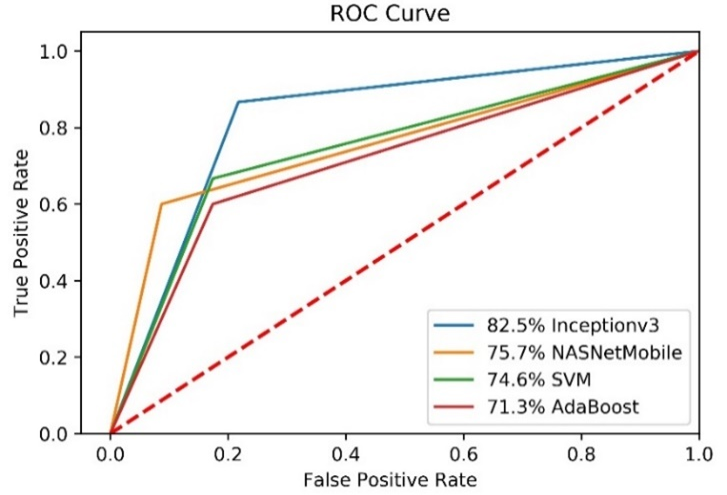
Figure 6. ROC curves of models.
Among all classifiers trained for 50 epochs, our proposed InceptionV3 appears to be the classifier with the best performance in terms of accuracy, recall, Cohen’s kappa, F1-score, RMSE.
Secondly, the results of the models trained with the second approach random dataset and 100 epochs in our study are presented using the CPU below. Here, the performance of the models in CPU and GPU was measured with a personal computer. Table 8 shows the confusion matrix results of the models.
Table 8. Comparative confusion matrix of models using random dataset..

InceptionV3 model showed the best estimation with 1 FN. Performance indicators including accuracy, precision, recall, F1-score, Cohen’s kappa, and ROC (AUC) are given for all classifiers in Table 9.
Table 9. Performance comparison of classifiers using CPU.

The results showed the highest classifier performance as an accuracy of 94.7%, a recall of 95.2%, F1-score of 95.2%, a Cohen’s kappa of 89.4%, a precision of 95.2 %, and an AUC of 94.7% for the InceptionV3 model.
The training loss and training accuracy graph of the InceptionV3 model, which shows the best performance among the classifiers, is shown in Figure 7.
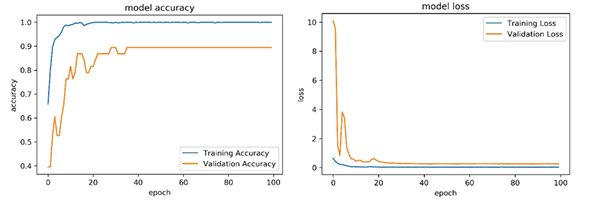
Figure 7. Training loss (right) and accuracy (left) obtained for InceptionV3 model In order to compare the performance of all models, the ROC is plotted (Figure 8).
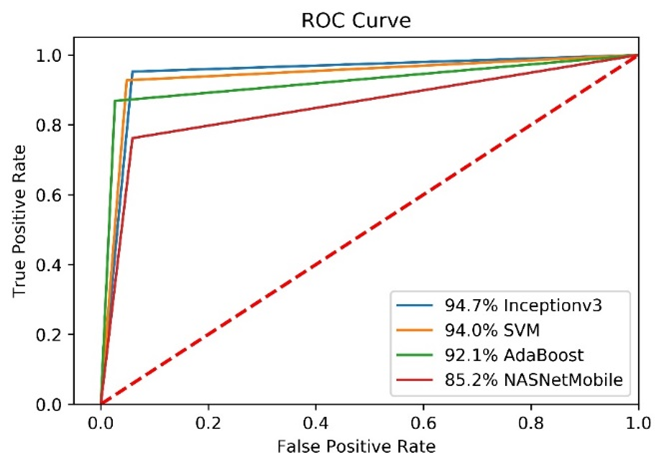
Figure 8. ROC curves of models.
As a result, the InceptionV3 model had better performance than SVM (GridSearchCV), AdaBoost and NASNetMobile models. The SVM algorithm took about 7e-07 seconds and InceptionV3 algorithm took about nine hours using CPU.
In this study, four standards of methods were used for the detection of COVID-19. We have used a total of 757 images to train existing models. We evaluate comparative performance to each other models using CPU and GPU in the study. We have limitations of the study the use of a limited number of COVID-19 CT-scan images and PC performance.
The performance of the proposed InceptionV3 was evaluated and compared with three standard methods (SVM, AdaBoost, and NASNetMobile) on a public COVID-19 dataset. The evaluation results show that the InceptionV3 model produces more accurate classification results using CPU (random test and val) and GPU (same val and test) practice for automatic detection of COVID-19. The AdaBoost model showed the lowest performance in both approaches. The non-standard public dataset of CT-scan images was used in this study for classifying negative and positive COVID-19 cases. We used to improve the accuracy by applied pre-processing for the COVID-19 disease to CT-scan images (size-pixels). We intended to provide an outline for researchers to know the existing ML and DL techniques carried out for COVID-19 prediction and highlight these algorithms' advantages. Finding a method that can help in the diagnosis of this disease, using high accuracy and fast method, may be helpful for radiologists. Thus, saving time can be significantly provided, and it can reduce staff workload. Recently advances in the field of machine learning and deep learning have been evaluated deep learning algorithms and machine learning algorithms on their applicability for COVID-19 detection for a complement option. The main challenge in a deep learning-based CT image classification is the small dataset and PC RAM. The public COVID-19 dataset has limited, which is the main limitation of this study.
As future work, we hope to build a more extensive dataset to apply our new technique. Besides, with a larger dataset, we can also test the existing machine and deep learning methods with a training approach.
Thanks to Veysel Turk and Serhat Kaya for pre-implementation support.
catal@yahoo.com.tr
Table 1. Distribution of images used algorithms.
Figure 1. Framework of the SVM.
Figure 2. Framework of the Adaboost.
Figure 3. Framework of the InceptionV3.
Figure 4. Framework of the NASNetMobile.
Table 2. Hyper-parameter for deep learning architectures.
Table 3. Hyper-parameter for machine learning architectures.
Table 4. Hyper-parameter for deep learning architectures (random select).
Table 5. Hyper-parameter for machine learning architectures (random select).
Figure 5. Training loss (left) and accuracy (right) obtained for InceptionV3 model.
Table 6. Comparative confusion matrix of models.
Table 7. Comparison of the performances of the algorithms.
Figure 6. ROC curves of models.
Table 8. Comparative confusion matrix of models using random dataset..
Table 9. Performance comparison of classifiers using CPU.
Figure 7. Training loss (right) and accuracy (left) obtained for InceptionV3 model In order to compare the performance of all models, the ROC is plotted (Figure 8).
Figure 8. ROC curves of models.
