Ciência, Tecnologia Alimentar e Engenharia de Alimentos
Recepción: 31 Agosto 2020
Aprobación: 09 Noviembre 2020
DOI: https://doi.org/10.4025/actascitechnol.v43i1.55567
Abstract: Blueberry and raspberry pomace are a rich source of bioactive compounds that have not been commercially utilized yet, and ultrasound-assisted technology can efficiently extract these compounds. Also, the use of water as a solvent added to the ultrasound-assisted technology improves this eco-friendly process. Therefore, an aqueous eco-friendly extraction, including extraction time and ultrasound presence or absence (conventional extraction) was performed in order to extract bioactive compounds from blueberry and raspberry pomace. Response parameters included levels of anthocyanins, phenolic compounds, and flavonoids, and antioxidant activity determined by DPPH, ABTS, and FRAP methods. Analysis of variance results indicated that ultrasound-assisted extraction for 45 min. was feasible to extract the bioactive compounds. The antioxidant content of the extract obtained by the ultrasound-assisted process was 1.4 times higher on average and the total phenolic concentration was 1.6 times higher (for blueberry 5.02 and for raspberry 2.53 mg gallic acid equivalent/g) compared with those obtained by the conventional process. Thus, the ultrasound-assisted extraction method can be a profitable alternative to extract bioactive compounds from blueberry and raspberry pomace, as it is energy efficient, requires fewer chemicals, and produces less effluent. This eco-friendly technology is therefore viable for food, nutraceutical, and cosmetic industries, and also for reducing food waste.
Keywords: Eco-friendly, experimental design, antioxidant analysis, anthocyanins.
Introduction
Blueberry belongs to the genus Vaccinium and family Ericaceae (He et al., 2016) and is a rich source of dietary bioactive compounds such as organic acids and polyphenols, and especially anthocyanins (Wu et al., 2018). Raspberry is a fruit belonging to the genus Rubus and family Rosaceae (Kim, Sutton, & Harris, 2016). Similar to blueberry, raspberry is also a rich source of phenolic compounds (mainly anthocyanins) and ellagitannins (Kula, Majdan, Głód, & Krauze-Baranowska, 2016).
Anthocyanins are the largest group of water-soluble pigments found in the plant kingdom and are available in a variety of colors (red, blue, and purple). They are widely studied as natural coloring agents used in foods (Yousuf, Gul, Wani, & Singh, 2016). Consumption of anthocyanin-rich plant-based foods is beneficial for human health as these pigments exhibit anti-diabetic, anti-inflammatory, anti-carcinogenic, and antimutagenic effects, and function as scavengers of oxidative radicals (Avram et al., 2017; Orellana-Palma, Petzold, Pierre, & Pensaben, 2017).
Processing of fruit produces about 20%–60% of peel, seeds, stem, and pulp, which have bbeen recognized as a rich source of bioactive compounds (Amaya-Cruz et al., 2015; Kowalska, Czajkowska, Cichowska, & Lenart, 2017). Generally, large quantities of fruits are processed to produce juices, and the pomace is treated as a waste product (Avram et al., 2017).
Thus, it is very important to study the application of eco-friendly and efficient technologies to extract and transform pomace as a potential source of nutrients. One such eco-friendly technology is the ultrasound technique that exerts a cavitation effect in the solvent, thereby breaking the matrix cell wall and producing a high-quality extract efficiently (He et al., 2016; Wen et al., 2018; Wizi et al., 2018).
The ultrasound technique has been recently used in some food studies to improve the extraction of bioactive compounds. For example, a study applied different methods to recover anthocyanins from the pomace of blackberries, blueberries, and grumixama, and found that ultrasound-assisted extraction was the most efficient (Machado, Pereira, Barbero, & Martínez, 2017). Another study that used the ultrasound-assisted extraction technique on blueberry pomace reported higher anthocyanin and phenolic compound concentrations than those obtained by the conventional extraction method (He et al., 2016). In addition, the use of ultrasound-assisted extraction method improved the bioactive compounds in a raspberry puree study (Golmohamadi, Möller, Powers, & Nindo, 2013).
The use of blueberry and raspberry pomace for extracting bioactive compounds is promising because it uses a by-product from the fruit processing industry. The extract obtained is a useful ingredient in the food or pharmaceutical industries, mainly because of the high concentration of antioxidants, which have considerable human health benefits. Therefore, the objective of this study was to evaluate the ultrasound-assisted technique for extracting bioactive compounds from blueberry and raspberry pomace as an antioxidant source.
Material and methods
Materials
Blueberry (Vaccinium myrtillus) and raspberry (Rubus idaeus) pomace were purchased from the same batch from a pulp producer in the Paraibuna city in the state of São Paulo and were kept frozen (−18°C) until their use. The reagents used were of analytical grade.
Experimental design
Initially, the extraction process of bioactive compounds from blueberry and raspberry pomace was optimized using a factorial experimental design (22), including four points (in triplicate) under a similar set of conditions. The moisture content of blueberry (B) and raspberry (R) pomace was 72.89% and 53.91%, respectively. Both the pomace were diluted with distilled water at a concentration of 500 mg mL-1, according to preliminary tests. Extraction variables were as follows: extraction time (X1 =15 or 45 min.) and ultrasound (X2 =0, absence or X2 = 100%, presence) with the temperature manually controlled and maintained at around 60 ±3°C by considering an increase in temperature caused by the ultrasound treatment (He et al., 2016). For the ultrasound absence variable, the conventional extraction was performed in a conventional bath (Nova Orgânica) without agitation, while for the ultrasound presence variable, ultrasound-assisted extraction (UAE) was performed in an ultrasonic bath (Ultracleaner 1650 Unique, 40 kHz frequency, 120 Watts RMS power).
Response surface graphs were plotted to evaluate response parameters such as total monomeric anthocyanins, total phenolic compounds, total flavonoids, and antioxidant activity by 2,2-diphenyl-1-picrylhydrazyl (DPPH); 2,2'-azino-bis(3-ethylbenzothiazoline-6-sulfonic acid) (ABTS); and ferric reducing antioxidant potential (FRAP) methods.
Total phenolic compounds
The total phenolic compounds (TPC) analysis was performed by using Folin–Ciocalteu reagent and sodium carbonate solution (Na2CO3). The absorbance was measured using a spectrophotometer (Femto 700 plus) at 725 nm (Pierpoint, 2004; Singleton & Rossi, 1965). Gallic acid was used as the standard for the analytical curve (y = 0.006x). Results were expressed as dry weight in µg of gallic acid equivalent (GAE) mg-1 of extracts.
Total monomeric anthocyanins content
Total monomeric anthocyanins (TMA) were estimated by the differential pH method (Lee, Durst, & Wrolstad, 2005). The absorbance was measured using a spectrophotometer at 520 and 700 nm after an incubation of 20 min. at 25°C. Results were expressed as dry weight in µg cyanidin-3-glucoside mg-1 of extracts, according to equations 1 and 2.
 [1]
[1]
 [2]
[2]Where: MW = 449.2 g. mol−1 (molar mass of cyanidin-3-glucoside); 1000 = conversion factor from g to mg; Ɛ = 26900L. mol−1 (molar absorptivity of cyanidin-3-glucoside); ƛ = 1 cm (optical length of the cuvette); C = sample concentration.
Determination of total flavonoids
The analysis of total flavonoids (TF) was performed by the spectrophotometric assay using 10% aluminum chloride (AlCl3), 5% sodium nitrite (NaNO2), and 1 M sodium hydroxide (Alothman, Bhat, & Karim, 2009). The absorbance was immediately measured using a spectrophotometer at 510 nm. An analytical curve (y = 0.0005x) was plotted using the standard solution of quercetin, and the results were expressed as dry weight in µg quercetin equivalent (QE) mg-1 of extracts.
Antioxidant activity analyses
The reduction of the stable radical DPPH was determined by the spectrophotometric assay at 515 nm (Thaipong, Boonprakob, Crosby, Cisneros-Zevallos, & Byrne, 2006). Trolox was used as the standard for the analytical curve (y = 0.1175x + 0.8729). The efficiency of the sequestering activity was calculated, and the results were expressed as dry weight in µM Trolox equivalent (TE) mg-1 of extracts.
The antioxidant activity by the ABTS method was determined using the ABTS and potassium persulfate (K2S2O8) reagents (Nenadis, Wang, Tsimidou, & Zhang, 2004). The absorbance was measured using a spectrophotometer at 734 nm after an incubation of 6 min. at 25°C. An analytical curve (y = −0.0003x + 0.6586) was plotted using the standard solution of Trolox, and the results were expressed as dry weight in µM Trolox equivalent (TE) mg-1 of extracts.
The antioxidant activity by the FRAP method was determined by mixing the extracts with distilled water and FRAP reagent. The samples were maintained at 37°C in a water bath, and then absorbance was measured using a spectrophotometer at 595 nm). An analytical curve (y = 0.0006x - 0.0149) was plotted using the standard solution of Trolox, and the results were expressed as dry weight in µM Trolox equivalent (TE) mg-1 of extracts (Pulido, Bravo, & Saura-calixto, 2000).
Statistical analysis
The statistical software STATISTICA version 7.0 was used for the construction of experimental design and for the analysis of variance (ANOVA), for determination of the individual linear and interaction regression coefficients, and for plotting response surface graphs to visualize the simultaneous effect of each variable on each response parameter. The significance of all the terms of the polynomial equation was determined statistically, and a p-value of < 0.05 was considered statistically significant. The analytical curves for the antioxidant analyses were plotted using the Graph Pad Prism 5 software.
Results and discussion
Table 1 shows the experimental design with the independent variables and experimental data for the response parameters such as TPC, TMA, TF, DPPH, ABTS, and FRAP of blueberry and raspberry pomace.
Previous studies have shown the cavitation effect of UAE in fruits, in which the solvent enabled efficient extraction of bioactive compounds (He et al., 2016; Wen et al., 2018;Wizi et al., 2018).
Another study has reported the values of 2.47 mg GAE g-1 for TPC, 1.36 mg cyanidin-3-glucoside g-1 for TMA, 19.36 µmol TE g-1 for ABTS, and 50.16 µmol TE g-1 for FRAP using blueberry pomace and UAE combined with hydroalcoholic solvents (Machado et al., 2017). These results of TPC, ABTS, and FRAP are similar to that of the present work (Table 1), while the TMA value is higher than that found in the present work (0.27 to 0.59 µg cyanidin-3-glucoside mg-1). Another study on blueberry obtained the TPC of 4.11 mg cyanidin-3-glucoside g-1, and TMA of 16.01 mg GAE g-1, which are higher than the present study, and the conditions used were 60°C, 25 min., and 70% ethanol for extraction (He et al., 2016).
Another study has shown that two varieties of raspberry pomace contain about 26.3 to 43.7 mg GAE g-1 of TPC, 2.32 to 4.28 mg cyanidin-3-glucoside g-1 of TMA extracted using 80% methanol and 0.05% acetic acid (Četojević-Simin et al., 2015). In contrast to this finding, our study showed lower TPC and TMA, probably because of the use of the aqueous extraction method and UAE time.
Table 1. Experimental design with the independent variables and experimental data for the responses.

Blueberry: means followed by the same lowercase letters on column did not differ among themselves by Tukey’s test (p < 0.05). Raspberry: means followed by the same uppercase letters on column did not differ among themselves by Tukey’s test (p < 0.05). X1 and X2 presents extraction time and ultrasound absence or presence, respectively; B: blueberry; R: raspberry; CE: conventional extraction; UAE: ultrasound-assisted extraction; Iµg GAE mg-1 of extracts; IIμg cyanidin-3-glucoside mg-1 of extracts; IIIµg EQ mg-1 of extracts; IV, V and VIµM TE mg-1 of extracts.
The use of hydroalcoholic solvents has been reported to improve phenolic compounds and anthocyanins recovery compared with pure solvents (Garcia-Mendoza et al., 2017). However, the use of water as a solvent could be feasible to reduce the use of organic solvents like ethanol and methanol in fruit extraction, to make the process eco-friendly as employed in the present study.
By comparing B-UAE2 and R-UAE2 (Table 1), it can be observed that they have the highest values of all bioactive compounds analyzed. B-UAE2 had higher TPC, TMA, TF, DPPH, ABTS, and FRAP than R-UAE2, which shows that blueberry has 100% more bioactive compounds than raspberry.
Figures 1 and 2 show the response surface for bioactive compound extraction from blueberry and raspberry pomace, respectively. Tables 2 and 3 show ANOVA estimates the effect of factorial experimental design (22) from blueberry and raspberry pomace, respectively.
The highest extraction values for bioactive compound analysis (TPC, TMA, TF) and antioxidant activity (DPPH, ABTS, and FRAP) of blueberry pomace were obtained in a region at 45 min. and ultrasound presence (Figure 1). The ANOVA effect estimates for bioactive compound extraction from blueberry pomace (Table 2) showed that time (X1), UAE (X2), and the interaction between time and UAE (X1X2) were significant (p < 0.05) for all response variables.
The UAE method was found to be more efficient than the conventional method to extract TPC and TMA from blueberry pomace (Vaccinium ashei), using an optimum temperature average of 60°C (He et al., 2016). Another study used different methods combined with solvents to improve anthocyanin recovery from blackberry pomace, and the studies have reported that the use of UAE combined with hydroalcoholic solvents was the most efficient method for this extraction (Machado et al., 2017).
Response surface for bioactive compounds extraction from raspberry pomace (Figure 2) and ANOVA effect estimates (Table 3) showed that time (X1) and ultrasound presence UAE (X2) were significant (p < 0.05) for TPC, TMA, DPPH, and ABTS. The interaction between time and UAE (X1X2) was significant only for the ABTS method.
It was observed that time (X1) was significant for TF, but UAE (X2) and interaction (X1X2) were not significant. UAE (X2) was significant for FRAP but time (X1) and interaction (X1X2) were not. Nevertheless, the results suggested that the optimized extraction of raspberry pomace was in a region at 45 min. and ultrasound presence (Figure 2), as observed for blueberry pomace.
A raspberry puree study showed that ultrasound treatment had a significant and positive effect on bioactive compound extraction (Golmohamadi et al., 2013). In a previous study, the optimum UAE conditions of grape pomace were 40 kHz of ultrasound frequency and 25 min. of extraction time (González-Centeno et al., 2014).
Therefore, the use of UAE is energy efficient, less quantity of chemicals is required, and produces less effluent. This eco-friendly technology along with water as a solvent, can provide a good alternative to extract bioactive compounds from fruit pomace (Machado et al., 2017).
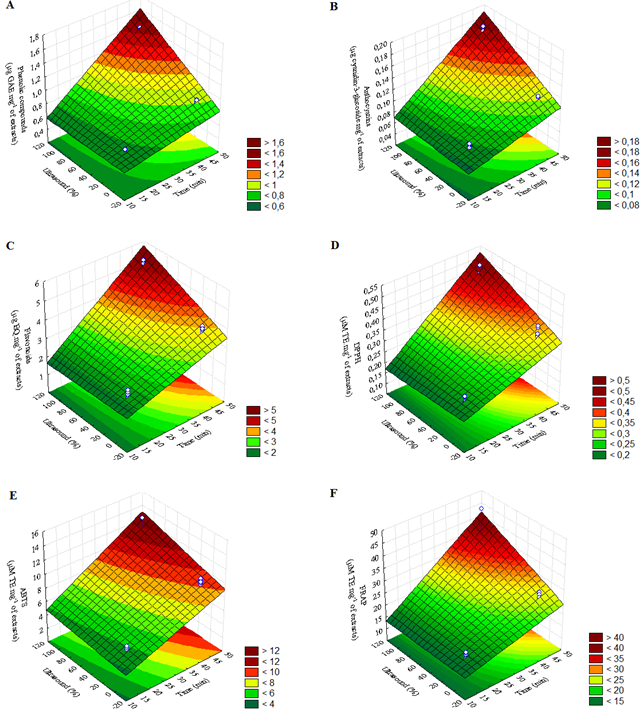
Figure 1. Response surface for bioactive compounds extraction from blueberry pomace. (A) TPC: Y = 0.2325X1 + 0,1350X2 + 0,1121X1X2; (B) TMA: Y = 0.0290X1 + 0.0158X2 + 0.0110X1X2; (C) TF: Y = 1.0925X1 + 0.3687X2 + 0.3275X1X2; (D) DPPH: Y = 0.0926X1 + 0.0289X2 + 0.0282X1X2; (E) ABTS: Y = 2.5695X1 + 0.9112X2 + 0.4053X1X2; (F) FRAP: Y = 7.2095X1 + 2.9735X2 + 2.4056X1X2.
Table 2. ANOVA effect estimates to factorial experimental design (22) response surface methodology to blueberry pomace

X1 and X2 presents extraction time and ultrasound absence or presence, respectively. *Significant at p < 0.05; Coeff: Coefficient.
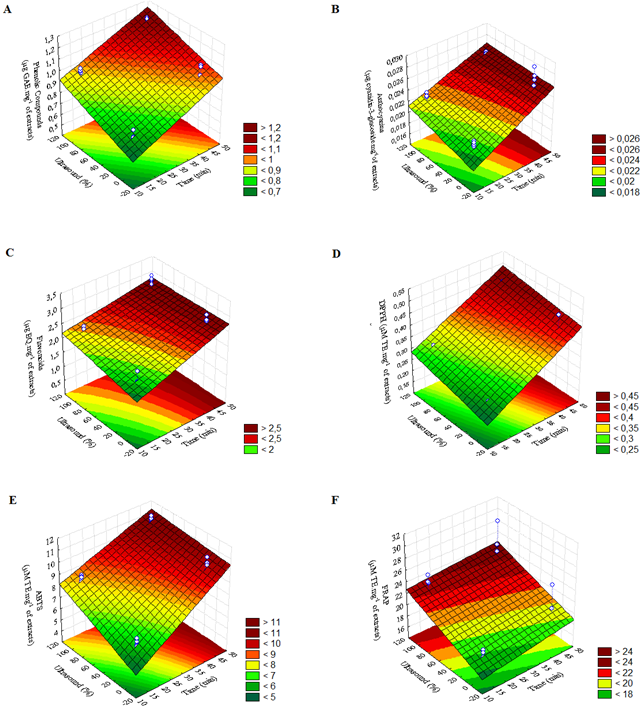
Figure 2. Response surface for bioactive compounds extraction from raspberry pomace. (A) TPC: Y = 0.1283X1 + 0.0910X2 - 0.0041X1X2; (B) TMA: Y = 0.0024X1 + 0.0007X2 – 0.0003X1X2; (C) TF: Y = 0.3254X1 + 0.1056X2 - 0.0699X1X2; (D) DPPH: Y = 0.0803X1 + 0.0248X2 – 0.0023 X1X2; (E) ABTS: Y = 1.6162X1 + 0.7129X2 – 0.3117X1X2; (F) FRAP: Y = 0.7222X1 + 2.0426X2 – 0.1057 X1X2.
Table 3. ANOVA effect estimates to factorial experimental design (22) response surface methodology to raspberry pomace.

X1 and X2 presents extraction time and ultrasound absence or presence, respectively. *Significant at p < 0.05; Coeff: Coefficient.
Conclusion
The aqueous ultrasound-assisted process was efficient in extracting bioactive compounds from the blueberry and raspberry pomace; higher content of antioxidant compounds was extracted by the ultrasound-assisted method than conventional. This process is eco-friendly technology, which has no adverse effects on the environment.
Blueberry and raspberry pomace are known sources of antioxidant compounds valuable to food applications, but the use of the aqueous-UAE process can increase their benefits to consumers. In addition, the use of fruit pomace can be feasible to reuse industrial wastes.
Acknowledgements
The authors thank the Coordination for the Improvement of Higher Education Personnel (CAPES) and the National Council for Scientific and Technological Development (CNPq) for the project financing.
References
Alothman, M., Bhat, R., & Karim, A. A. (2009). Antioxidant capacity and phenolic content of selected tropical fruits from Malaysia, extracted with different solvents. Food Chemistry, 115(3), 785–788. DOI: http://doi.org/10.1016/j.foodchem.2008.12.005
Amaya-Cruz, D. M., Rodríguez-González, S., Pérez-Ramírez, I. F., Loarca-Piña, G., Amaya-Llano, S., Gallegos-Corona, M. A., & Reynoso-Camacho, R. (2015). Juice by-products as a source of dietary fibre and antioxidants and their effect on hepatic steatosis. Journal of Functional Foods, 17, 93–102. DOI: http://doi.org/10.1016/J.JFF.2015.04.051
Avram, A. M., Morin, P., Brownmiller, C., Howar, L. R., Sengupta, A., & Wickramasinghe, S. R. (2017). Concentrations of polyphenols from blueberry pomace extract using nanofiltration. Food & Bioproducts Processing: Transactions of the Institution of Chemical Engineers Part C, 106, 91–101. DOI: http://doi.org/10.1016/J.FBP.2017.07.006
Četojević-Simin, D. D., Velićanski, A. S., Cvetković, D. D., Markov, S. L., Ćetković, G. S., Šaponjac, V. T. T., … Djilas, S. M. (2015). Bioactivity of Meeker and Willamette raspberry (Rubus idaeus L.) pomace extracts. Food Chemistry, 166, 407–413. DOI: http://doi.org/10.1016/J.FOODCHEM.2014.06.063
Garcia-Mendoza, M. d. P., Espinosa-Pardo, F. A., Baseggio, A. M., Barbero, G. F., Maróstica Junior, M. R., Rostagno, M. A., & Martínez, J. (2017). Extraction of phenolic compounds and anthocyanins from juçara (Euterpe edulis Mart.) residues using pressurized liquids and supercritical fluids. The Journal of Supercritical Fluids, 119, 9–16. DOI: http://doi.org/10.1016/j.supflu.2016.08.014
Golmohamadi, A., Möller, G., Powers, J., & Nindo, C. (2013). Effect of ultrasound frequency on antioxidant activity, total phenolic and anthocyanin content of red raspberry puree. Ultrasonics Sonochemistry, 20(5), 1316–1323. DOI: http://doi.org/10.1016/j.ultsonch.2013.01.020
González-Centeno, M. R., Knoerzer, K., Sabarez, H., Simal, S., Rosselló, C., & Femenia, A. (2014). Effect of acoustic frequency and power density on the aqueous ultrasonic-assisted extraction of grape pomace (Vitis vinifera L.) – A response surface approach. Ultrasonics Sonochemistry, 21(6), 2176–2184. DOI: http://doi.org/10.1016/J.ULTSONCH.2014.01.021
He, B., Zhang, L.-L., Yue, X. Y., Liang, J., Jiang, J., Gao, X.-L., & Yue, P.-X. (2016). Optimization of ultrasound-assisted extraction of phenolic compounds and anthocyanins from blueberry (Vaccinium ashei) wine pomace. Food Chemistry, 204, 70–76. DOI: http://doi.org/10.1016/J.FOODCHEM.2016.02.094
Kim, M. J., Sutton, K. L., & Harris, G. K. (2016). Raspberries and related fruits. In B. Caballero, P. M. Finglas & F. Toldrá (Eds.), Encyclopedia of food and health (p. 586–591). Cambridge, MA: Academic Press.
Kowalska, H., Czajkowska, K., Cichowska, J., & Lenart, A. (2017). What’s new in biopotential of fruit and vegetable by-products applied in the food processing industry. Trends in Food Science & Technology, 67, 150–159. DOI: http://doi.org/10.1016/J.TIFS.2017.06.016
Kula, M., Majdan, M., Głód, D., & Krauze-Baranowska, M. (2016). Phenolic composition of fruits from different cultivars of red and black raspberries grown in Poland. Journal of Food Composition and Analysis, 52, 74–82. DOI: https://doi.org/10.1016/j.jfca.2016.08.003
Lee, J., Durst, R. W., & Wrolstad, R. E. (2005). Determination of total monomeric anthocyanin pigment content of fruit juices, beverages, natural colorants, and wines by the pH differential method: collaborative study. Journal of AOAC International, 88(5), 1269–1278. DOI: http://doi.org/10.5555/jaoi.2005.88.5.1269
Machado, A. P. d. F., Pereira, A. L. D., Barbero, G. F., & Martínez, J. (2017). Recovery of anthocyanins from residues of Rubus fruticosus , Vaccinium myrtillus and Eugenia brasiliensis by ultrasound assisted extraction , pressurized liquid extraction and their combination. Food Chemistry, 231, 1–10. DOI: http://doi.org/10.1016/j.foodchem.2017.03.060
Nenadis, N., Wang, L.-F., Tsimidou, M., & Zhang, H.-Y. (2004). Estimation of scavenging activity of phenolic compounds using the ABTS(*+) assay. Journal of Agricultural and Food Chemistry, 52(15), 4669–4674. DOI: http://doi.org/10.1021/jf0400056
Orellana-Palma, P., Petzold, G., Pierre, L., & Pensaben, J. M. (2017). Protection of polyphenols in blueberry juice by vacuum-assisted block freeze concentration. Food and Chemical Toxicology, 109, 1093–1102. DOI: http://doi.org/10.1016/j.fct.2017.03.038
Pierpoint, W. S. (2004). The extraction of enzymes from plant tissues rich in phenolic compounds. Methods in Molecular Biology, 244, 65–74. DOI: http://doi.org/10.1385/1-59259-655-x:65
Pulido, R., Bravo, L., & Saura-calixto, F. (2000). Antioxidant activity of dietary polyphenols as determined by a modified ferric reducing/ antioxidant power assay. Journal of Agricultural and. Food Chemistry, 48(8), 3396–3402. DOI: http://doi.org/10.1021/jf9913458
Singleton, V. L., & Rossi, J. A. (1965). Colorimetry of total phenolics with phosphomolybdic-phosphotungstic acid reagents. American Journal of Enology and Viticulture, 16(3), 144–158.
Thaipong, K., Boonprakob, U., Crosby, K., Cisneros-Zevallos, L., & Byrne, D. H. (2006). Comparison of ABTS, DPPH, FRAP, and ORAC assays for estimating antioxidant activity from guava fruit extracts. Journal of Food Composition and Analysis, 19(6-7), 669–675. DOI: http://doi.org/10.1016/j.jfca.2006.01.003
Wen, C., Zhang, J., Zhang, H., Dzah, C. S., Zandile, M., Duan, Y., … Luo, X. (2018). Advances in ultrasound assisted extraction of bioactive compounds from cash crops – a review. Ultrasonics Sonochemistry, 48, 538–549. DOI: http://doi.org/10.1016/J.ULTSONCH.2018.07.018
Wizi, J., Wang, L., Hou, X., Tao, Y., Ma, B., & Yang, Y. (2018). Ultrasound-microwave assisted extraction of natural colorants from sorghum husk with different solvents. Industrial Crops and Products, 120, 203–213. DOI: http://doi.org/10.1016/J.INDCROP.2018.04.068
Wu, Y., Han, Y., Tao, Y., Fan, S., Chu, D.-T., Ye, X., … Xie, G. (2018). Ultrasound assisted adsorption and desorption of blueberry anthocyanins using macroporous resins. Ultrasonics Sonochemistry, 48, 311–320. DOI: http://doi.org/10.1016/J.ULTSONCH.2018.06.016
Yousuf, B., Gul, K., Wani, A. A, & Singh, P. (2016). Health benefits of anthocyanins and their encapsulation for potential use in food systems: a review. Critical Reviews in Food Science and Nutrition, 56(13), 2223-2230. DOI: http://doi.org/10.1080/10408398.2013.805316
Notas de autor
suelensiqueira.eng@gmail.com
