Engenharia Mecânica
Reliability analysis using experimental statistical methods and AIS: application in continuous flow tubes of gaseous medium
Reliability analysis using experimental statistical methods and AIS: application in continuous flow tubes of gaseous medium
Acta Scientiarum. Technology, vol. 43, e55825, 2021
Universidade Estadual de Maringá
Recepción: 15 Septiembre 2020
Aprobación: 17 Febrero 2021
Abstract: The motivation for the development of this work arose from the observation of maintenance in pressure vessels, which are categorized as highly hazardous security risk products. The costs of detecting failures in the production systems allow the result of the process to be safe and of good quality, using standardized tests internally within the company. The main objective of this work demonstrates the efficiency and robustness of the artificial immune system (AIS) of negative selection in the detection of failures by recognizing the vibration signals and categorizing them in the degree of probability and level of severity of failures. The intrinsic objectives are the application of the elimination of signal noise by the Wiener filter, and the processing of data-Wiener data using experimental statistics. The result of this work successfully demonstrates the precision between the experimental statistical and AIS techniques of negative selection; the robustness of the algorithm in precision and signal recognition; and the classification of the degree of severity and probability of failure.
Keywords: Structural health monitoring, artificial immune systems, negative selection algorithm, flow tubes, experimental statistical methods.
Introduction
The pressure vessel has the purpose of containing gases or liquids in a certain container that has an internal pressure different from the ambient pressure. Thus, different types of materials, dimensions and design are developed by designers to meet specific needs. The failure mode analysis studies related to the material, product design and manufacturing processes make it possible to categorize the failure, and the stress analysis, related to elastic deformation, types of fracture and corrosion, are information that, when inserted in the design projects of pressure vessels, avoid the critical risks of operation (Bickell & Ruiz, 1967; Moss & Basic, 2013). Therefore, the guarantee of structural integrity is of fundamental need in pressure vessels.
In the production system, production processes are seen as a flow of materials and operations as work performed with interaction between men and machines, which must be controlled to determine the stability of the production process (Shingo, 1981). The pressure vessel manufacturing processes, when controlled, meet the normative procedures, preventing failures from occurring in welding processes, heat treatment and mechanical forming methods (Moss & Basic, 2013).
In an industry, inspection and testing plans for the manufacture of pressure vessels must guarantee the process using destructive and non-destructive tests, such as the ASTM E1419/E1419M-15a (ASTM International, 2020) standard, which uses acoustic emission to examine the vessels pressure gauge. We can cite yet another non-destructive testing technique, the ASTM E2983 (ASTM International, 2019) standard that diagnoses the monitoring of structures during their operation, resulting in the detection, identification and monitoring of faults that affect the performance of the structure (ASTM International, 2019 ).
This work demonstrates the relevant characteristics of the application of experimental statistics and the artificial immune system through the negative selection algorithm (AIS - negative selection) in the detection and prognosis of faults in a continuous flow tube of gaseous medium, using non-destructive methods. The field of application of this work can allow engineers from different areas, including those who design pressure vessels, to use it for fault detection. Experimental statistics demonstrate a form of analysis that can be viewed up to a specific FRF (frequency response function). Then, the AIS - negative selection, allows the reading of the signals from the data-Wiener database, grouping and classifying them into the concepts of probability of failure occurrence and the degree of severity of the failure.
The reliability of a system is directly linked to statistical approaches, and these, resulting from a specific numerical modeling of a structure, the criterion of this approach is considered of equal importance in the effective development of the monitoring of the dynamic system (Chen, 2018).
The concepts of SHM and artificial immune systems (AIS) for fault detection, have been studied by different researchers (Oliveira, Chavarette, & Lopes, 2019), in this work it is demonstrated the use of AIS to detect and diagnose faults in the stator and electrical circuits of the induced motor rotor, obtaining a good performance in the application of the algorithm (Chilengue, Dente, & Branco, 2011). In (Oliveira, Chavarette, & Outa, 2020) it is demonstrated the use of the technique of artificial immune systems through the negative selection algorithm and clonal selection for the detection of failures of a rotating system, whose negative selection AIS algorithm classifies and recognizes patterns and the clonal selection algorithm is responsible for the continuous learning process. In the work by (Outa et al., 2020) the application of the negative selection AIS is demonstrated in an efficient way for the detection and prognosis of failures, considering the characteristics and conditions of the system.
This work was developed in phases, being the preparation of the experiment; the characterization of the experiment; the formation of the database of good signals (without failure) and bad signals (with failures); signal processing by the mathematical concept of the Wiener filter, resulting in the data-Wiener database; analysis of data-Wiener data using experimental statistics; analysis of data-Wiener data using negative selection AIS.
Reliability and structural health monitoring (SHM)
The ducts have the purpose of transporting fluids and particles, whose structure materials can be metal, plastic, wood, concrete or synthetic fibers. In general, the tubes are categorized considering the internal pressure of the tube, and when it exceeds 15 psi it is considered a pressure vessel (Smith & Laan, 1987).
The fluids that travel inside a pressure vessel travel through a great pulsating energy, which generally affects the performance of the installation, causing the components and the inside of the tube to be damaged, resulting in failures (Escoe, 2008). This phenomenon can be the combination of high pressures and temperatures (Chattopadhyay, 2009). The result of these failures is an unscheduled stop for line maintenance. Generally, this type of failure is caused by the fatigue of the material, resulting in cracks, which propagate until the material breaks. The internal and external forces tend to be controlled using operational procedures specified in the projects, inserting components such as: sieves, valves, grids and bubbles (Escoe, 2008).
The development projects for pressure vessels must meet safety standards, and with that, they are considered qualitative factors such as design and structural analysis, whose behavior of the material under tension defines the failure mode (Gill, 1970). The procedures for the elaboration of pressure vessel construction projects follow the standards of the document ASME Boiler and Pressure Vessel Code (Chattopadhyay, 2009).
Pressure vessels for power generation, nuclear reactions, chemical reactions, energy processing and storage must be designed in such a way that the materials meet high severity requirements in relation to pressure and temperature. The technical temperature specifications range from -20°C to 600°C, and the pressure ranges up to 140Mpa (Chattopadhyay, 2009).
In the development of the projects, the failures are predicted and the stresses are distributed so that they can be elaborated by numerical and experimental methods considering the variables of thermal shocks, dynamic principles, and actions of cyclical energies that cause fatigue (Chattopadhyay, 2009).
The production of these materials must be processed using quality control parameters, in which industrial maintenance systems contribute to guaranteeing the manufacturing process.
Production techniques, such as lean maintenance, assist the quality assurance process by adding value to the activities of the resources (Blanco & Dederichs, 2018). The concept of reliability can be introduced in the process, as an output, the result of which allows the analysis of a set of statistical information about the product's characteristic (Levitt, 2018). Thus, techniques such as structural health monitoring (SHM), when applied to analyze the product, can confirm the presence, location and orientation of damages. This technique also determines the evolution of the severity of the damage; the possibility of controlling or delaying the growth of the damage; finally, the determination of the remaining useful life in the structure considered prognosis (Gopalakrishnan, Ruzzene, & Hanagud, 2011). The SHM is considered a non-destructive testing and monitoring technique, divided into: diagnosis of component life; and in prognosis involving severity calculations of component damage (Deraemaeker & Worden, 2010; Farrar & Worden, 2013).
The SHM concept, applied in a dynamic system, uses sensors and a data acquisition system; signal processing methods; damage modeling and damage detection; mechanisms for data transfer and storage (Gopalakrishnan, 2011).
Signal processing
Wiener Filter
Vibration analysis is directly related to management decisions in the maintenance area, because through this technique it is possible to observe variations in the behavior of the components and relate them to mechanical properties. In this case, the identification and evaluation of damages are related to prognosis applied to structural safety and reliability (Yan, 2015). On the other hand, the diagnosis of failures is a process of tracking them considering its symptoms, and that requires processes of acquisition of information by sensors and signal processing, applied in a robust algorithm (Galar & Kumar, 2017).
Several filters can be used to obtain information from a signal, however, the Wiener filter is a technique that allows a continuous, one-dimensional noisy signal to be generalized to a discrete signal. Mathematically, the Wiener filter is a generalization of the integral of convolution (Kuo, 1980; Poularikas & Ramadan, 2006). The equation can be written as,
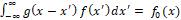 [1]
[1]an  unknown function
 (Daniele & Zich, 2014;Kailath, 1981), whose solution to this equation, written in the Fourier transform is,
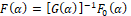 [2]
[2]where and
and  are the Fourier transforms of
 and
and , respectively, and according to the definition,
(Daniele & Zich, 2014; Kailath, 1981). The Wiener integral equation assumes the form of integration into a semi-infinite domain of 0 to , and so,
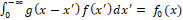 [3]
[3]for  (Daniele & Zich, 2014; Kailath, 1981). Rewriting equation 3, as a convolution product, we will have,
 [4]
[4]being , which
 is a step function unit, and
  is a new unknown that represents the continuation on the left side of the equation, for
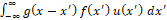
for (Daniele & Zich, 2014; Kailath, 1981). By applying the Fourier transform, in the equation, we will have,
 [5]
[5]and  and
and  are respectively the Fourier transform of the function of the right axis
  , and the function of the left axis
 , therefore, considering thus the equation in spectral form
  (Daniele & Zich, 2014).
Thus, the Wiener equation is considered a vector or a scalar. Scalars involve only scalar quantities, already in vectors, vectors are n-order, as in arguments,  and
and  , and array quantity of the same order
  . The array
  is called the Wiener operator kernel and is the reverse
 , written as
 (Daniele & Zich, 2014).
Experimental statistics
In statistical mathematics, the concept of the generalized method is a mathematical concept applied to the experiment that determines the understanding of any behavior. Probability theory studies two concepts: the first, the probability of frequency; and the second, the probability of Bayes; being both concepts, parameter suppliers for application in statistics. Statistical mathematics, on the other hand, uses two concepts to understand the behavior of a physical phenomenon: the first, the information approach; and the second, the theory of decision. The information approach maximizes estimation, while the decision theory minimizes the loss involved in making wrong decisions about the value of the parameter (James, 2006; Wolstenholme, 1999).
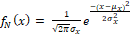
The normal or Gaussian probability density function can be used when the experimental samples are concentrated around the central value (population mean), and the equation can be written as,
 [6]
[6]where is a real positive value;
  represents the sample;
  is the sample mean. Variance can be calculated as,
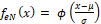
  (James, 2006; Wolstenholme, 1999). In a way, the probability density function is associated with the condition of approximation of physical measurement curves. The cumulative distribution is called the normal probability integral or error function, and the equations are written as (James, 2006; Wolstenholme, 1999),
 [7]
[7]
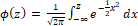 [8]
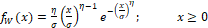
[8]The exponential probability density function is used to determine the characteristics of experimental samples of constant failure rate, determining a model of lifetime of products or materials, and the equation is described as,
 [9]
[9]where is a real positive number
 ; represents the sample. Variance can be calculated as
 , (James, 2006; Wolstenholme, 1999).
The Weibull distribution function can be used to determine the failure time of certain components, and the equation can be written as,
 [10]
[10]where, are positive real numbers. Variance can be calculated as,
 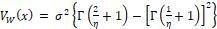 (James, 2006, Wolstenholme, 1999).
Artificial immune system: negative selection
Nature-inspired techniques have been the subject of many studies, allowing a simulation of the complex processes present in the human body of individuals (Dasgupta & Niño, 2009). Specifically, the case of Artificial Immune Systems (SIA) is used, tools extracted from immunological systems are used to solve computational problems. In this regard, there are several algorithms for the application of SIAs, however, the following mechanisms are common to most of them:
Immunological Memory and Affinity Maturation: Cells of higher affinity are cloned in the recognition of an antigen. Part becomes system memory (faster future response), part mutates to improve efficiency:
· Pattern recognition: Antibodies are able to recognize a certain amount of antigens;
· Immunological Diversity: Mutation and genetic recombination ensure immunological diversity;
· Principle of Clonal Selection: Only the antibody capable of a certain recognition will be selected in place of all others and will proliferate;
· Immunological Network Theory: Suggests a regulated network of cells and molecules that recognize themselves even without antigens present;
· Own/Non-Own Distinction.
The negative selection algorithm is based on two main phases: censoring and monitoring.
Initially, in the first stage, a set of own detectors is generated through the data present in the signals in normal condition of a given structure under analysis. These detectors are responsible for identifying whether or not a signal under further analysis is proper to a healthy organism (González, Dasgupta, & Niño, 2003, Lima, Chavarette, Souza, & Lopes, 2017). The censoring phase is exemplified in Figure 1.
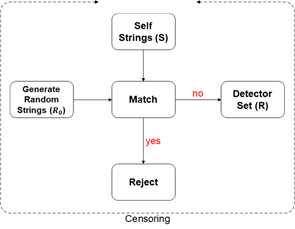
Figure 1. Negative Selection Algorithm - Censoring
The next step is the analysis and obtaining of signals from a mixed system that is, with and without flaws, that simulates an unhealthy condition. In this, we compare the detectors previously obtained with the new organism, comparing with the calculated affinity and resulting in the diagnosis of own or non-own cells which, in the work performed, are directly related to conditions of failure or non-failure (Lima et al., 2017). This phase is depicted in Figure 2.
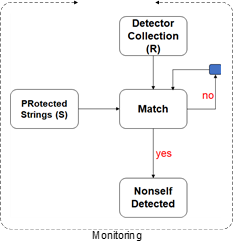
Figure 2. Negative Selection Algorithm - Monitoring
In this phase, the Affinity Rate should be calculated, which acts as a limiting of the necessary percentage of equity between the monitored signal and the detectors so that it is considered healthy (González et al., 2003, Lima et al., 2017).
 [11]
[11]where is affinity rate;
  is the number of normal chains in the problem (own chains);
  is the total number of chains in the problem (own and non-own chains).
The calculated deviation of the detector pattern has a positive and negative varied tolerance, allowing the acceptance of the combination of standards (Lima et al., 2017, Oliveira et al., 2019, Oliveira et al., 2020, Moro, Chavarette, Roéfero, & Outa, 2019). The deviation acts individually for each position of the vector, evaluating point to point. The equation is 
 [12]
[12]
 is the nominal value of the antigen Importar imagen position (standard under analysis);
  is the nominal value of the
 position minus the deviation adopted in the antibody (detector pattern);
 is the nominal value of the
  position plus the deviation adopted in the antibody (detector pattern). If the
 vector position value is within the range expressed in the condition, it can consider match for this position, and it is possible to quantify the affinity between the patterns by analyzing position by position. The total affinity measure used to evaluate the patterns under analysis is expressed by the equation (Bradley & Tyrrell, 2002),
 [13]
[13]
 is the % affinity between the patterns analyzed;
 is the total number of positions;
  is the match position;
  is the sum (quantity) of matched positions.
Validation occurs when a  is greater, equal, or similar to
 . Thus, the analyzed signals are considered equal. This condition occurring throughout the chain is classified as the normal condition chain. If is smaller, than the detector does not recognize the pattern, because validation between the chains does not occur. Resulting in abnormal classification, and possible structural damage
  (Lima et al., 2017, Oliveira et al., 2019, Oliveira et al., 2020, Moro, et al., 2019).
Material and method
The experiment and its equipment were designed to represent the behavior of a pressure vessel system, the result of which can demonstrate the simulation of the behavior of the flow of a fluid and the respective vibration of the system.
The experimental concept follows the SHM principle, which determines that the dynamic system must contain sensors and equipment for data acquisition; algorithms for signal processing and processing; damage modeling; algorithms for damage determination; and mechanisms for data storage. The experiment consists of: Bravox PM5 - 90W speaker; BK Precision 4052 – 5MHz function generator; LA4000-LEACS amplifier; MPU6050 vibration sensor; 5V audio sensor; stainless steel rod for sound pressure capture; acrylic tube; acrylic cap  ;
;  wires and connecting cables. In the overview, the experiment is based on an acrylic tube connected with a speaker and, at the opposite end, a seal cap is positioned. The speaker is connected to an amplifier and the same to a function generator, which emits sine wave frequencies to the speaker, resulting in cone movement, and finally, a sound pressure wave internally to the tube. Figure 3 shows the schematic drawing of the mounted experiment.
Figure 3. Schematic Design of the Experiment
The methodology of the database formation process was divided into two stages: the first is considered the characterization of the experiment, which uses the limits of the experiment, being the wavelength and the cutting frequency. The calculation of the wavelength  , and the cutting frequency
 are applied based on the diameter of the tube and its length, where
  is the speed of sound in the air;
  is the frequency of work; and
  it is the diameter of the tube (ISO10534-1, 1996).
Digital signal analysis and processing
In general, in this session, it will be seen that the analysis and digital processing of the different signals demonstrate results of the conditions of prognosis and detection of failures. The digital signal processing of the database is done first by the Wiener filter, which determines a filtered signal from the actual system conditions, this being a pattern without damage or failures of the database, after, the database is analyzed by the algorithm based on the artificial immune system of negative selection that separates and classifies the signals into damage and failures. Figure 4 shows the flow of the procedure developed in the censoring phase, and Figure 5 shows the monitoring phase.
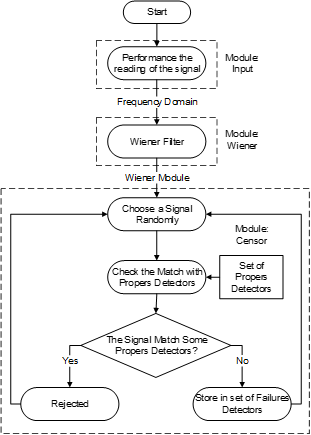
Figure 4. Censoring Phase applied to Wiener filter
The system representing the pressure flow was excited by the sound source at the working frequency (62.5Hz, 350Hz, 500Hz, 1000Hz and 2000Hz), and the vibration of the system was captured by the MPU6050 vibration sensor. Thus, 10 signals with 2060 samples were formed for each work frequency. These 10 signals of each frequency were distributed in two databases, one without failures (good signal) and the other with failures (bad signal). Table 1 shows the relationship of the databases.

The characteristic of the vibration signal without failure, or good signal, can be defined when the system works in its normal condition, that is, the reflection of the pressure of the incident sound wave, internally to the tube, is made in its entirety in the metallic part, in which the pressure of the sound wave recidivism
  , returns the constant emission source, forming the concept of wave parking. The characteristic of the faulty vibration signal, or bad signal, has the same principle of the sound pressure wave that forms the stationary wave, but in the metal cover, a central hole was inserted to condition an escape from the pressure of the incident sound wave of the system. Figure 6 shows the sound source mounted with the tube, and Figure 5 shows the detailing of the cover with the center hole.
Note that Figures 6, 7 and 8 are part of the experiment, which simulates the behavior of a pressure tube, considering the internal pressure of the fluid.
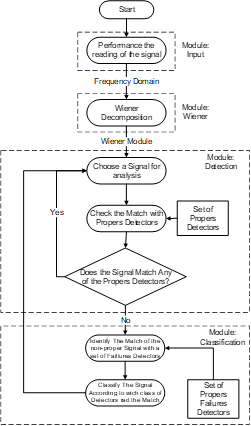
Figure 5. Monitoring Phase applied to Wiener filter
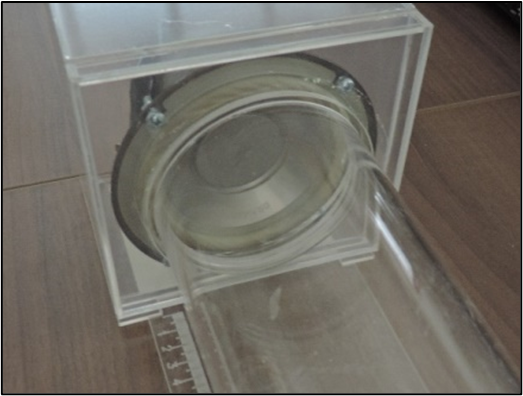
Figure 6. Sound Pressure Wave Issuing Source
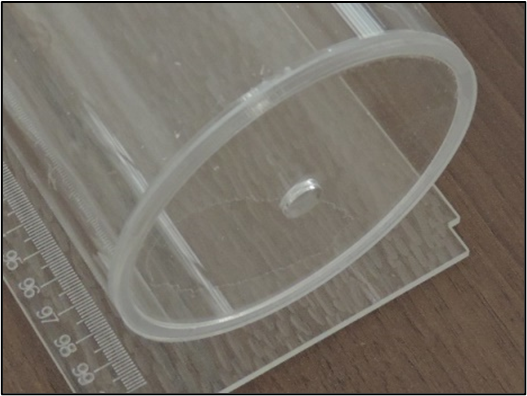
Figure 7. Detailing the Hole Cover
Figure 8 shows the detail of the MPU6050 vibration sensor positioned at the measurement between 320 mm and 350 mm of the sound emission source.
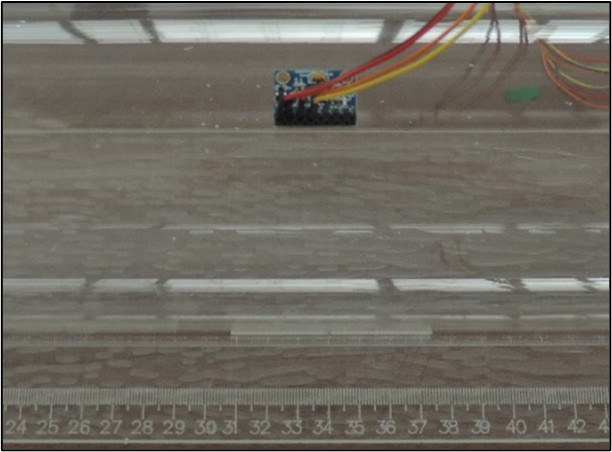
Figure 8. Positioning the Vibration Sensor MPU6050
The result of signal analysis using the Wiener filter of each working frequency, 62.5Hz, 350Hz. 500Hz, 1000Hz and 2000Hz, can be seen respectively in Figures 9, 10, 11, 12 and 13.
Note that for each frequency, the blue signal represents the signal without fail, and the red signal represents the failed signal. The Wiener filter was applied in each data bank, represented by the average of each signal, and thus, it was possible to demonstrate the characteristics of each database, being it flawless and faulty.
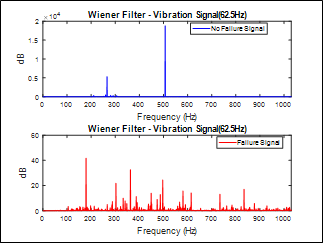
Figure 9. Wiener Filter Applied to Vibration Signal (62.5Hz)
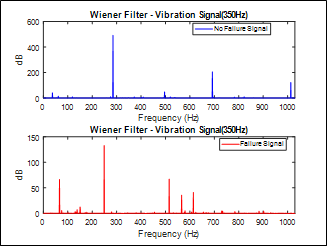
Figure 10. Wiener Filter Applied to Vibration Signal (350Hz)
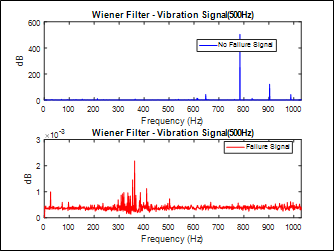
Figure 11. Wiener Filter Applied to Vibration Signal (500Hz)
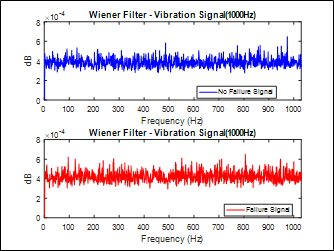
Figure 12. Wiener Filter Applied to Vibration Signal (1000Hz)
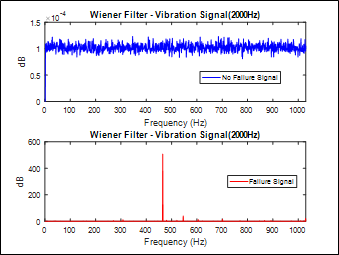
Figure 13. Wiener Filter Applied to Vibration Signal (2000Hz)
Generally speaking, flawless signals are different from faulty signals from all databases. This demonstrates that for each excitation frequency in the pressure vessel, the system responds differently and randomly. This requires further analysis of system conditions with a more robust algorithm, better processing the signal and classifying the types of failures.
Analysis d and signal failures using statistical methods
The different statistical methods have been applied in the analysis of signals to demonstrate the behavior of failures of dynamic systems. The groups of signals without flaws and failures, resulting from the Wiener filter and excited by the different frequencies (62.5Hz, 350Hz, 500Hz, 1000Hz and 2000Hz), were analyzed using the statistical methods Gaussian, Exponential and Weibull.
In Figures 14, 15, 16, 17 and 18, respectively for the frequencies of 62.5Hz, 350Hz, 500Hz, 1000Hz and 2000Hz, the results of the application of static methods are distributed as follows: the upper graph represents the result of the normal or Gaussian distribution function, the middle graph represents the result of the exponential distribution function, and the lower graph is the result of the Weibull distribution.
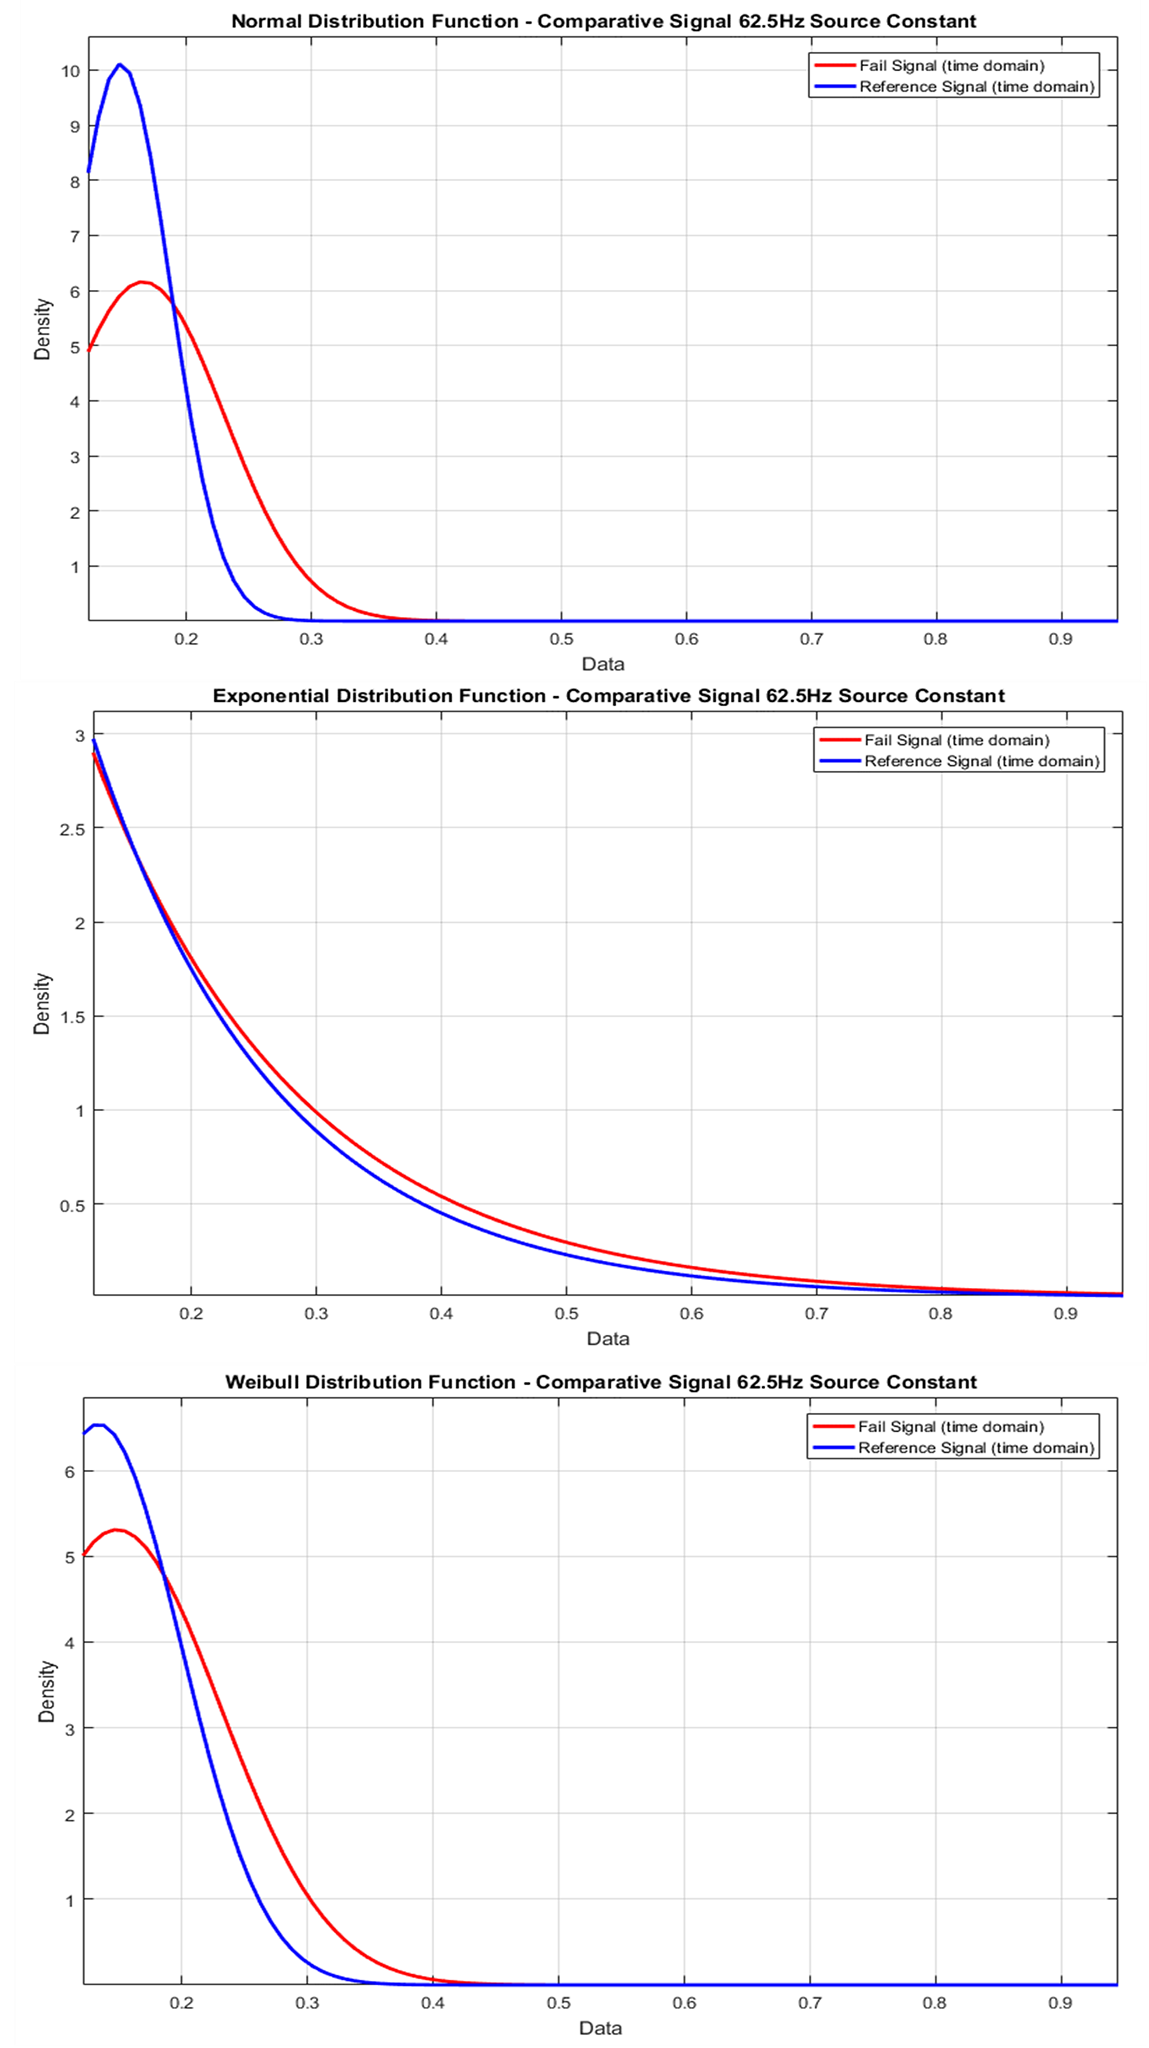
Figure 14. Failure Statistics 62.5Hz.
Figure 14 shows the qualitative and quantitative analysis of signals without failure and with failures of the dynamic system, excited at 62.5Hz.
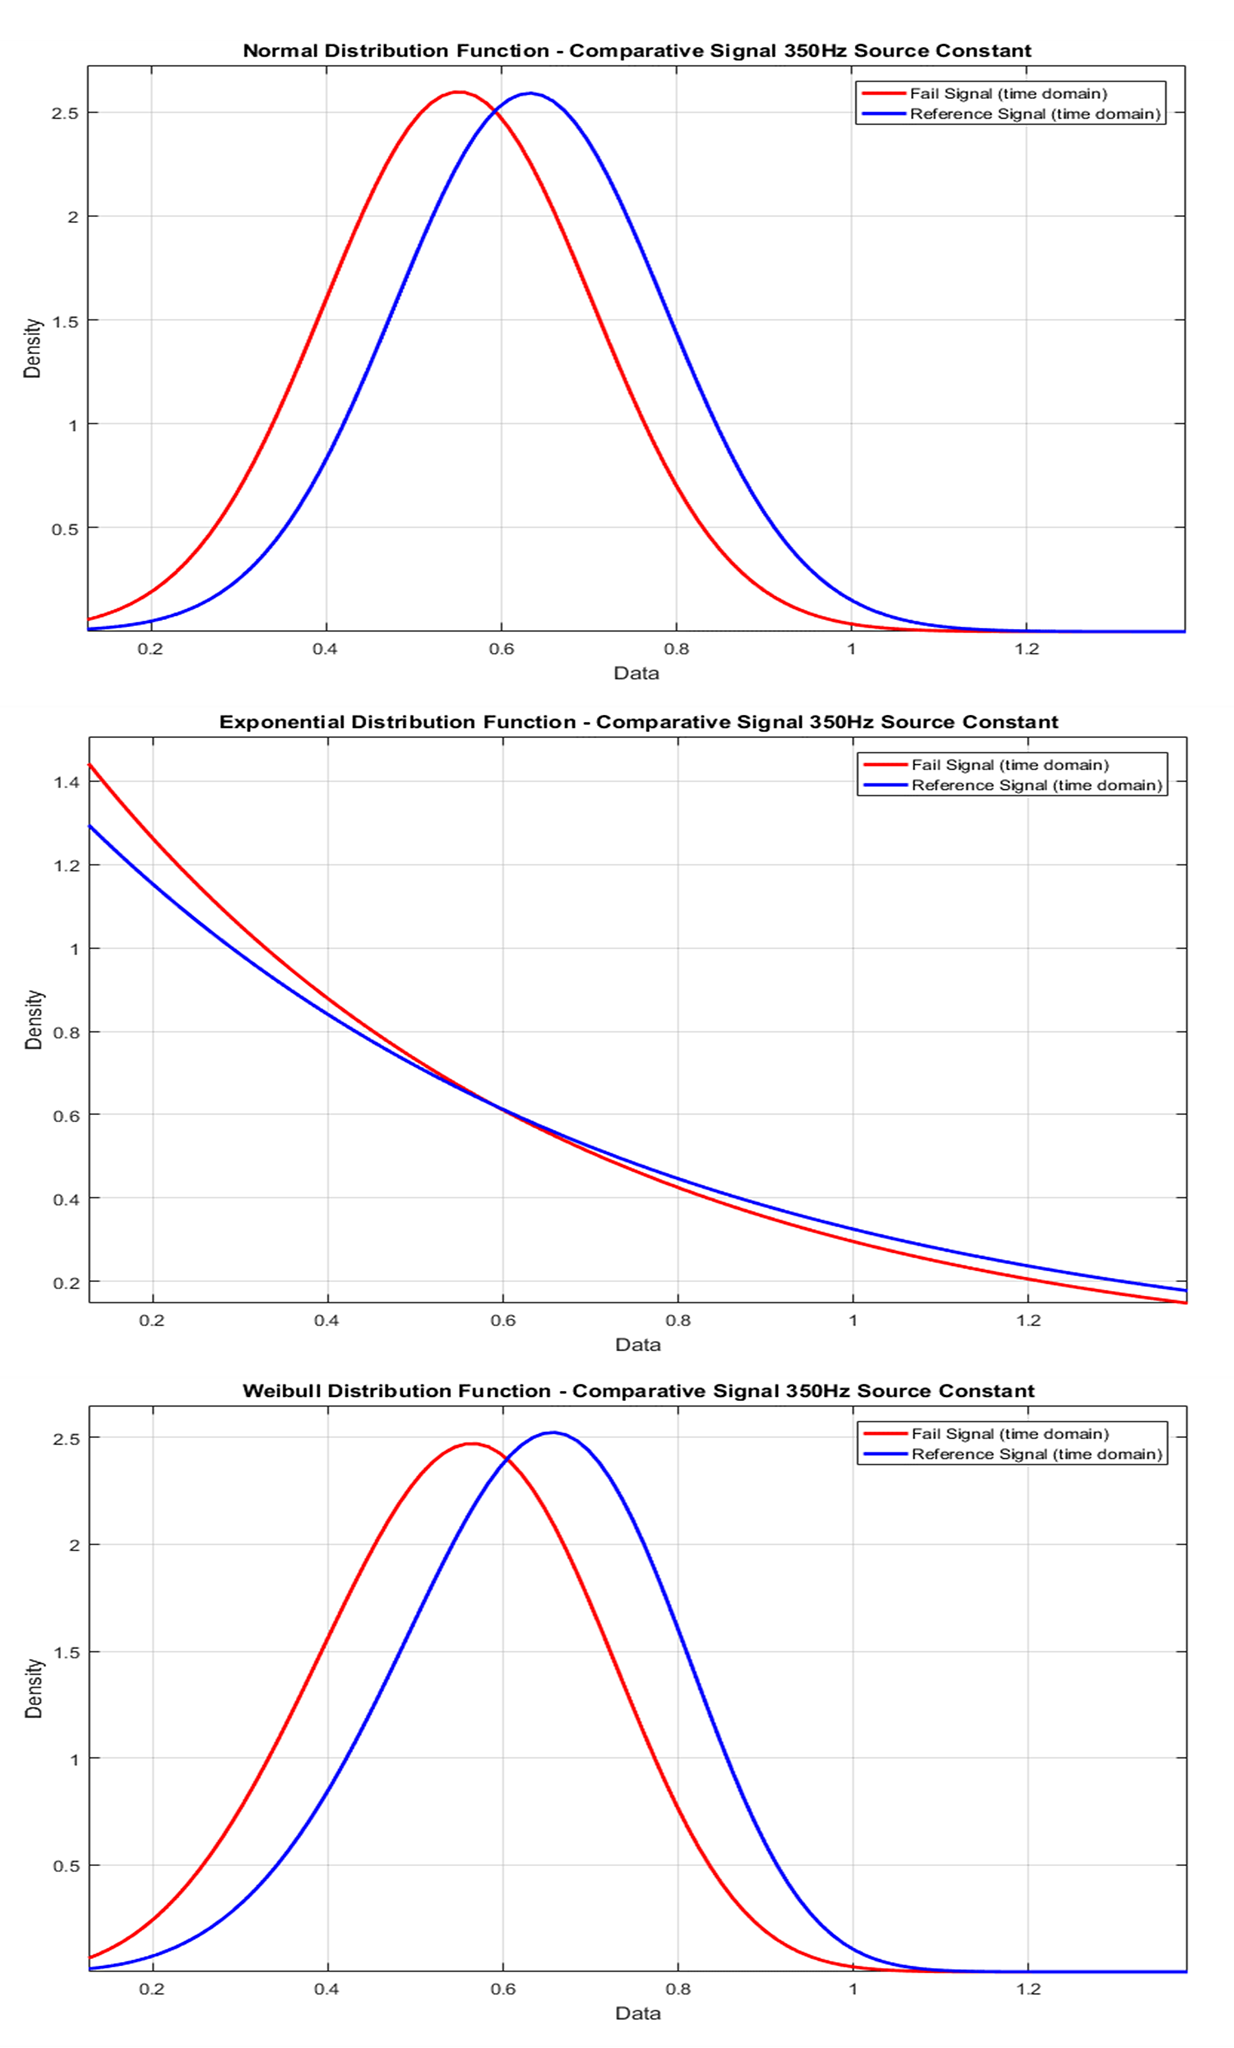
Figure 15. 350Hz Fault Statistics.
In general, the result of the application of the statistical method of signals without failure and with a failure of 62.5Hz, has a difference of signals, seen in the accentuation of each statistical method. In the first (superior) graph of the normal or Gaussian distribution function, it demonstrates the difference in the quality of each signal, resulting in an easy interpretation. In the second graph (medium), of the Exponential density function, the signal quality is difficult to interpret, because the signals have a similar behavior. In the third (bottom) graph, the Weibull density function demonstrates the difference of each signal, resulting in easy interpretation.
For the analysis of the frequency of 62.5 Hz and 350Hz, the function of normal density or Gaussian and Weibull, can be considered the best qualitative choice, because they demonstrate visibility between the amplitude and accentuate of each signal. Figure 15 shows the result to 350Hz.
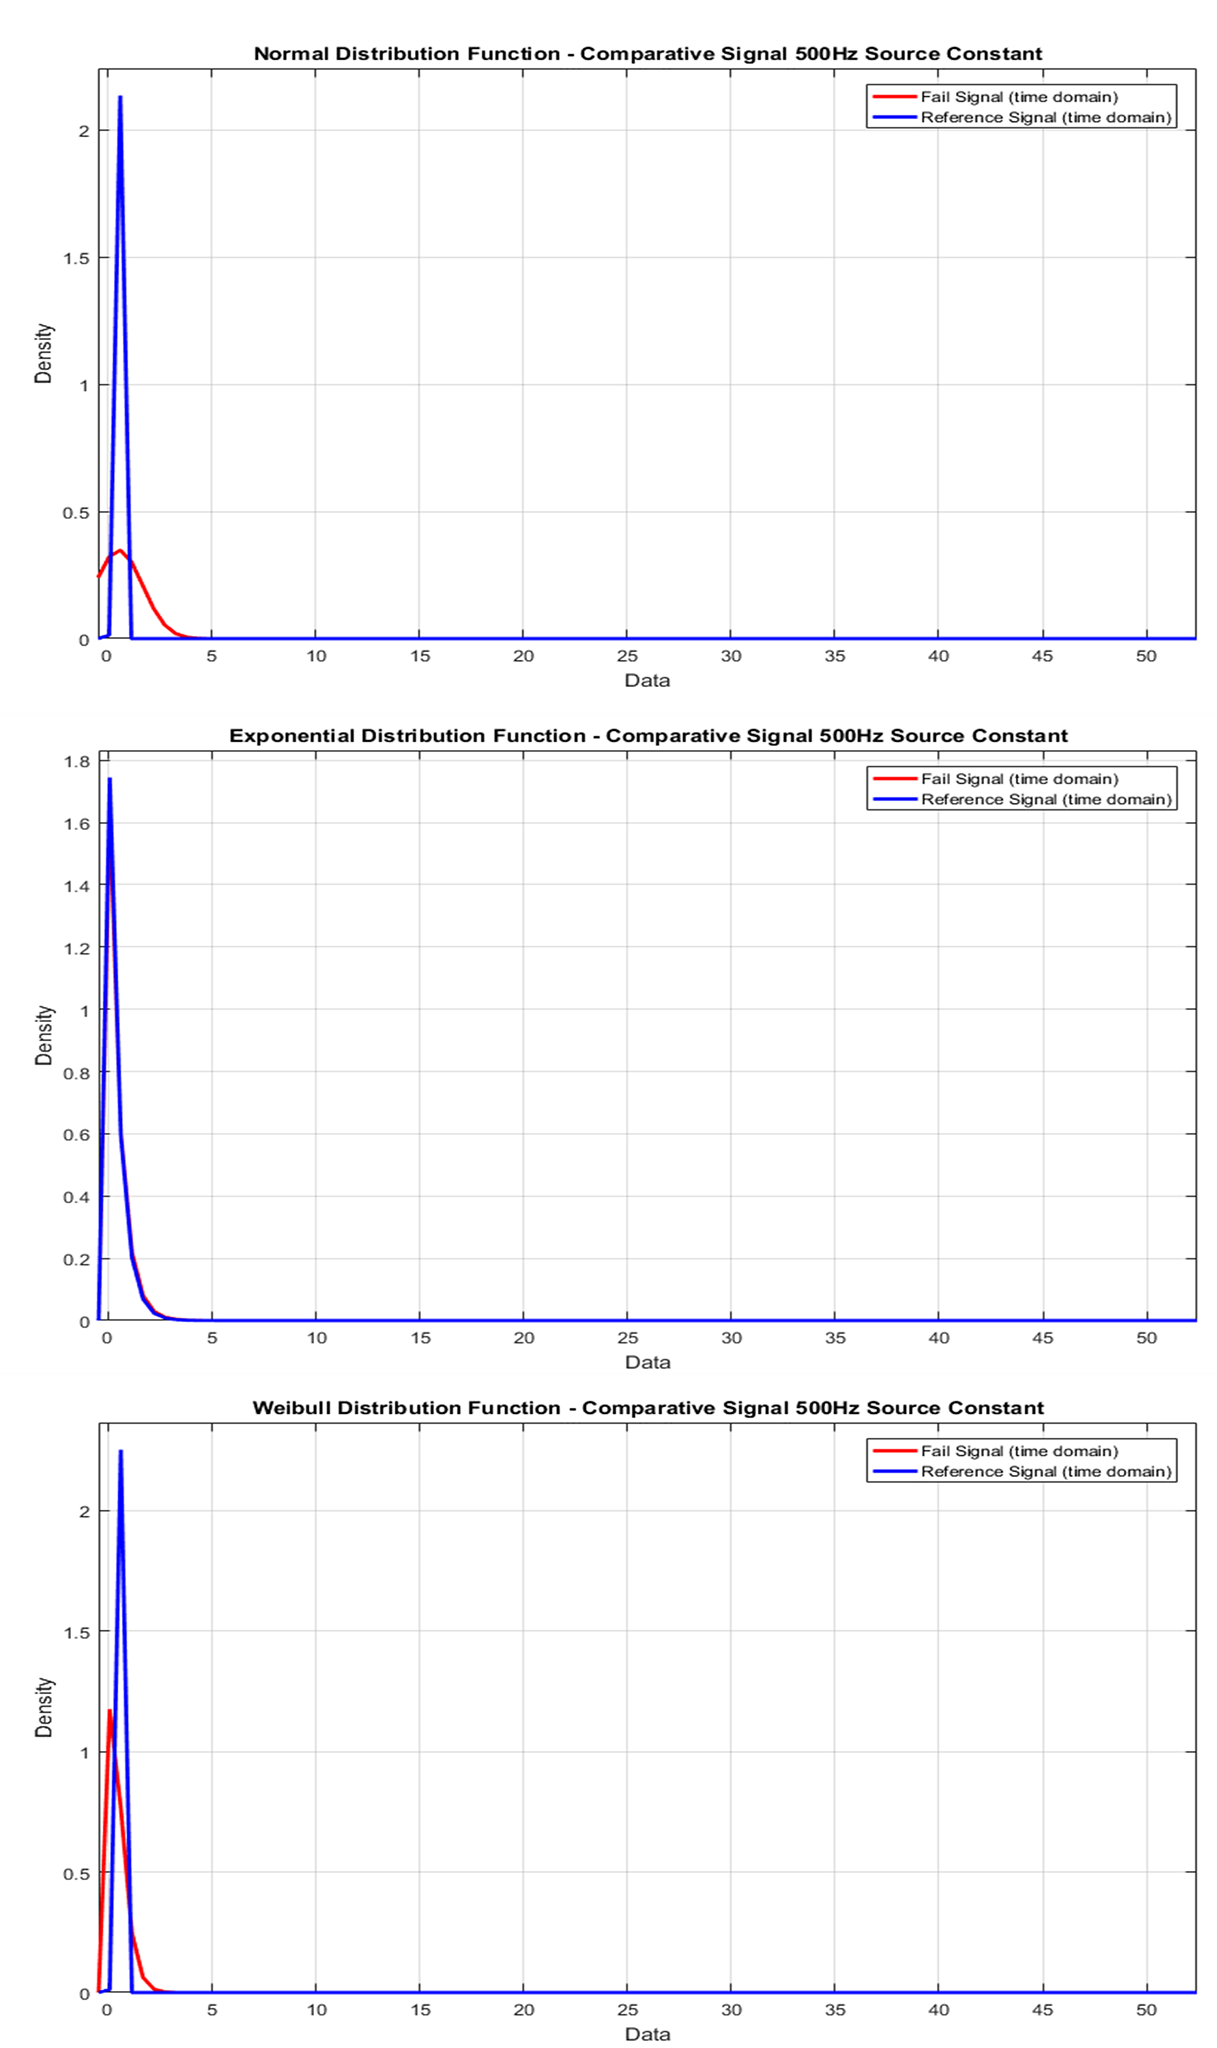
Figure 16. Failure Statistics 500Hz.
In general, the result of the application of the methods of the standard density function normal or Gaussian and Weibull, upper and lower graph respectively, has similar behavior, differentiated by the location of the mean. The exponential density function graph is difficult to interpret, as it corresponds in shape and accentuation.
The result of applying static methods to 500Hz signals, in general, should be carefully analyzed for each method. The best condition of analysis is found by the Weibull density function, whose curves demonstrate a better-quality analysis with differences in amplitude and accentuation between the signals without failure and with failure. The other two functions of Normal or Gaussian and Exponential density have behaviors of difficult analysis.
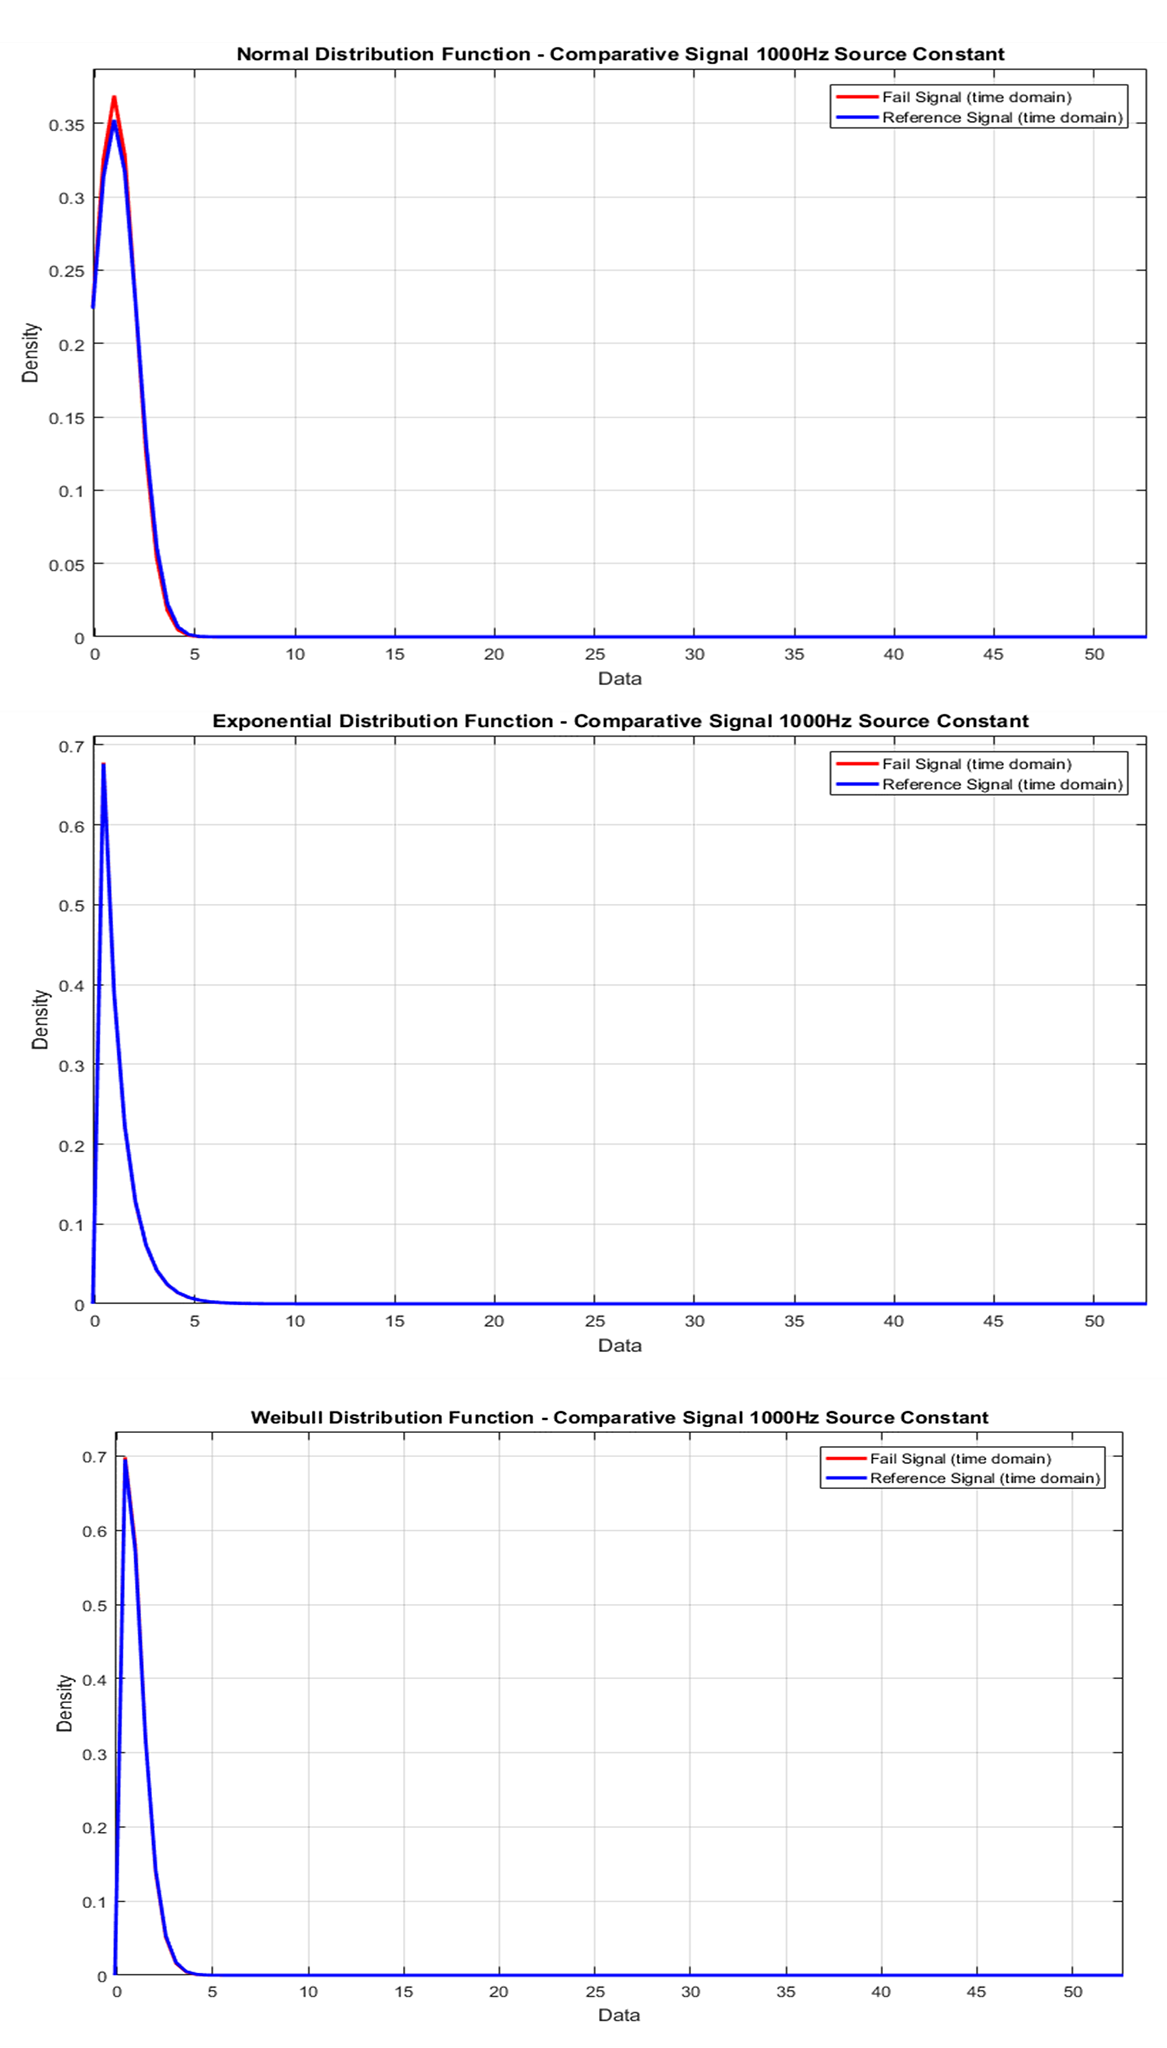
Figure 17. Failure Statistics 1000Hz.
The result of the statistical method of the Normal or Gaussian, Exponential and Weibull density function is difficult to interpret for signals without failure and with frequency failure of 1000Hz, because it has proximity in amplitude and accentuation.
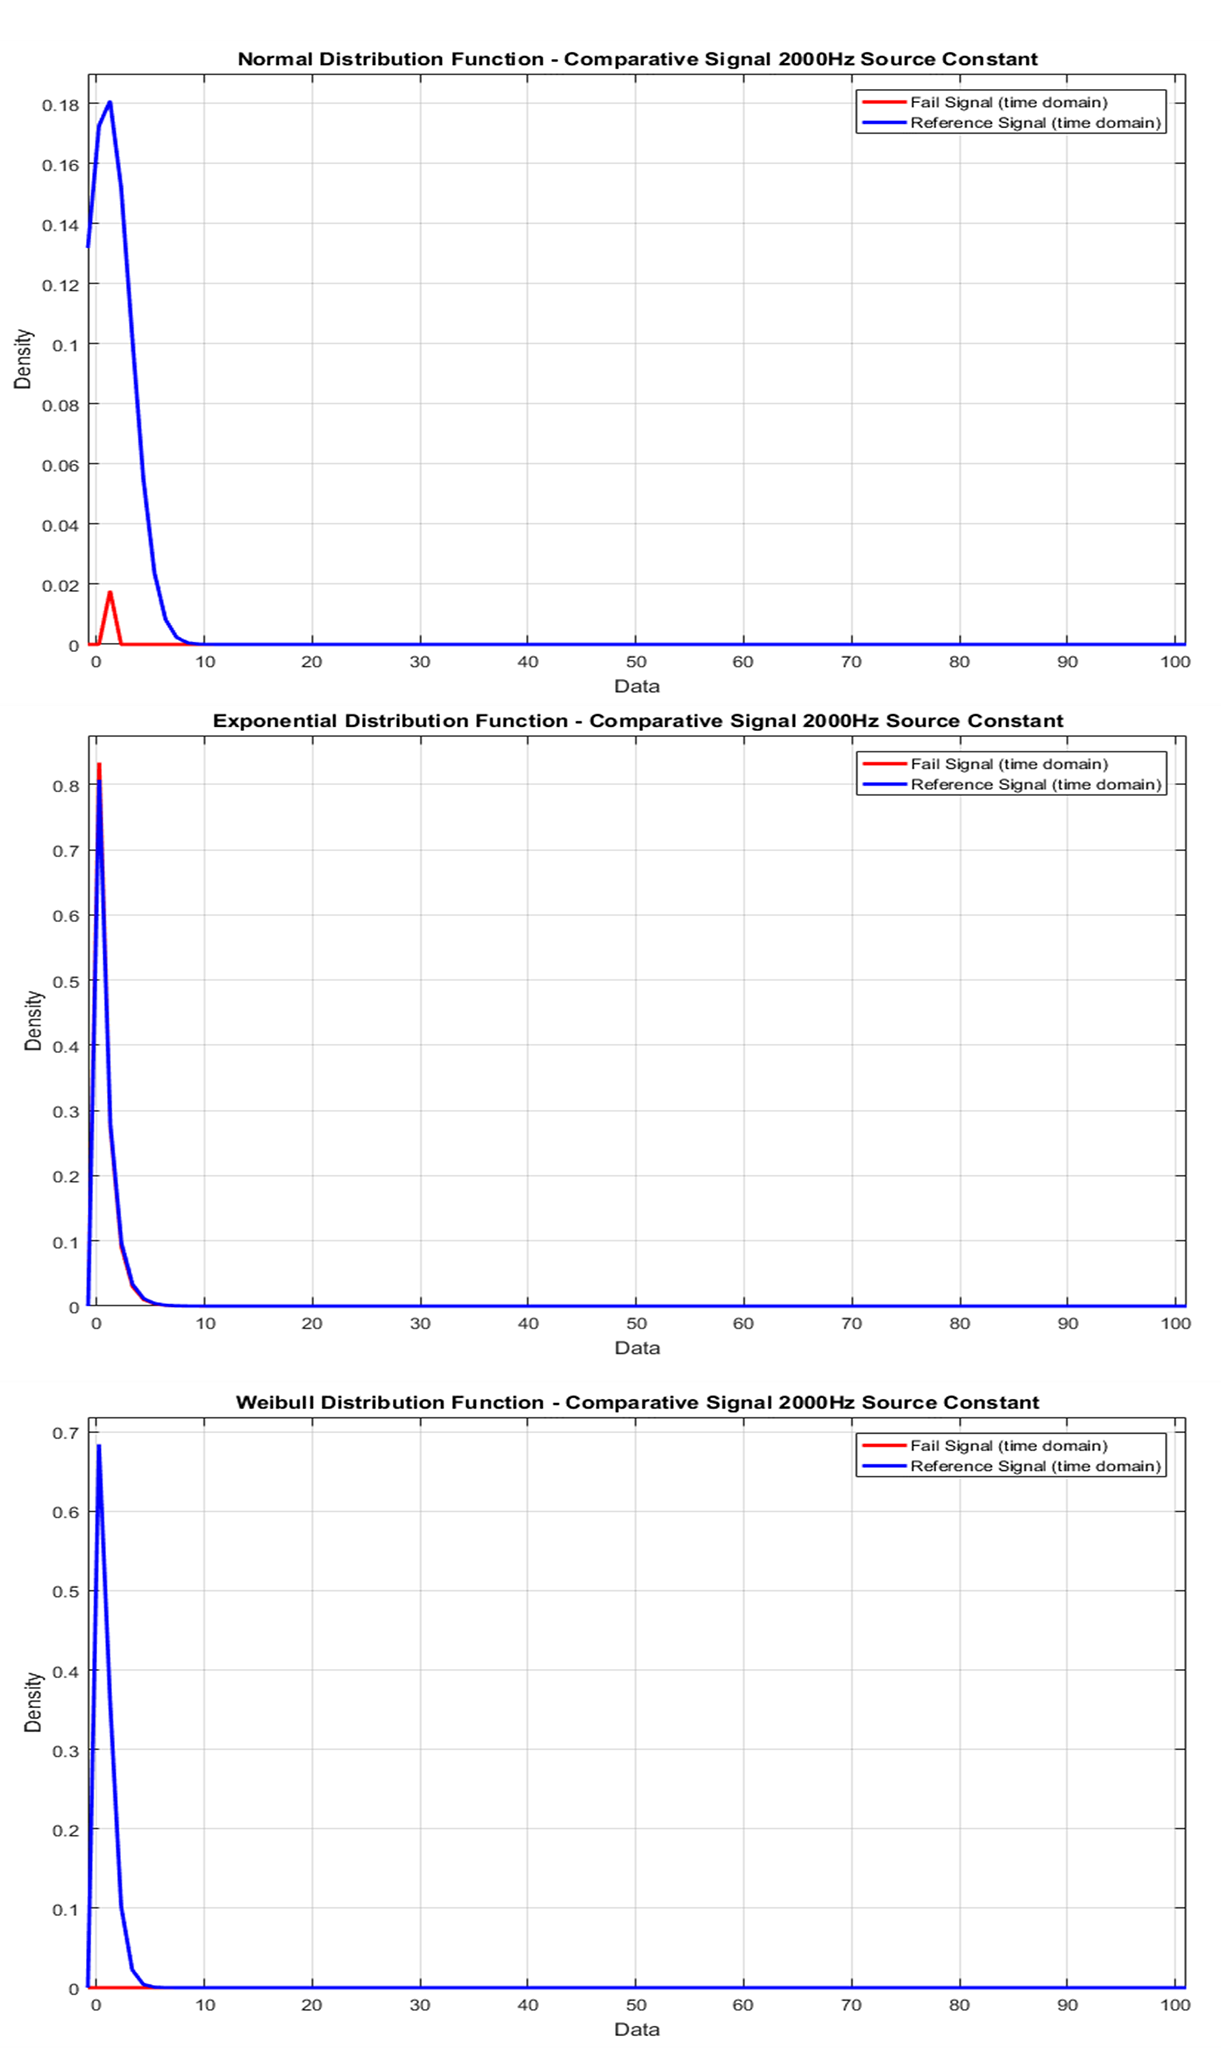
Figure 18. Failure Statistics 2000Hz
The result of the statistical method of the Normal or Gaussian, Exponential and Weibull density function for the signals without failure and with failure of the frequency of 2000Hz, is difficult to interpret. In this case it is difficult to even comment on the quality of the signals.
Artificial immune system: negative selection
For the application of the negative selection algorithm, each data bank of each working frequency of the vibration signal consists of 10 signals, 5 flawless signals and 5 failed signals, each of which was processed by the Wiener filter. Thus, the algorithm uses each vibration signal of the Wiener filter, using the concept of monitoring, censoring and the matching condition, to obtain the classification of failures. The result of the application of the negative selection AIS can be shown in Figures 19, 20, 21, 22 and 23, respectively for each work frequency.
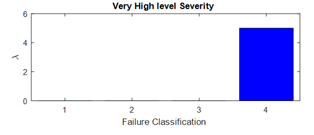
Figure 19. Negative Selection AIS Result (62.5Hz).
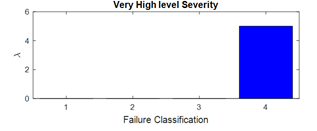
Figure 20. Negative Selection AIS Result (350Hz).
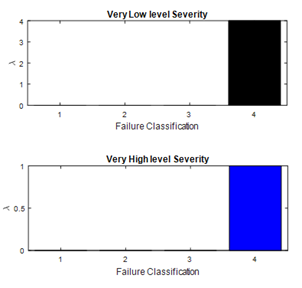
Figure 21. Negative Selection AIS Result (500Hz)
The process of analysis of the negative selection algorithm acts by analyzing the database of each frequency, and in the censoring phase the standard and fault detectors are created, for later classification of the detectors themselves and not their own. In the monitoring phase, the matching condition is used, considering the affinity rate, which cannot be less than 70%.
The result found was 100% of analyzed and related signals,  and, as plotted, for the frequency of:
· 62.5Hz, the 5 failed signals demonstrate that the probability of failure is too high of high severity level;
· 350Hz, the 5 failed signals demonstrate that the probability of failure is too high of high severity level;
· 500Hz, 4 failed signals have very high probability of failure of very low severity level; and 1 failed signal has a very high probability of failure from high severity level;
· 1000Hz, 4 failed signals have very high probability of failure of very low severity level; and 1 failed signal has a very high probability of failure from high severity level;
· 2000Hz, the 5 failed signals demonstrate that the probability of failure is too high of high severity level;
Note that for 62.5Hz, 350Hz, and 2000Hz excitation frequencies, the system's response tends to have better representation in signal classification and grouping. For the frequencies of 500Hz and 1000Hz, the system response is not of very good quality, whose characteristics demonstrate that a new analysis is necessary. Given the observations, this experiment demonstrates that the best responses are found in the frequencies of 62.5Hz, 350Hz and 2000Hz.
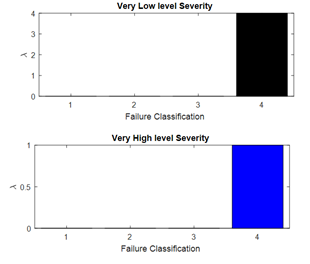
Figure 22. Negative Selection AIS Result (1000Hz)
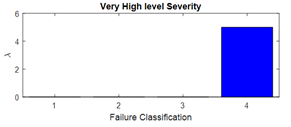
Figure 23. Negative Selection AIS Result (2000Hz)
Result and discussion
The development of this work was carried out as follows:
A. Formation of the experiment that comprises the behavior of a tube that conducts a continuous flow of gaseous medium;
B. Formation of the database of signals without failures and failures of the frequencies of 62.5Hz, 350Hz, 500Hz, 1000Hz and 2000Hz.
C. Wiener filter application on signal without failure and failed to identify FRF without noise;
D. Application of statistical methods in the signals without failure and with Wiener filter failure - Normal or Gaussian density function; Exponential density function; Weibull density function;
E. Application of the artificial immune system theory of negative selection in the non-fault and faulty Wiener filter signals (Wiener method - AIS)
F. Result of the classification of signals without failure and failed by the AIS, determining the prognosis and types of failures.
The formation of the database was planned so that, given the different excitation frequencies of the system (62.5 Hz, 350Hz, 500Hz, 1000Hz and 2000Hz), the way of vibrating this for each frequency reacts in a certain way. In this case the system can be studied under different conditions, providing a greater amplitude analysis of qualitative and quantitative results.
The Wiener filter was applied to the signal without fail and with failures of the different frequencies of 62.5 Hz, 350Hz, 500Hz, 1000Hz and 2000Hz, resulting in an application signal that does not contain unwanted noise, that is, the analysis signal is a clean and uncorrupted signal. This process is essential to improve the accuracy of methods used in signal analysis.
The application of statistical methods in continuous signals without failures and with failures demonstrated that, for each type of excitation frequency of the system, it demonstrates that a different type of statistical technique should be employed, the normal or gaussian density function, or the exponential density function, or the Weibull density function. In this case, experimental statistical theory uses the generalized method to demonstrate the behavior of a system, and when the normal density function or Gaussian is applied, it is expected that the result is associated with the proximity condition between the curves of a physical measure. In the exponential density function it is possible to determine the rate of constant failures considering the characteristics of the sample. Finally, the Weibull density function is applied to demonstrate the failure time of a given component.
In the algorithm application of the negative selection algorithm, it was possible to analyze that all signals, without flaws and failures, have a distinct and exclusive approach, and can be applied in a group of signals of minimum sample size. The negative selection algorithm technique allows signals to be analyzed element by element, resulting in the distribution and classification of the signal condition. The result of this application demonstrates that the signals have characteristics that can be applied in the prognosis and fault detection more easily when compared to the statistical method of Gaussian, exponential and Weibull density functions.
Conclusion
The FRF analysis methods allow the association of failures in pressure vessels, thus detected and classified according to the characteristics of probability and degree of severity of the failure. This classification allows the security systems to be activated, preventing industrial collapses.
The negative selection AIS technique analyzes samples of frequencies with a high degree of difficulty, separating and qualifying the data-Wiener effectively. The result is an effective matching degree.
This work demonstrates an excellent result for the Wiener-AIS techniques, as they are functional and corresponding, resulting in the prognosis and classification of failures.
Acknowledgements
The authors would like to thank the Paula Souza Center (CPS) and CPRJI for their support and encouragement of research at FATEC's. The authors would like to thank the Complex Systems Laboratory (SISPLEXOS) where the project was developed, the São Paulo Research Foundation (FAPESP Proc. 2019 / 10515-4) and the National Council for Scientific and Technological Development (Proc. No. 312972 / 2019-9) for financial support.
References
ASTM International. (2019). Standard Guide for Application of Acoustic Emission for Structural Health Monitoring - ASTM E2983-14. West Conshohocken, PA: ASTM International.
ASTM International. (2020). Standard Practice for Examination of Seamless, Gas-Filled, Pressure Vessels Using Acoustic Emission - ASTM E1419/E1419M-15a. West Conshohocken, PA: ASTM International.
Bickell, M. B., & Ruiz, C. (1967). Pressure vessel design and analysis. New York, NY: St. Martin's Press.
Blanco, J. G., & Dederichs, T. (2018). Lean maintenance: a practical, step-by-step guide for increasing efficiency. Boca Raton, FL: CRC Press.
Bradley, D. W., & Tyrrell, A. M. (2002). Immunotronics - novel finite-state-machine architectures with built-in self-test using self-nonself differentiation. IEEE Transactions on Evolutionary Computation, 6(3), 227-238.
Chattopadhyay, S. (2009). Pressure vessels: design and practice. Boca Raton, FL: Taylor & Francis.
Chen, H.-P. (2018). Structural health monitoring of large civil engineering structures. Hoboken, NJ: John Wiley & Sons.
Chilengue, Z., Dente, J. A., & Branco, P. J. C. (2011). An artificial immune system approach for fault detection in the stator and rotor circuits of induction machines. Electric Power Systems Research, 81(1), 158-169. DOI: http://doi.org/10.1016/j.epsr.2010.08.003
Daniele, V. G., & Zich, R. S. (2014). The Wiener-Hopf method in electromagnetics. Edison, NJ: SciTech Publishing.
Dasgupta, D., & Niño, L. F. (2009). Immunological computation: theory and applications. Boca Raton, FL: Taylor & Francis Group.
Deraemaeker, A., & Worden, K. (2010). New trends in vibration based structural health monitoring. New York, NY: Springer Wien.
Escoe, K. (2008). Pressure vessel and stacks: field repair manual. Burlington, NJ: Elsevier.
Farrar, C. R., Worden, K. (2013). Structural health monitoring: a machine learning perspective. Chichester, UK: John Wiley.
Galar, D., & Kumar, U. (2017). eMaintenance: essential electronic tools for efficiency. San Diego, CA: Academic Press.
Gill, S. S. (1970). The stress analysis of pressure vessels and pressure vessel componentes. Oxford, UK: Pergamon Press.
González, F. A., Dasgupta, D., & Niño, L. F. (2003). A randomized real-valued negative selection algorithm. In J. Timmis, P. J. Bentley & E. Hart (Eds.), Artificial Immune Systems. ICARIS 2003. Lecture Notes in Computer Science (Vol. 2787, p. 261-272). DOI: http://doi.org/10.1007/978-3-540-45192-1_25
Gopalakrishnan, S., Ruzzene, M., & Hanagud, S. (2011). Computational techniques for structural health monitoring. London, UK: Springer Verlag.
James, F. (2006). Statistical methods in experimental physics (2nd ed.). Singapore, SI: World Scientific Publishing.
Kailath, T. (1981). Lectures on Wiener and Kalman filtering. Wien, AU: Springer Verlag.
Kuo, H.-L. (1980). A more generalized wiener filtering technique. IFAC 5, System Approach for Development, 539-542. DOI: http://doi.org/10.1016/S1474-6670(17)64478-1
Levitt, J. (2018). Lean maintenance. New York, NY: Industrial Press.
Lima, F. P. A., Chavarette, F. R., Souza, S. S. F., & Lopes, M. L. M. (2017). Monitoring and fault identification in aeronautical structures using an wavelet-artificial immune system algorithm. In S. E. Osire, A. C. Gonçalves & F. M. Alemayehu (Eds.), Probabilistic prognostics and health management of energy systems (12ed., p. 203-219). São Paulo, SP: Springer International Publishing. DOI: http://doi.org/10.1007/978-3-319-55852-3_13
Moro, T. C., Chavarette, F. R., Roéfero, L. G. P., & Outa, R. (2019). Detecção de falhas estruturais de um prédio de dois andares utilizando sistema imunológico artificial. Unoeste - Colloquium Exactarum, 11(4), 73-84. DOI: http://doi.org/10.5747/ce.2020.v12.n2.e316
Moss, D. R., & Basic, M. M. (2013). Pressure vessel design manual (4th ed.). Oxford, UK: Elsevier.
Oliveira, D. C. d., Chavarette, F. R., & Outa, R. (2020). Structural health monitoring of a rotor using continuous learning artificial immune systems algorithms. Research, Society and Development, 9(7), e96973546. DOI: http://doi.org/10.33448/rsd-v9i7.3546.
Oliveira, D. C., Chavarette, F. R., & Lopes, M. L. M. (2019). Damage diagnosis in an isotropic structure using an artificial immune system algorithm. Journal of the Brazilian Society of Mechanical Sciences and Engineering, 41(1), 485-492. DOI: http://doi.org/10.1007/s40430-019-1971-9
Outa, R., Chavarette, F. R., Mishra, V. N., Gonçalves, A. C., Roefero, L. G. P., & Moro, T. C. (2020). Prognosis and fail detection in a dynamic rotor using artificial immunological system. Engineering Computations, 37(9). DOI: http://doi.org10.1108/EC-08-2019-0351
Poularikas, A. D., & Ramadan, Z. M. (2006). Adaptive filtering primer with Matlab. Boca Raton, FL: CRC Press.
Shingo, S. (1981). A study of the Toyota production system: from an industrial engineering viewpont. Tokyo, JP: Productivity Press.
Smith, P. R., & Laan, T. J. V. (1987). Piping and pipe support systems: design and engineering. New York, NY: McGraw-Hill.
Wolstenholme, L. C. (1999). Reliability modelling: a statistical approach. Boca Raton, FL: Chapman & Hall/CRC.
Yan, J. (2015). Machinery prognostics and prognosis oriented maintenance management. Singapore, SI: John Wiley & Sons.