Biotecnologia
Recepción: 24 Octubre 2020
Aprobación: 11 Noviembre 2020
DOI: https://doi.org/10.4025/actascitechnol.v43i1.56373
Abstract: Blood glucose is conventionally determined by the level of sugar present in our blood. Lesser known to the public that antioxidants in our body are also said to influence the level of blood glucose. Glutathione (GSH) as the main antioxidant parameter in our body helps in reducing the production of oxidative stress caused by a high blood glucose level. Particularly in women, high antioxidant activities are reported due to the presence of oestrogen hormone. However, in Malaysia limited study was done on the significance of GSH in influencing the blood glucose level. Thus, this study focuses on finding the significance of GSH and some other health predictors in affecting the blood glucose level of women volunteers. This study was carried out on 118 Malaysian women volunteers and blood samples were collected for GSH analysis and blood glucose. All data were trained and tested for the development of prediction models in classifying the blood glucose into normal and abnormal levels. The model construction is using three different classifiers: namely logistic regression, k-nearest neighbour classifier and decision tree. Five predictors that were used are GSH, weight, body mass index (BMI), waist-hip ratio (WHR) and groups (oral supplementation dosage). Results showed all predictors are significantly correlated with the blood glucose level at p < 0.10. The model with a combination of GSH, BMI, WHR, weight and supplementation dosage (groups) as predictors gave the best performance. The k-nearest neighbour classifier model displays the best accuracy (84.7%) in predicting the normal and abnormal level of blood glucose. This finding shows that by altering the amount of GSH via oral supplementation and other significant predictors in women, there are chances to modify the blood glucose level from abnormal to normal.
Keywords: Glutathione, blood glucose, prediction.
Introduction
Having high blood sugar or glucose level pinpoint as one of the silent killers in the Malaysian population. A report by Ministry of Health (MOH) Malaysia, according to the National Health and Morbidity Survey [NHMS] (2020), the widespread rate of diabetes in adults has increased in Malaysia from 13.4% in 2015 to 18.3% in 2019, with diabetes defined as having sugar levels 7.0 µmol L-1 or above. The survey also found that 49 per cent of people with diabetes had never been examined or diagnosed with the chronic disease (CodeBlue, 2020).
Relatively unknown, antioxidants or glutathione (GSH) in our body is important to inactivate reactive oxygen species (ROS) which cause many chronic diseases such diabetes. Glutathione (GSH) exerts antioxidant function to neutralise free radicals from harming the cellular system (Kern et al., 2011; Ali, Ahsan, Zia, Siddiqui, & Khan 2020). Excess glucose in blood causes enhancement of free radicals production by increasing the oxidant status and decreasing the antioxidant capacity exerted by glutathione mechanism in the body (Avelar et al., 2015, Ceriello & Motz, 2004).
Women reportedly have higher antioxidants activities compared to men. This is supported by the fact that women have higher glutathione levels as compared to men, due to oestrogens hormones that help to regulate antioxidant activities (Steyn, Zitouni, Kelly, Cook, & Earle, 2019). This suggested that GSH having potency to be one of the parameters in diagnosing blood glucose level. However there are limited studies on predicting the blood glucose level based on GSH, and the results were hardly significant. On the other hand, previous studies were mostly done outside Malaysia with data samples from Caucasian volunteers.
Besides, complex interaction of physiological data, such relation between GSH and blood glucose level, is the challenge that should be tackled in this study. Evaluating a regression model by estimating which variables are relevant for the condition is one of the ways to provide a clear insight of an unknown or complex underlying physiology (Antoniewicz, Stephanopoulos, & Kelleher, 2006; Liebal, Phan, Sudhakar, Raman, & Blank, 2020). Prediction models will be constructed through non-linear modelling technique with several predictor variables and one dependent variable that is called as response (Bernadó-Mansilla & Garrell-Guiu, 2003). This study is comparing several classification techniques through different classifiers to develop the best predicting models that can categorise blood glucose level based on their GSH value.
In this study, the significant relationship of GSH with blood glucose was investigated. Then, the classification of blood glucose level based on several predictors which were GSH, body mass index (BMI), waist to hip ratio (WHR), weight and supplementation dosage was done to construct the best prediction model for the blood glucose level. The model is analysed through three different classifiers. The most suitable classifier is identify based on its accuracy, sensitivity, and specificity.
Material and methods
Subject recruitment
A total of 118 women volunteers from Petaling Jaya, Malaysia were recruited and participated in this study. Volunteers were recruited based on criteria: body mass index (BMI) ≥ 24; aged from 18-65 years old. However, volunteers with chronic illness or pregnant/lactating mothers were excluded. The study protocol was approved by the University of Malaya Research Ethics Committee with reference number: UM.TNC2/RC/H&E/UMREC – 152.
Data collection
The venue for blood sampling was divided into two: University of Malaya Student Health Clinic (UMHC); Majlis Bandaraya Petaling Jaya (MBPJ) Health Clinic, Petaling Jaya. Two types of measurements were performed: anthropometric measurements; blood withdrawal for haematology test (blood glucose) and GSH assay analysis. Participants visited one of the clinics and their blood samples were collected after receiving an informed consent. All participants were briefed about the study and a written consent was obtained from each subject. Participants were reminded to fast at least 8-12 hour prior to the visit.
Anthropometric measurements
The measurement included measuring the participant’s height, weight, body mass index (BMI) and waist hip circumference. BMI was calculated by dividing the weight in kilogram (kg) by height in metres squared  . The procedure was performed before the participants went for blood sampling.
Blood sampling for GSH assay analysis and blood glucose analysis
Blood samples of approximately 8 mL were collected from each participant for GSH assay and blood glucose analysis. Purple TUD blood tube used to collect 3 mL blood samples then was sent to the Clinical Haematology Laboratory in University Malaya Medical Centre (UMMC) for haematology test. Another 5 mL blood sample collected in a red plain blood collection tube with clot activator were centrifuged at 3,000 rpm for about 15 min. to get the plasma serum. GSH analysis and calculation were carried out according to the manufacturer’s recommended protocol (Sigma-Aldrich (M) Pte Ltd, Kuala Lumpur, Malaysia).
Supplementations
Volunteers were randomly categorized into a control group and two intervention groups which underwent the supplementation monthly. Control group consisted of volunteers who normally proceed with their routine lifestyle and came for measurements for the baseline and 12 weeks from the first measurement. The other two intervention groups were scheduled to come for baseline measurement and once after 4 weeks for assessment until finished 12 weeks of the supplementation period. First group of supplementations (Group 1) were assigned to consume 5 g of Immune Formulation 200®, Patent No: RE42645 E supplement (consist of 1.6 g glutathione precursors and vitamin C) while second group (Group 2) with two doses of 5 g supplement daily (consist of 3.2 g glutathione precursors and vitamin C). After 12 weeks, the intervention and control group’s volunteers required blood withdrawal and anthropometric measurement. Figure 1 shows the flow diagram of the recruitment and group’s allocation process following the CONSORT guidelines.
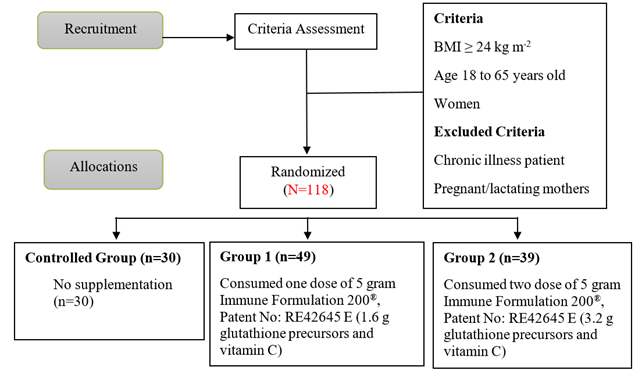
Figure 1. Flow diagram of the recruitment and group’s allocation process following CONSORT guidelines. (Moher, Schulz, Altman, & CONSORT, 2001).
Data analysis
All data samples from 118 women participants were used for training and testing purposes. The blood glucose levels were investigated in this study and the range of levels with the conventional medical reference value are summarised in Table 1. In further classification analysis, the numbers ‘0’ and ‘1’ will represent the normal and abnormal levels of the blood glucose level, respectively.
Table 1. Ranges of selected blood glucose level.

Input predictors and prediction models selection
In this study, GSH value, weight, BMI, WHR and supplementation dosage acted as possible predictors to predict blood glucose level. These predictors were selected by using single logistic regression analysis with p-value ≤ 0.10. The cut-off point of p ≤ 0.10 chosen as significant level in this study to ensure important variables relevant to the glucose level are not leaved out and to avoid omitting less significant parameters that may have relevant reasoning (Chowdhury & Turin, 2020).
Classification technique
By using a classification learner application in MATLAB software Version 2018a (MathWorks Inc., Massachusetts, United States), three different classifiers were used, which were logistic regression, k-nearest neighbour (KNN) and decision tree-based classifiers to exhibit performance of prediction model for blood glucose level based on several predictors; GSH value, weight, BMI, WHR and supplementation dosage.
Logistic regression analysis
As data vector Importar imagen (each x represents each predictor, i=1 to 5), the class probability for the categories in the data set was calculated by using Equation 1 (Hosmer Jr., Lemeshow, & Sturdivant, 2013). Removing excessive variables and leaving only the most relevant as predictors can increase the accuracy of models. The significance of models was tested to find the best model and see whether more predictors produce better results or otherwise.
 [1]
[1]K-nearest neighbour analysis (KNN)
Euclidean distance was measured between test data and training data in this study. The test data was then assigned to the class label with the most K closest training data. The distance between and
and was calculated by using Equation 2(Sarkar & Leong, 2000). This study used no. of neighbours k=1 as attribute for the classifier.
 [2]
[2]Decision tree analysis
The process involves steps of splitting the nodes, determining the terminal nodes and lastly assigning class to the terminal nodes. The class assignment is as simple as based on a weighted vote, assuming certain classes are more likely than others (Pal & Mather, 2001). For decision tree-based analysis, no. of split of 100 was used as classifier attribute in this study with split criterion of Gini’s diversity index.
Cross-validation
In testing of the classifier accuracy, the predictive models were evaluated by partitioning the original sample into a training set to train the model, and a test set to evaluate it. In this data training, 10 folds of cross validation were used to cross validate the training set. 10 data from the training population were set aside for validating or testing the models. The models will be evaluated based on their performance on accuracy, sensitivity and specificity.
Results and discussions
A total of 118 data samples from women participants were observed and analysed after 12 weeks. The means and standard deviation (SD) for anthropometric measurements of the participants are recorded and tabulated in Table 2. Table 2 describes the normal and abnormal data of investigated blood glucose parameter. Data were tabulated based on their investigated variables or predictors.
Table 2. Demographic data samples on blood glucose parameter. Data are mean±SD.

Data are mean ±STD. BMI; body mass index, WHR; waist to hip ratio, GSH; glutathione.
Significant predictive variable selection using logistic regression (SLR) analysis
Selection of predictors were done through single logistic regression analysis where each predictor was correlated with blood glucose condition and reliable p-values were observed to proceed with the investigation. Predictors with p-value of below and equal to 0.10 were proven significant to the blood glucose condition.
From table 3, all predictors demonstrate significant value to the blood glucose. Therefore, this may suggest that these predictors might contribute some effects on the level of blood glucose condition throughout the study. Predictors selected to proceed with model constructions were GSH, weight, BMI, WHR and supplementation groups. Three prediction models were constructed on 118 data samples using logistic regression.
Table 3. P-Values from Single Logistic Regression analysis.

*Significant at p < = 0.10. BMI; body mass index, WHR; waist to hip ratio, GSH; glutathione.
From table 4, model 1 with GSH alone as predictors display significant value of 0.10 and model 3 with full predictors (combination of GSH, WHR, weight, BMI and supplement groups) also display significant p-value of 0.02 in relation to the blood glucose level. However, Model 2 with GSH and supplementation groups as predictors do not show significant correlation to blood glucose level as the p-value recorded at 0.85 which were closer to 1.
Table 4. P-Values of Blood Glucose level Prediction Models.

*Significant at p < = 0.10. BMI; body mass index, WHR; waist to hip ratio, GSH; glutathione.
These results proposed that GSH can stand alone as predictor in predicting the level of blood glucose however with combination with WHR, BMI, weight, GSH and supplement dosage (groups), it can enhance better results of the prediction. Whereas, when GSH and supplement dosage stands alone without other health predictors, their influence on blood glucose levels reduced. From the results, both Model 1 and Model 3 are reliable in predicting the condition, but Model 3 might predict more accurately.
Predictive models’ classification and validations
Models’ construction was proceeded with running the models through three different classification techniques; logistic regression, KNN and decision tree-based classifier. Data samples in these models were used for training and testing purposes. The models then will be evaluated based on their performance on accuracy, sensitivity and specificity. Accuracy in this study is defined as a model's ability in predicting volunteers' blood glucose into normal and abnormal levels correctly, whereas sensitivity displays its ability to predict normal level correctly and specificity to predict abnormal level correctly.
From Table 5, all models showed best performance with k-nearest neighbour classifier. Model 1 produce accuracy of 70%, Model 2 with 76.3% and Model 3 with 84.7%. Although Model 1 performed better in accuracy through logistic and complex tree classifier, however the results of sensitivity and specificity were lower compare with KNN classifier. Comparing the accuracy of all three models, Model 3 exhibited most accuracy with higher sensitivity at 89% and specificity at 54 %. In other hand, Model 1 and 2 performed well on its sensitivity but poorly in specificity. Their specificity recorded at 15 and 24% which indicate Model 1 and Model 2 performed poorly in predicting the abnormal level of the blood glucose.
In selecting predictors, single logistic regression analysis performed to selected variables. From the results, GSH value suggested closely relates to changes in blood glucose level, thus considered one of the possible predictors in constructing prediction models. However, GSH showed best performance as a predictor when it was combined with several other predictors such as BMI. On the other hand, having higher BMI always leads to a risk of suffering from health problems. Main criterion of recruiting volunteers in this study is having BMI more than 24, which represents overweight to obese volunteers. According to the results, Model 3 which consist of BMI as its predictors, shows significant correlation to blood glucose level at p = 0.006. This proves its existence in the model on affecting the blood glucose level. A study on Malaysian population by Termizy and Mafauzy (2009) found that obese patients (BMI>30) raised fasting blood glucose by 17% and reduced HDL to 40%. They also stated that these patients had higher risk of suffering from metabolic syndrome (Termizy & Mafauzy, 2009). Therefore, BMI are the most reliable predictors to include in predicting blood glucose level.
Table 5. Performance of prediction models for blood glucose level. Data are in percentage, %.

KNN; k-nearest neighbour. Highlighted were the best classifier performance of each models constructed.
Weight and waist to hip ratio (WHR) are also often used in assessing the health status of the human body. Having heavier weight and unbalance WHR contributed to increasing risk of having higher blood glucose level. Weight and WHR are also important in determining one’s health besides BMI. However, its power is reduced when it stands alone as a predictor. A company of BMI needs to show better results of the relation with blood glucose condition. As discriminators for blood glucose condition, WHR appeared to be less useful as compared to weight and BMI. A similar finding was shown in a study by Cheong et al. (2015) where BMI and waist circumference were reported to have better discrimination ability on predicting components of metabolic syndrome (Cheong et al., 2015). Therefore, the accompany of BMI and weight with WHR in Model 3 as predictors resulting in the good performance of the model.
A differential in GSH dosage might affect the blood glucose level after the 12th week assessment. From previous studies, they investigated the effects of supplementation of 1000 mg or 1 g or lower. In this study, the dosages investigated were 5 and 10 g of supplementation. Therefore, the results may differ and contribute to changes of significant value in constructing prediction models. However, from the results, GSH and supplementation dosage alone as predictors were shown unreliable in classifying the blood glucose level.
The most popular technique adapted in medical data analysis is logistic regression technique (Udo et al., 1999). The most occurring problem is that there is no relation between x (predictors) and y (response); hence it has to be generally described by probability distribution. Liao and Chin (2007) reported that feature selection function in logistic regression analysis helps to reduce errors in classifying the disease by using genes as predictors (Liao & Chin, 2007). Whereas KNN classifier ranks the data neighbours among the training data, and uses the class labels of k most similarity neighbours to predict the class of the input data (Tan 2006, Wang, Pan, & Pan, 2019). As reported by Sarkar and Leong (2000) KNN technique is simpler and the best to use as compared to other techniques in breast cancer diagnosis problems (Sarkar & Leong, 2000). Another simple and widely used technique in research is the decision tree classification technique. It applies a straightforward idea to solve the classification problem. Previously Gokgoz and Subasi (2015) achieved the best performance on classifying electromyogram signals by using the decision tree algorithm in combination with random forest (Gokgoz & Subasi, 2015). In current study, KNN work best with the prediction models thus proved to be transparent in classifying the blood glucose into normal and abnormal level.
Models constructed were put through different classifiers to assess its ability in classifying normal and abnormal levels of the blood glucose. The data were trained and tested to produce predictive models based on different combinations of predictors. From the model construction results, Model 3 displayed a significant relationship with blood glucose at p = 0.02. Results showed having more predictors in a model helped in increasing the correlation with the conditions. As a full model or Model 3, combination of GSH, WHR, BMI, weight, GSH and supplement dosage (groups) as predictors proven to be the best combination in predicting the level of blood glucose. While, when GSH stands alone as predictor in predicting the level of blood glucose such in Model 1, the performance displays poorly in predicting the abnormal level of glucose correctly. Therefore, other health predictors (BMI, weight, WHR) were needed in enhancing the performance of the prediction model, such in Model 3. For the classifying power, all three models worked best with KNN classifiers exhibiting accuracy of more than 70% in classifying blood glucose level. However only Model 3 shows higher performance in its sensitivity and specificity.
Among the three models, Model 3 with GSH, BMI, WHR, weight and groups predictors concluded as the most reliable model in predicting the normal and abnormal level of the blood glucose.
Conclusion
This study has successfully developed models to predict the blood glucose level. The prediction models are based on GSH, BMI, WHR, weight and supplementation dosage (groups) parameters. Although GSH alone is a significant predictor, its combination with BMI, weight, and WHR has boosted the performance of the prediction model. KNN classifier has produces the best model with an accuracy of 84.7%. However, more data samples are needed to improve the specificity of the model. Despite that, the study has achieved the desired outcome which is to prove that GSH, BMI, WHR, weight and GSH oral supplementation dosage does affect the blood glucose level in women volunteers. Further study on the effect of GSH based on specific range of subject’s age can also produce more conclusive results. This can establish more precise and accurate predictions on the blood glucose level of a certain range of age.
Acknowledgements
This research was supported and funded by Chakra We Care Resources Sdn. Bhd. (Project No. RK011-2018, PV004-2017).
References
Ali, S. S., Ahsan, H., Zia, M. K., Siddiqui, T., & Khan, F. H. (2020). Understanding oxidants and antioxidants: Classical team with new players. Journal of food biochemistry, 44(3), e13145. DOI: https://doi.org/10.1111/jfbc.13145.
Antoniewicz, M. R., Stephanopoulos, G., & Kelleher, J. K. (2006). Evaluation of regression models in metabolic physiology: predicting fluxes from isotopic data without knowledge of the pathway. Metabolomics, 2(1), 41-52. DOI: http://doi.org/10.1007/s11306-006-0018-2
Avelar, T. M. T, Storch, A. S., Castro, L. A., Azevedo, G. V. M. M., Ferraz, L., & Lopes, P. F. (2015). Oxidative stress in the pathophysiology of metabolic syndrome: which mechanisms are involved? Jornal Brasileiro de Patologia e Medicina Laboratorial, 51(4), 231-239. DOI: http://doi.org/10.5935/1676-2444.20150039
Bernadó-Mansilla, E., & Garrell-Guiu, J. M. (2003). Accuracy-based learning classifier systems: models, analysis and applications to classification tasks. Evolutionary computation, 11(3), 209-238. DOI: http://doi.org/10.1162/106365603322365289
Ceriello, A., & Motz, E. (2004). Is oxidative stress the pathogenic mechanism underlying insulin resistance, diabetes, and cardiovascular disease? The common soil hypothesis revisited. Arteriosclerosis, thrombosis, and vascular biology, 24(5), 816-823. DOI: http://doi.org/10.1161/01.ATV.0000122852.22604.78
Cheong, K. C., Ghazali, S. M., Hock, L. K., Subenthiran, S., Huey, T. C., Kuay, L. K., ... Mustafa, A. N. (2015). The discriminative ability of waist circumference, body mass index and waist-to-hip ratio in identifying metabolic syndrome: variations by age, sex and race. Diabetes & Metabolic Syndrome, 9(2), 74-78. DOI: http://doi.org/10.1016/j.dsx.2015.02.006
Chowdhury, M. Z. I., & Turin, T. C. (2020). Variable selection strategies and its importance in clinical prediction modelling. Family Medicine and Community Health, 8(1), e000262. DOI: http://doi.org/10.1136/fmch-2019-000262
CodeBlue. (2020). Survey: 1.7 million malaysians risk three chronic conditions. Recovered on September 2020, from https://codeblue.galencentre.org/2020/05/29/survey-1-7-million-malaysians-risk-three-chronic-conditions/#:~:text=According%20to%20the%20National%20Health,7.0%20mmol%2FL%20or%20above
Gokgoz, E., & Subasi, A. (2015). Comparison of decision tree algorithms for EMG signal classification using DWT. Biomedical Signal Processing and Control, 18, 138-144. DOI: http://doi.org/10.1016/j.bspc.2014.12.005
Hosmer Jr., D. W., Lemeshow, S., Sturdivant, R. X. (2013). Applied Logistic Regression. [S. l.]: John Wiley & Sons.
National Health and Morbidity Survey [NHMS]. (2020). National Health and Morbidity Survey (NHMS) 2019 (NMRR-18-3085-44207). Non-communicable diseases, healthcare demand, and health literacy: Key Findings. Shah Alam, MA: Institute for Public Health National Institutes of Health (NIH).
Kern, J. K., Geier, D. A., Adams, J. B., Garver, C. R., Audhya, T., & Geier, M. R. (2011). A clinical trial of glutathione supplementation in autism spectrum disorders. Medical Science Monitor, 17(12), CR677-682. DOI: http://doi.org/10.12659/msm.882125
Liao, J. G., & Chin, K.-V. (2007). Logistic regression for disease classification using microarray data: model selection in a large p and small n case. Bioinformatics, 23(15), 1945-1951. DOI: http://doi.org/10.1093/bioinformatics/btm287
Liebal, U. W., Phan, A. N. T., Sudhakar, M., Raman, K., & Blank, L. M. (2020). Machine learning applications for mass spectrometry-based metabolomics. Metabolites, 10(6), 243. DOI: https://doi.org/10.3390/metabo10060243
Moher, D., Schulz, K. F., Altman, D., & CONSORT Group (Consolidated Standards of Reporting Trials) (2001). The CONSORT statement: revised recommendations for improving the quality of reports of parallel-group randomized trials. Jama, 285(15), 1987–1991. DOI: https://doi.org/10.1001/jama.285.15.1987
Pal, M., & Mather, P. M. (2001). Decision tree based classification of remotely sensed data. In Proceedings of 22nd Asian Conference on Remote Sensing, (p. 1-4). Recovered from https://bitlybr.com/pXKL
Sarkar, M., & Leong, T. Y. (2000). Application of K-nearest neighbors algorithm on breast cancer diagnosis problem. In Proceedings of the AMIA Annual Symposium Proceedings Archive, (p. 759-763). Recovered from: https://www.ncbi.nlm.nih.gov/pmc/articles/PMC2243774/
Steyn, M., Zitouni, K., Kelly, F. J., Cook, P., & Earle, K. A. (2019). Sex Differences in glutathione peroxidase activity and central obesity in patients with type 2 diabetes at high risk of cardio-renal disease. Antioxidants, 8(12), 629. DOI: https://doi.org/10.3390/antiox8120629
Tan, S. (2006). An effective refinement strategy for KNN text classifier. Expert Systems with Applications, 30(2), 290-298. DOI: http://doi.org/10.1016/j.eswa.2005.07.019
Termizy, H. M, & Mafauzy, M. (2009). Metabolic syndrome and its characteristics among obese patients attending an obesity clinic. Singapore Medical Journal, 50(4), 390-394.
Udo, M. C. T., Santana, R. G., Takahashi, K. E., Agosti, M. d. L., Pereira, S. R. C., & Beltrami, Z. S. (1999). Caracterização e modelo logístico na descrição da hepatite B ou C entre os doadores do Hemocentro Regional de Maringá. Acta Scientiarum, 21(4), 869-872.
Wang, Y., Pan, Z., & Pan, Y. (2019). A training data set cleaning method by classification ability ranking for the k-nearest neighbor classifier. IEEE Transactions on Neural Networks and Learning Systems, 31(5), 1544-1556. DOI: http://doi.org/10.1109/TNNLS.2019.2920864
Notas de autor
mas_dayana@um.edu.my
