Ciências da Saúde
Profile of the Population with Disabilities in the Metropolitan Area of Maringá
Perfil da população com deficiência da região metropolitana de Maringá
Profile of the Population with Disabilities in the Metropolitan Area of Maringá
Acta Scientiarum. Health Sciences, vol. 40, 2018
Universidade Estadual de Maringá
Received: 01 March 2016
Accepted: 02 March 2017
Abstract: An individual is considered disabled when he or she has permanent structural or functional abnormalities that prevent him or her from performing daily activities. There are around 1 billion people worldwide (about 15% of the population) with some type of disability or incapacity. About 80% of these people live in developing nations. This study aimed to identify and describe the profile of the disabled population in the Metropolitan Area of Maringá (MAM), Paraná, considering its socio-spatial structure, which was defined by the Metropolis Observatory, Maringá Center. The elaboration of the profile counted with data collected from the 2010 Census sample, provided by the Brazilian Institute of Geography and Statistics, and processed through the SAS software (2016). The study of the MAM in its general configuration reveals that its indicators are lower than national ones. The same indicators, when calculated considering its socio-spatial divisions, suggest a major imbalance in the prevalence of visual, hearing, motor or mental/intellectual disabilities. The research found the highest percentage of people with disabilities among the working class, working poor and farm workers. In contrast, the upper middle class showed the lowest indicators.
Keywords: disabled people, indicators, health profile.
Resumo: Uma pessoa é considerada portadora de deficiência quando apresenta alterações de estruturas ou de funções de forma permanente, o que pode incapacitá-la para a realização até mesmo de atividades cotidianas. Estima-se que aproximadamente 1 bilhão de pessoas no mundo, cerca de 15% da sua população, apresenta algum tipo de deficiência ou incapacidade. Destas pessoas, em torno de 80% vivem em países em desenvolvimento. Este trabalho tem por objetivo identificar e descrever o perfil da população de deficientes da Região Metropolitana de Maringá (RMM), Paraná, considerando sua tipologia socioespacial, a qual é definida pelo Observatório das Metrópoles, Núcleo de Maringá. Para a elaboração desse perfil, foram utilizados os microdados da amostra Censo 2010, disponibilizados pelo Instituto Brasileiro de Geografia e Estatística e processados por meio do software SAS (2016). Quando se trabalha a RMM na sua configuração geral, seus indicadores apresentam valores inferiores aos nacionais. Estes mesmos indicadores, quando calculados considerando sua divisão tipológica, sugerem um desequilíbrio importante na prevalência das deficiências, sejam elas visuais, auditivas, motoras ou mentais/intelectuais. Verificou-se que, de maneira geral, os tipos Popular Operário, Operário Popular e Agrícola apresentaram os maiores percentuais de pessoas com deficiências. Em contraposição, o tipo Superior Médio apresentou os menores indicadores.
Palavras-chave: pessoas com deficiência, indicadores, perfil de saúde.
Introduction
According to the International Classification of Functioning, Disability and Health (ICF), disabilities consist of abnormalities in body functions or structures. People with disabilities present physical, mental or sensorial limitations, manifesting a deviation from what is commonly accepted as a normal biomedical state of the human body. Decree 3.298 of December 1999 sets forth that a person with a disability is one who presents permanent structural or functional – physiological, anatomical, mental or psychological –losses that prevents him or her from performing certain everyday activities.
Data published in the World Report on Disability, in 2011, reveal that approximately 1 billion people, about 15% of the world’s population, have some form of disability, being the “largest minority in the world” (Moreno, 2016, p. 1), and about 80% of these people live in developing countries.
Countries have different patterns of disability, influenced by aspects as to health and environmental conditions. The increasing estimate of the number of people with this characteristic is partly attributed to people’s longer life expectancy because, in parallel to the aging process, there is a high rate of chronic diseases associated with disability. In Brazil, the percentage of people with some type of disability in 2000 was 14.5%, rising to 23.9% in 2010.
Data processed and published by the Brazilian Institute of Geography and Statistics (Instituto Brasileiro de Geografia e Estatística [IBGE, 2010]) reveal that the vast majority of people with a disability have the lowest levels of education and income, both in Brazil and in other countries. According to data from the 2010 Census, the percentage of the Brazilian population with at least one type of severe disability is 8.3%. If only the existence of the disability is considered, without quantifying its intensity, 18.6% has a visual, 5.10% a hearing, 7.00% a hearing and 1.40% a mental or intellectual impairment.
Microdata from the 2010 census sample, made available by the IBGE (2010), call for a need to describe the prevalence of different types of disabilities in the socio-spatial typology of the metropolitan area of Maringá.
The socio-spatial typology of metropolitan areas in Brazil is constructed by a methodology defined by the Metropolis Observatory - National Institute of Science and Technology, having as reference the predominance of socio-occupational categories. The categories are defined on the basis of contrasting social principles such as capital and work, large and small capital, wage earning and self-employment, manual versus non-manual labor, and control and execution of activities. Territorial division through the socio-spatial typology aims to identify patterns of social organization in metropolitan areas, interpreted in the context of Brazil’s current pattern of economic development, and seeks to relate the regional social organization to the process of local development historically anchored on socio-spatial differentiation, segmentation and segregation.
The Metropolitan Area of Maringá (MAM) is composed of 26 cities equivalent to an area of 5,577 Km2, with a total population of 716,918 inhabitants in 2010 (Figure 1)
The Metropolis Observatory – National Institute of Science and Technology operates as a network institute that brings together researchers from several institutions, having as goal to approach themes concerning Brazilian metropolises and development challenges. It is regarded as an innovative project intended to articulate civil society, academia and public power, using a unified research methodology, monitoring and intervention, besides the exploration of one same database. It is believed that the knowledge produced ensures a broader understanding of the impacts of transformations on Brazil’s large cities, which allows comparing results found with tendencies pointed out by international researches.
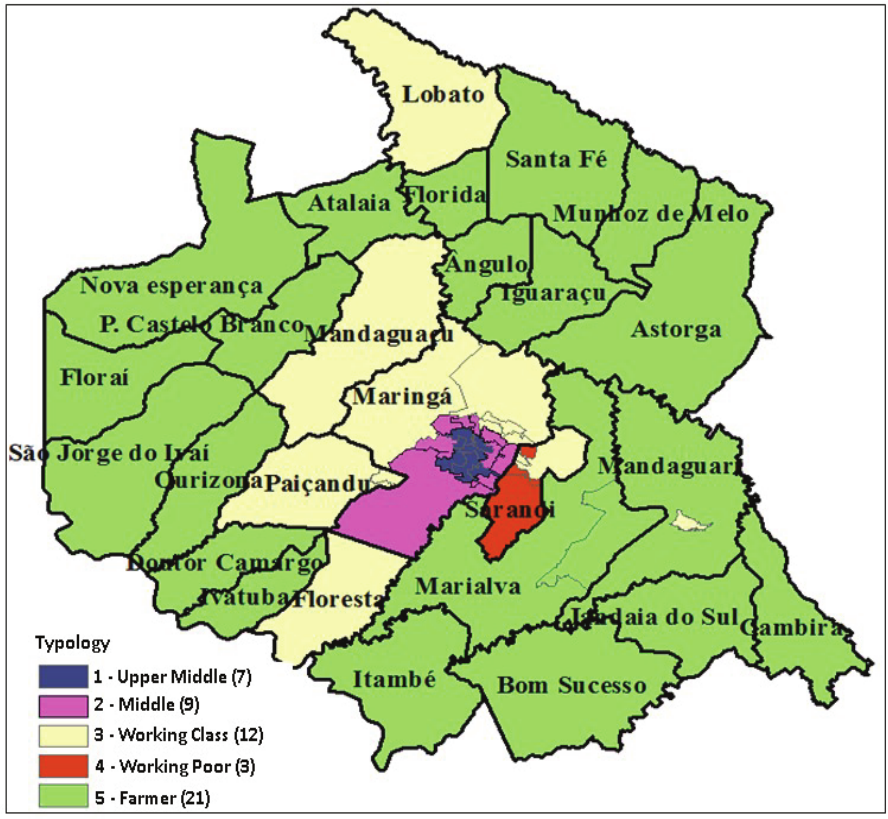
Figure 1.
MAM composition as to its municipalities and socio-spatial typology.
The objective of this study is to present the profile of the population with disabilities in the Metropolitan Area of Maringá (MAM), Paraná, identifying and describing the prevalence of different types of disabilities proposed by the Brazilian Institute of Geography and Statistics regarding visual, hearing, motor and mental/intellectual disability for the population of the Metropolitan Area of Maringá (MAM), in varied socio-spatial types. Its relevance lies in the fact that this is a little explored subject that, when studied, is relevant and can subsidize the development and application of public policies.
Methodology
This is a descriptive study characterized as a research developed with the aim of defining a sociodemographic profile of the population with disabilities in the MAM – considering the socio-spatial typology of the latter –, whose developed methodology consists of a social analysis of the territory, using the occupational category and crossing it with income, education, employment situation, economic activity sector and institutional sector to define a social stratification composed of twenty-four categories, called Social occupational categories (SOCs), grouped into eight large groups, classified as follows: 1) Heads; 2) College-educated professionals; 3) Small employers; 4) Average jobs; 5) Skilled tertiary workers; 6) Secondary Workers; 7) Unskilled tertiary workers and 8) Workers.
The socio-spatial typology was constructed to analyze the social organization of the metropolitan territory based on the SOCs
They are formed by groups of intrametropolitan territorial cuts, where each one of these groups seeks to present internal homogeneity and heterogeneity in relation to the others, so that a set of groupings of areas corresponding to a socio-spatial hierarchy can be obtained (Ribeiro & Chetry, 2015, p. 156).
Following this hierarchy, it is possible to analyze areas of concentration of social groups in the Metropolitan Areas.
The aim was to assess the prevalence of disabilities, considering each one of the five types defined in their structure: Type 1: Upper middle class (Private sector heads, Self-employed professionals with a college degree, Statutory Employees with a college degree, Large employers), Type 2: Middle Class (Large employers, Small employers), Type 3: Working class (Non-specialized service providers, Modern industry workers, Auxiliary service workers, Civil construction workers). Type 4: Working Poor (Civil construction workers, Domestic workers, Modern industry workers) and Type 5: Farmers (Agricultural workers) (Figure 1).
The individuals were classified as people with a disability when they answered positively to questions referring to having permanent difficulty as to: seeing, hearing, walking or climbing stairs, and mental/intellectual disabilities. Disability level classification was established by degree of severity: (1) Totally unable to perform it; (2) Great difficulty; (3) Some difficulty to perform it. The individuals were classified as having some type of disability if they answered positively to any of the three levels. They were considered as people with severe disability when their answer corresponded to alternatives (1) or (2). As for permanent Mental/intellectual disability, they were classified only by affirmative answers. According to the IBGE, when it comes to visual, hearing and motor impairments, when people make use of some device such as glasses, hearing aids, walking sticks or other, assessment is done with them using such devices.
The data used are available in full on the Brazilian Institute of Geography and Statistics website; they were organized, tabulated and analyzed through the Statistical Analysis System 9.3, Excel and ArcGIS 10 programs. This study does not require ethics committee approval because data are available to the general public online.
Results
According to data from the 2010 census, the MAM has 716,918 inhabitants, of which 349,503 (48.8%) are male and 367,415 are female (51.2%). In this population, 146,935 people claim to have some permanent difficulty to see, hear, walk, mental or intellectual, that is, in 2010, the proportion of people with some type of visual, hearing, motor, mental or intellectual impairment in the MAM was 20.5%.
Figure 2 displays comparatively percentages of the population that claims to have at least one type of disability and of those with severe disabilities, both in relation to the total population of the MAM. The disability with the highest incidence in the population is visual, 15.4%, followed by motor, 6.2% of the population, 4.5% of the population with hearing difficulties and, finally, 1.3% with mental or intellectual disability.
There is a need to know the contingent of individuals with severe disabilities, bearing in mind that this is a segment of society whose needs public policies should aim to meet. Assessing those with severe disabilities, that is, respondents who claimed to be totally unable or present great difficulty as to at least one of the difficulties listed, a total of 5.9% of the population was obtained. It is possible to observe that severe hearing loss then took the last position (1.0%), changing the sequence described in the previous paragraph.
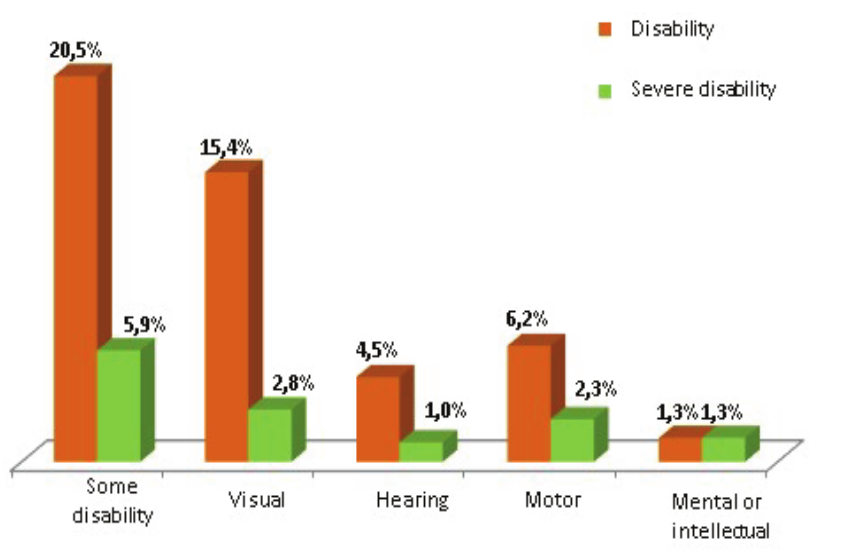
Figure 2.
Percentages by individuals that present some type of disability and severe disability in relation to the total population of the MAM. Source: IBGE (2010).
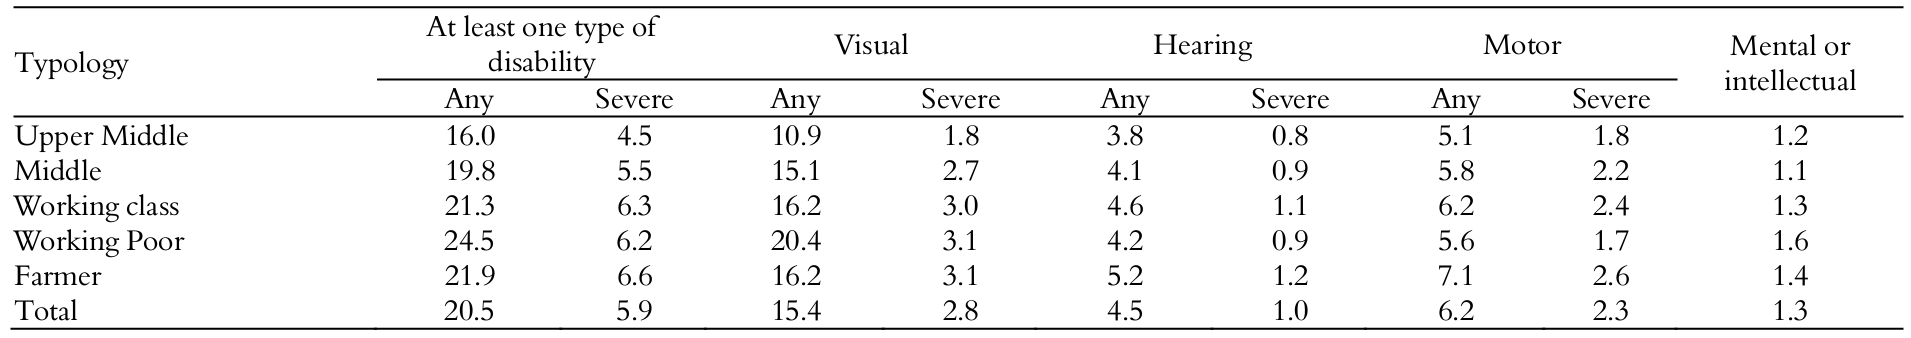
In order to identify where and whether there are significant differences in the distribution of the number of people with disabilities within the Metropolitan Area of Maringá, these identifiers were recalculated, considering the five types that make up its socio-spatial division. These rates are presented in Table 1. In that table, the lowest rates of disabilities, both severe and non-severe, occur predominantly in the Upper middle and Middle types, 4.5 and 16.0, 5.5 and 19.8%, respectively. The group with the highest percentage of people with any type of disability, regardless of severity level, as well as people with mental or intellectual disabilities, is Working Poor, with 24.5 and 1.6%, respectively. The Farmer and Working class types comprehend the highest rates of existence of some severe disability, with 6.6 and 6.3% respectively. When the type of disability is specified, these two groups also stand out with the highest values: severe visual disability, both with 3.1%, severe hearing loss with 1.2 and 1.1%, severe motor impairment with 2,6 and 2.4. It is important to highlight that among the individuals with a severe disability, the highest proportional incidence is confirmed for the group considered the last in the hierarchical scale of the metropolitan typology: Farmer. This fact suggests the preeminent need for more efficient procedures when it comes to prevention and healthcare services in rural areas.
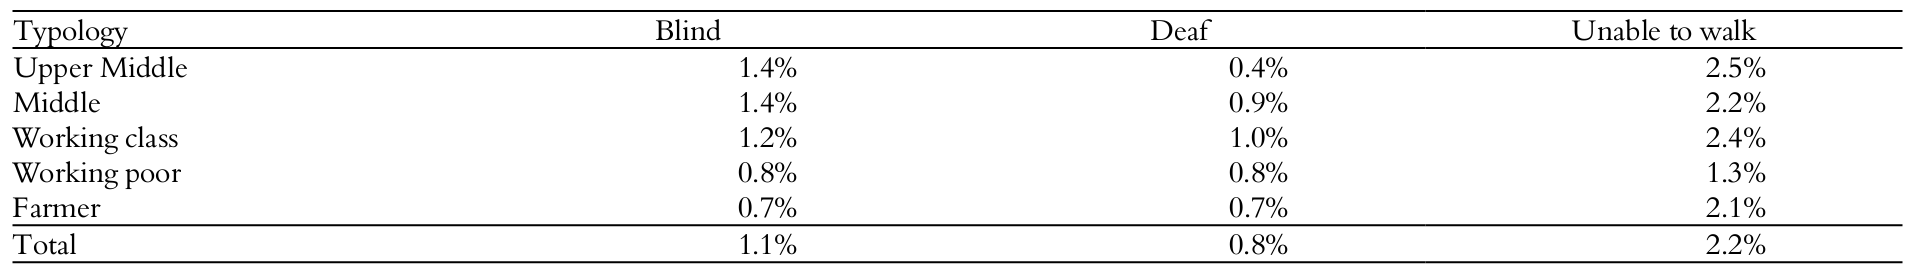
Within the universe of 146,935 people with some type of disability reported and analyzed by the interpretation of data collected by census takers in 2010, it was verified that 1.1% of those with some type of disability were blind, 0.8% deaf, and 2.2% unable to walk. Still considering as reference the population with some type of disability, Table 2 shows that, unlike Table 1, the Upper Middle and Middle types present the highest percentages of blind people, both with 1.4%, while in the Farmer type this rate is only 0.7%. The Upper Middle type also stands out with the largest number of people who cannot walk, accounting for 2.5% of this entire category.
Concerning severe disabilities (blindness, deafness and impossibility of locomotion), 1.1% of the population with some disability is blind, 0.8% is deaf and 2.2% cannot walk. In this category, there is a predominance of severe disabilities in the 0-14 age group, in which 2.2% is blind, 2.2% is deaf and 4.7% does not walk. Between 15 and 65 years of age, 1.1% is blind, 0.8% is deaf and 1.3% does not walk, and over 65 years old 0.8% is blind, 0.6% is deaf and 4.0% does not walk.
The total MAM population ages at a rate of 572 seniors per 1,000 youths. Specifically in the population without disabilities, this rate is of 242 seniors per 1,000 youths, that is, for every 1,000 youths there are 242 seniors without disabilities. About the population with disabilities, in turn, there are 6,801 seniors per 1,000 youths – that is, for every 1,000 youths there are 6,801 seniors with disabilities. Figure 3 allows us to see the transformation of characteristics with the aging of the population. Considering extreme age groups, from 0 to 4 years old, the rate of people with a disability was 1.6%, while for 70 years or over this percentage was 69.1%. We observe that it is from the age of 40 that the incidence of disabilities becomes more pronounced.
Source: IBGE (2010).
Source: IBGE (2010).
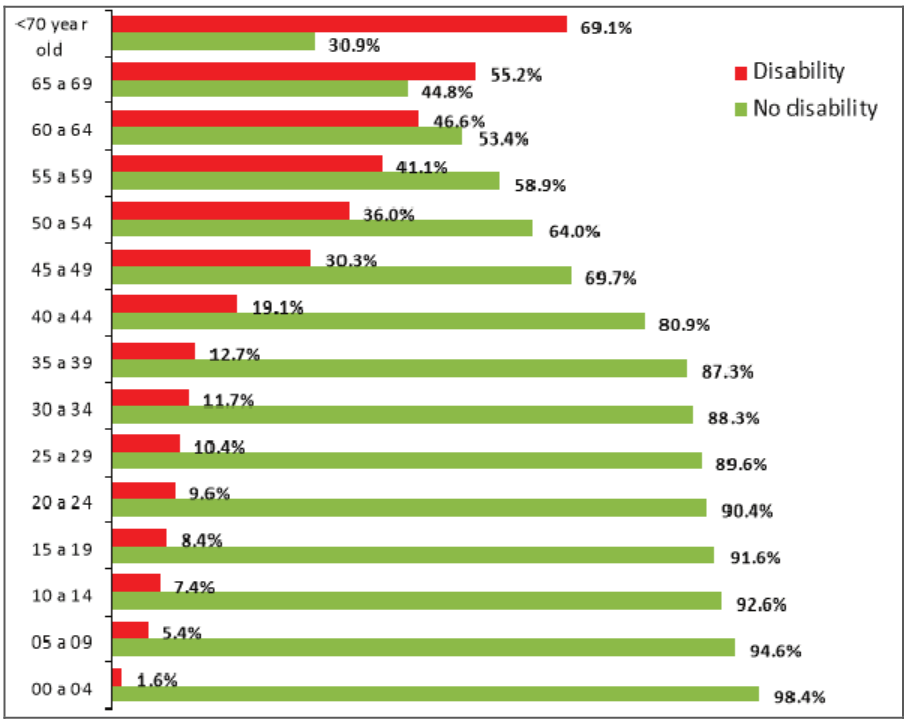
Figure 3.
Comparative graph of people with and without disability, by age group, 2010. Source: IBGE (2010).
Figure 4 compares the number of people with disabilities by age group. From the age of 65, the number of people with a disability increases significantly. From that age, visual, hearing, motor and mental/intellectual impairments account for respectively 44.6, 23.9, 35.0 and 3.0% of the total population of each of the age groups in the MAM population. While from 15 to 64 years old, 15.4% has a visual impairment, 3.2% a hearing impairment, 4.3% motor and 1.2%, mental/intellectual impairment. As for the age group between 0 and 14 years old, 3.2, 0.9, 0.7 and 0.8% had a visual, hearing, motor and mental/intellectual disability.
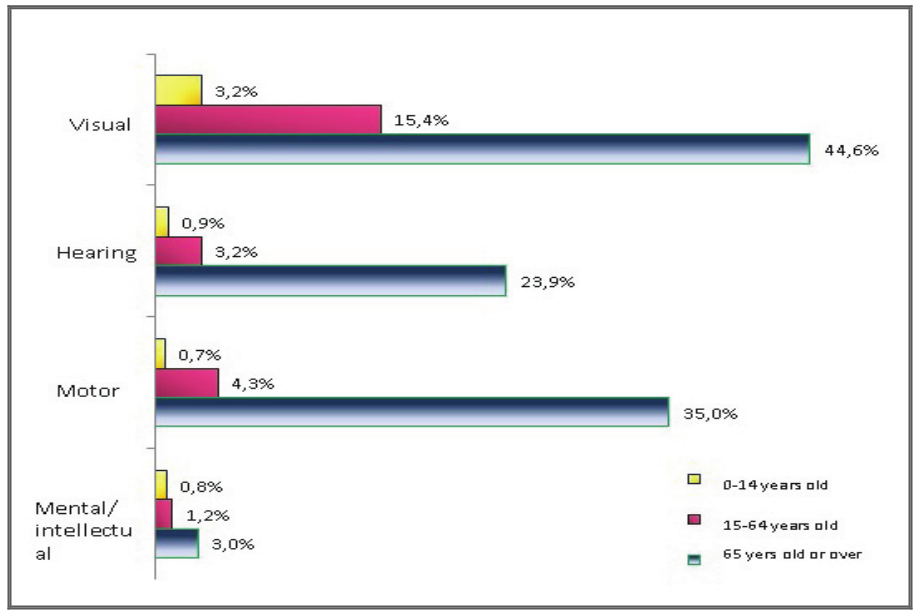
Figure 4.
Comparison of percentages of people with disabilities in the population residing in the MAM 1, by age group. Source: IBGE (2010)..
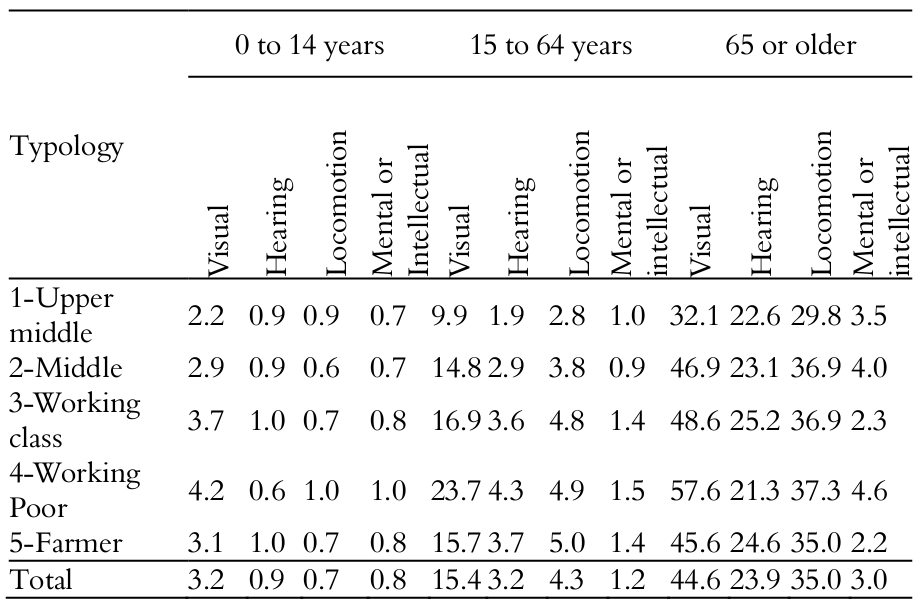
An analysis similar to the previous one is presented in Table 3. Its purpose is to characterize the behavior of populations with disabilities, considering socio-spatial types in the MAM, by age group, in relation to the total population of the same group, by typology and age group. Among all groups, the most frequent disability is visual. There is no intense variation in this group. Let us consider the Upper Middle type: it comprehends 16,567 individuals aged from 0 to 14 years old, out of which 372 are visually impaired; therefore, the incidence of the disability in this age group is 2.2%. Within the 15-64 age group, the type with the highest rates continues to be Working Poor: 23.7% visual, 4.3% hearing and 1.5% mental or intellectual. This group falls behind by only 0.1% when it comes to motor difficulties in relation to the Farmer type. For the older group, the Working Poor type is still the one with the highest prevalence of visual (57.6%), motor (37.3%) and mental or intellectual (4.6%) disabilities. About hearing, the Working class stands out with 25.2%.
Source: IBGE (2010).
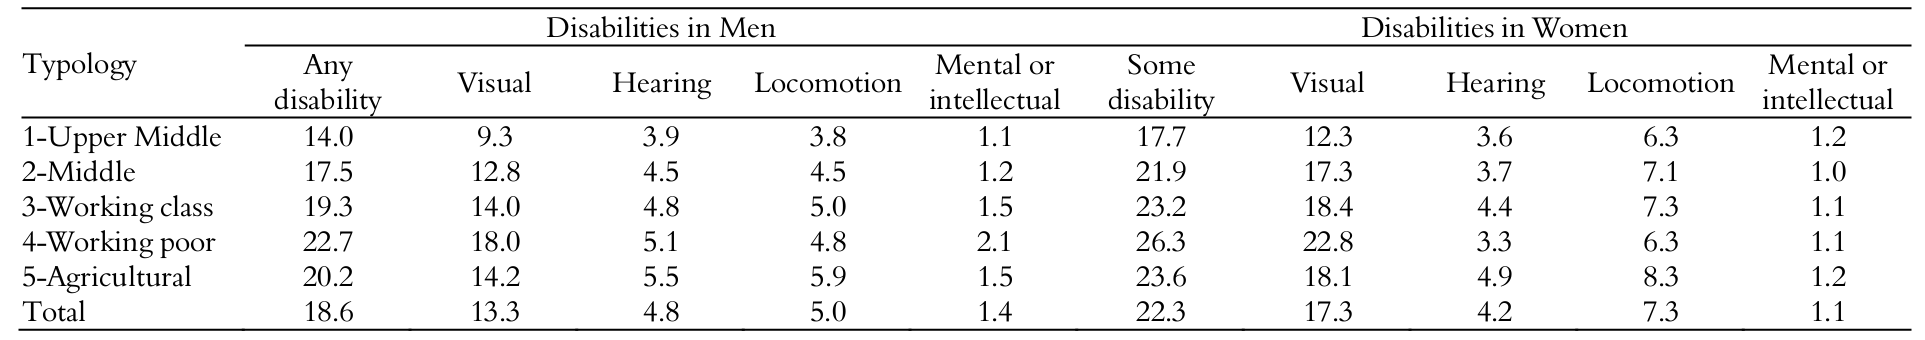
In general, when the MAM is assessed, the sex ratio is 95.1%, that is, for each group of 951 men there are 1,000 women. Considering people with some type of disability, the Popular Worker type has the highest prevalence rates – 22.7% (men) and 26.3% (women). This group also stands out as to visual impairment: 18.0% of men and 22.8% of women. In the Farmer type, 5.5% of the men and 4.9% of the women claimed to have permanent difficulties and, in this same group, we have 5.9% of the male population and 8.3% of the female with a locomotion disability (Table 4).
The number of women with some type of disability, visual and motor impairment, is higher in the entire socio-spatial structure of the MAM. The male population has higher incidence indicators when hearing and mental/intellectual disabilities are assessed.
Figure 5 shows the difference between people with at least one type of disability by sex and race, relative to the total population of the group in the MAM. Considering men, indigenous individuals presented stood out among those with a disability, accounting for 33.4% of this population, while women showed a higher percentage of disability when they were black, with 29.7% of the total of this specific population. Among the races that had the smaller number of people with a disability, white individuals stood out in both groups: men with 17.9% and women with 21.4%.
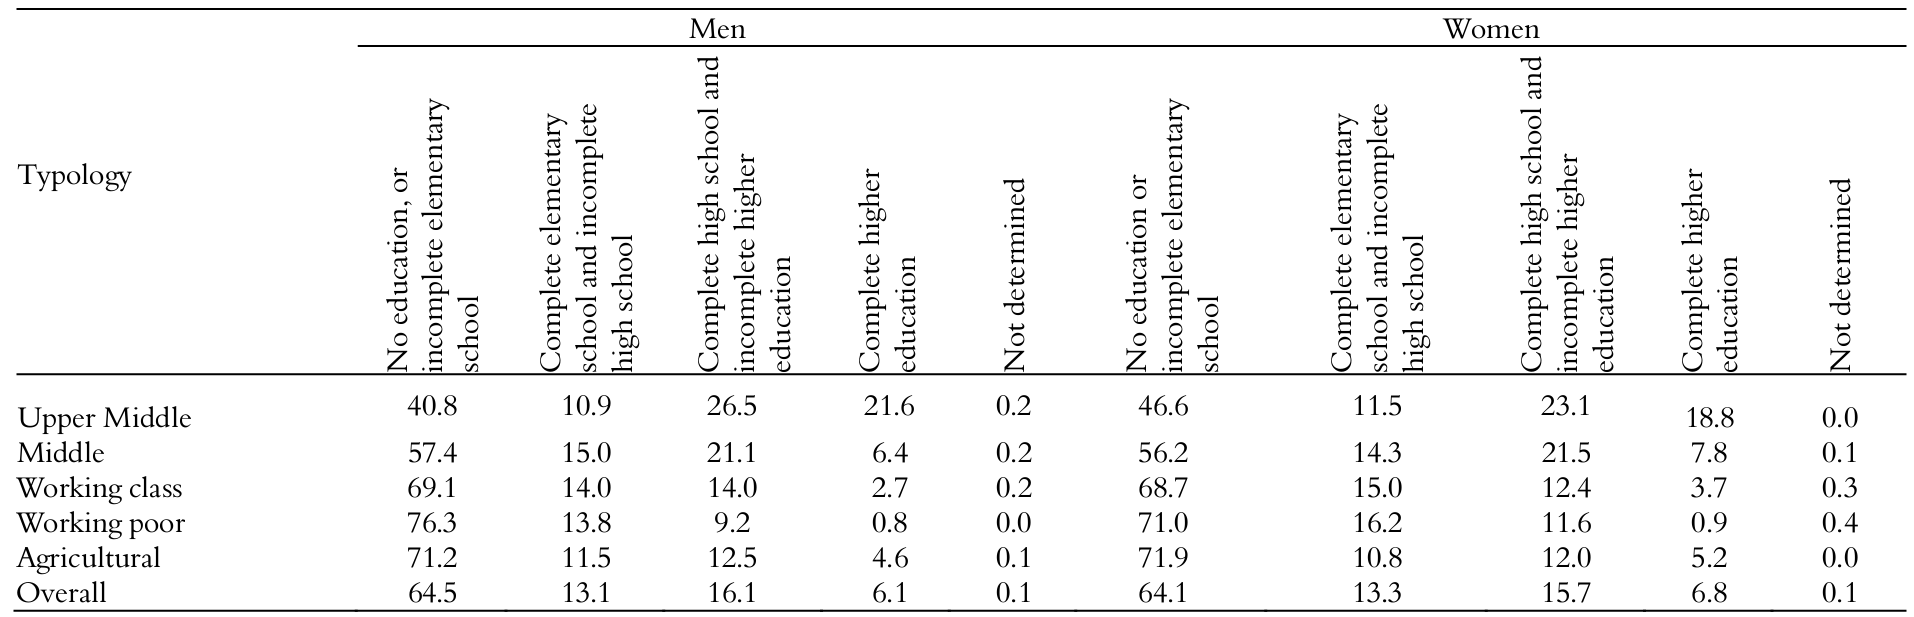
Table 5 refers to the percentage of the population aged 15 years or over that have reported some type of disability, considering the individuals in the socio-spatial type of the MAM and their respective level of education. The Working class, Working poor and Farmer types have rates higher than those of the country, 61.1% (regardless of sex), while for complete high school and higher education these figures are lower. In the Upper Middle group, there is a predominance of people with a college degree: among individuals with a disability, 21.6% are men and 18.8% are women. When this percentage is assessed without considering the socio-spatial type, rates drop to 6.1% among women and 6.8% among men.
Discussion
As a global phenomenon, disability has political, economic, cultural and social impacts on society as a whole. In the MAM, the proportion of people that claimed to have some type of disability is 20.5%, which is lower than national data published by the IBGE, equivalent to 23.9%, and also lower than data for the southern region, 22.5%, with it being the region with the lowest national rate. However, these values are higher than the world estimates presented by the World Health Organization, according to which 15% of the world population has some disability. Indicators for people with any type of severe disability are still inferior to national ones: 5.9 against 8.3% in the Brazilian territory.
Visual impairment, regardless of its level of severity, is the main disability that affects the entire Brazilian population. The same happens in the MAM population, but with rates lower than the national ones: 15.4% in the MAM against 18.6% 6 in the national population. Assessing disability in its severe level, the region’s rate is 2.8%, while Brazil’s stands at 3.46%.
Studies show that, worldwide, visual difficulties have increased in the last decades. A research conducted in Australia revealed drastic estimates for the coming decades: about half of the world’s population will be myopic by 2050, and this may become the main cause of blindness all around the world. In view of these high figures, Brazil has been implementing public policies aimed at including this population, such as authorization for guide dogs to stay in public places, accessibility to means of communication and other laws that guarantee citizens’ rights.
Source: IBGE (2010).
Source: IBGE (2010).
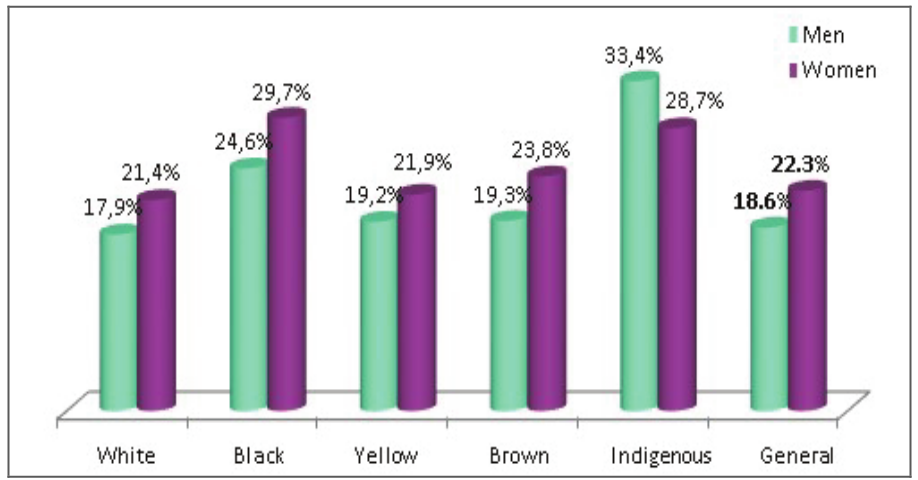
Figure 5.
Comparative of percentages of people with a disability, by sex and race. Source: IBGE (2010).
The second position in the disability occurrence classification, both in the Brazilian population (7.0%) and in the MAM (6.2%), belongs to motor disabilities. Assessing locomotion problems in their severe level of occurrence, the MAM has slightly lower indicators, but which are very close to national ones, 2.27 against 2.33%.
Hearing disabilities (5.10% for any and 1.12% for severe), and mental/intellectual disabilities (1.40%) in the national territory occupy, respectively, the third and fourth positions. Among the region’s population, when the level of severity is irrelevant, the prevalence of hearing loss stands at 4.5%, but only 1.0% for severe level, being lower than that of the population with mental or intellectual disabilities. Although mental or intellectual impairment has the lowest percentages, both nationwide (1.4%) and in the MAM (1.3%), it is a disability that is in a different situation from the others, as studies show a greater stigma surrounding it, “[...] taking from them [individuals with these types of disability] their right to an autonomous and fulfilling adult life [...]” (Dias, 2013, p. 173), making them childlike and dependent.
From the results observed, the Upper Middle type generally presents the lowest rates for people with any of the disabilities or severe degree. However, when speaking of extreme disabilities (blind, deaf and unable to walk), the highest percentages also correspond to this type: of all 17,553 people in this group who have some type of disability, 241 (1.4%) are blind and 444 (2.5%) are unable to walk. On the other hand, the highest rates of people with a disability belong to the Working poor type (24.5%), rate higher than the national ones, and the Farmer type (21.9%). The Working class type also accounts for the highest percentage of people with mental or intellectual disability (1.6%) and that exceeds the national rate (1.4%).
Population growth, advances in medicine and longer life expectancy tend to increase the number of people with a disability due to population aging. This reality can also be verified for the region under study: from the age of 40 there is a significant increase of people with disabilities.
The literature reports that the segment of people with disabilities tends to be composed of older people compared to people without disabilities, reflecting the process of aging of the population. To verify this assumption, it is common to use the aging rate, ratio between the extreme age components of the population, represented by the elderly (61 years or more) and youths (under 15 years). In 2000, on average, for each group of 4,330 seniors there were 1,000 youths under the age of 15. In 2010, this ratio rose to 6,801 seniors per 1,000 youths. However, this relation presents a very small variation when it comes to the population without disabilities: it goes from 216 to 242 seniors per each group of 1000 youths.
In general, when the types of disability were classified by age, all rates were lower than the national values; on the other hand, when classified by type, mentally or intellectually disabled people younger than 14 years old belonging to the Working poor type showed again a prevalence higher than national rates by 0.1%. In the 15-64 age group, this type also surpassed national values as to visual, hearing and mental or intellectual disabilities by 3.6, 0.1 and 0.1% respectively. Again, concerning people aged 65 or over, the rates also exceeded national ones by 7.8% for visual impairment and 1.7% for mental or intellectual impairment respectively. The other types maintained the rates lower than the national data.
According to the Centro Regional de Informação das Nações Unidas (UNRIC, 2016) the prevalence of disabilities is higher in women than it is in men in most countries. Studies also report that women with disabilities, in addition to suffering gender discrimination, suffer even more from prejudice when they have some disability. A research conducted in Canada showed that 40% of women with disabilities have already suffered some form of violence and 25% have been sexually assaulted, while in India almost all women with disabilities were assaulted at home and 6% of those with mental disabilities were forcibly sterilized. In the MAM, women with some type of disability are also more prevalent than men, with this difference being equal to 3.7%, which requires a great deal of attention from current rulers.
The prevalence was slightly higher among men as to hearing and mental or intellectual disabilities, with differences of 0.6 and 0.3% respectively, values close to national rates, in which these differences are equivalent to 0.4 and 0.3%. As for the male population, only the Working poor type presents a rate higher than the national one for number of mentally/intellectually disabled people (difference of 0.6%), while the Upper Middle and Middle types have the lowest rates, 1,1 and 1.2% respectively. Another group that surpasses national rates, by 0.2%, is Farmers when it comes to hearing-impaired ones.
Analyzing women with some type of disability, none of the types is superior than national indicators. Only when the visual impairment is specified, the Working poor type exceeds by 1.4% the Brazilian population’s rate. Another characteristic that stands out is mental disability: among women, the coefficient of variation is 8.7% and, among men, 25.3%, indicating that among females the average prevalence is homogeneous between typological groups.
The percentages of racial groups considered as reference the total population of people in the Metropolitan Area by race/color. The black and indigenous races or color had the highest percentages for both sexes, observing that the only race in which the male contingent exceeded the female was the indigenous one: of the total population of indigenous men in the MAM, 33.4% presented some type of disability. These indicators, when assessed without identifying the individual’s sex, present rates as follows: indigenous 31.2%, black 27.0%, brown 21.5%, yellow 20.6%, and white 19.7%. In this aspect, only the color or indigenous race stood above the national rate by a difference of 11.1%. It is also worth highlighting that the yellow color/race is 6.5% below the national benchmark.
The classification as to the level of education of people in the MAM, considering only people with some type of disability and aged 15 years old or over, exceeds the national by 3.2% when considering the percentage referring to people with a disability and without any level of education or with incomplete elementary school, in relation to the total population of disabled men in the region. Women show a higher percentage than men as to complete elementary school, incomplete high school and complete higher education, with differences of 0.2 and 0.7%, respectively. At other levels, the male superiority as to the proportion of disabled individuals is 0.4%.
Considering the socio-spatial typology, the greatest divergences are found in the Upper Middle type for both sexes. This type only does not surpass the difference in relation to the general classification for the female Working poor type (difference of 2.9%). It is worth pointing out that the dispersion of differences between male rates and general rates present greater variability.
Conclusion
Comparing statistics on disabled people in the national territory with the indicators obtained for the Metropolitan Area of Maringá, it can be observed that, in nearly their entirety, the percentages found in the studied region are inferior, evidencing lower prevalence of disabilities in the population in question. There was only one exception with the reporting of percentages referring to level of education; in this matter, the percentage of people with no education or with incomplete elementary education was slightly higher than the national one.
This picture changes significantly when data are computed and analyzed in compliance with the socio-spatial typology of the MAM. In this case, the percentages of disabled individuals evidenced a great discrepancy between the socio-spatial types, with the highest indicators predominating among the Working poor, Farmer and Working class types. In an antagonistic way, the type that showed the rates with the lowest absolute values predominantly was the Upper Middle.
This study evidences an important imbalance in the prevalence of disabilities distributed by socio-spatial types in the Metropolitan Area of Maringá, with a higher concentration among the types with lower purchase power. The Farmer type, the last one in the hierarchical scale of the typology, presented the highest rates regarding severe disabilities, which suggests a need to implement public policies for healthcare services in rural areas.
Finally, these results provide subsidizes for further investigations, allowing a better understanding of their causes, implications and possible actions that take into consideration the characteristics of socio-spatial types, bearing in mind the distribution of health and mobility infrastructures, among others.
References
Centro Regional De Informação Das Nações Unidas [UNIRC]. Alguns Factos e Números sobre as Pessoas com Deficiência. Retrieved on Fev 12, 2016 from www.unric.org/pt/pessoas-com-deficiencia/5459
Dias, S. S., & Oliveira, M. C. S. L. (2013). Deficiência intelectual na perspectiva histórico-cultural: contribuições ao estudo do desenvolvimento adulto. Revista Brasileira de Educação Especial, 19(2)169-182.
Instituto brasileiro de Geografia e Estatística [IBGE]. (2010). Censo Demográfico 2010: Resultados gerais da amostra. Retrieved on Fev 10, 2016 from www.ibge.gov.br/home/estatistica/populacao/censo2010/resultados_gerais_amostra/resultados_gerais_amostra_tab_uf_microdados.shtm
Moreno, L. (2016). A maior minoria da humanidade: um bilhão de pessoas com deficiência. Revista Livre. Retrieved on Fev 15, 2016 from www.revistalivre. com.br/direitos-humanos/dh/item/13 47-a-maior - minoria-da-humanidade-um-bilhao-de-pessoas-com-deficiencia.html
Neri, M. (2003). Retratos da Deficiência no Brasil. Rio de Janeiro, RJ: Cps/Fgv.
Organização Das Nações Unidas Brasil. A ONU e as pessoas com deficiência. Retrieved on Fev 17, 2016 from www.nacoesunidas.org/acao/pessoas-com-deficiencia.
Organização Mundial da Saúde [OMS]. (2011). Relatório Mundial sobre a Deficiência. São Paulo: Governo do Estado de São Paulo; Secretaria de Estado dos Direitos das Pessoas com Deficiência.
Organização Mundial de Saúde [OMS]. (2011). CIF – Classificação Internacional de Funcionalidade, Incapacidade e Saúde. São Paulo: Universidade de São Paulo; 2003.
Ribeiro, M. G., & Chetry, M. (2015). As categorias sócioocupacionais e a análise social do território. In L. C. Q. Ribeiro & O. A. J. Santos (Ed.), Metrópoles: território, coesão social e governança democrática: Rio de
Rodrigues, A. L. (2015). Metrópoles: território, coesão social e governança democrática: Maringá: transformações na ordem urbana. Maringá, PR: Letra Capital.
Rodrigues, A. L., Acorsi, C. R. L., & Souza, P. R. (2015). Estrutura e organização social do território da Região Metropolitana de Maringá. In A. L. Rodrigues (Ed.), Metrópoles: território, coesão social e governança democrática: Maringá: transformações na ordem urbana (p. 147-184). Maringá, PR: Letra Capital.
SAS for Windows. (2016). SAS 9.3 TS Level 1M1, W32_7PRO platform, Windows version 6.1.7601 [Software]. Cary, NC: SAS Institute Inc.
Notes
Author notes
rayanne-acorsi@hotmail.com.br