Ciências da Saúde
Activated platelets in central venous catheters: a flow cytometry and numerical simulation approach
Activated platelets in central venous catheters: a flow cytometry and numerical simulation approach
Acta Scientiarum. Health Sciences, vol. 43, e54978, 2021
Universidade Estadual de Maringá
Recepción: 29 Julio 2019
Aprobación: 02 Febrero 2021
Abstract: The central venous catheter that is inserted in patients undergoing hemodialysis can cause hemodynamic instability and trigger complications such as thrombus formation. The objective of this study was to investigate hemostatic and numerical influences on thrombus formation in patients undergoing hemodialysis with a central venous catheter. Participants were assigned to three groups: I: clinical and laboratorial healthy individuals matched by sex and age (controls); II: participants after one month of insertion of the catheter and III: participants after 4 months of insertion of the catheter. Platelet activation was investigated by GPIIb/IIIa and p-selectin expressions using flow cytometry. A three-dimensional model of the catheter was constructed in the numerical simulation for the calculation of partial differential equation of a platelet activation model. A significant difference was detected by the expression of p-selectin comparing the group I (33.42 ± 4.74), group II (40.79 ± 5.54) and group III(51.00 ± 7.21) (p < 0.0001). The median values for GPIIb/IIIa were 10426 (10029-10721), 13921 (13412-15652) and 19946 (18714-21815) after catheter insertion (p < 0.0001), for groups I, II and III, respectively. Excluding the first arterial orifice, venous orifices tend to have greater platelet activation when compared to the other arterial orifices. The results of this study showed the influence of arterial and venous lateral orifices in stimulating the development of thrombi associated with the activation of platelet markers the longer the catheter was used.
Keywords: renal dialysis, vascular access devices, coagulation agents, biomarkers, flow mechanics, polymer interaction.
Introduction
The hemostatic process of platelet activation includes the recruitment of platelets to the subendothelial matrix whenever there is vascular damage and release of tissue factor which; when activated, the platelets express glycoproteins from surfaces that interact with other platelets, vascular endothelium and inflammatory cells (Brockman, Kizhakkedathu, & Santerre, 2017; Gunawansa, Sudusinghe, & Wijayaratne, 2018; Ivert et al., 2019). This process stimulates thrombus development in the presence of a central venous catheter (CVC), responsible for most CVC dysfunctions in hemodialysis sessions (Gunawansa et al., 2018).
Platelet activation results in increased expression of surface adhesion molecules via GPIIb/IIIa on platelets and of P-selectin, which is a platelet surface glycoprotein that mediates the adhesion of activated platelets and stabilizes the GPIIb/IIIa-fibrinogen interaction until the platelet plug is formed (Long, Kenne, Jung, Fuchs, & Renné, 2016; Unsworth et al., 2017; Wang, Zhang, Lu, & Wang, 2018). P-selectin, consequently, stabilizes the thrombus, and the more activated it is by the presence of a biomedical device, the greater the expression of activated platelets.
A CVC, be it of short or long-term use, can stay a minimum of three months in the vein of a patient on hemodialysis, due to the arteriovenous fistula (FAV) not maturing, or to factors linked to comorbidities such as arterial hypertension and diabetes, which oftentimes make FAV healing impossible, and the patient starts using the CVC for the entire period of hemodialysis, which can reach up to 1 year (Yu, Wang, Xu, & Gao, 2018; Catieau, Devos, Chtourou, Borgel, & Plantier, 2018; Wei et al., 2019).
Thus, there are scientific and specific gaps and concerns about the daily practice of hemodialysis services, which should be further studied to prevent adverse events arising from thrombus formation, such as pulmonary embolism (Long et al., 2016; Unsworth et al., 2017; Wang et al., 2018).
Because of the importance of platelet deposition on the CVC and vein wall, it is essential to provide a quantitative description, including all relevant elements present under real conditions. Numerical studies such as the Platelet Lysis Index (PLI) in the presence of medical devices and its relation with hemostasis remains poorly understood (Yazdani, Li, Humphrey, & Karniadakis, 2017; Feng, Cortina, Chesnutt, & Han, 2017; Mukherjee & Shadden, 2018; Govindarajan et al., 2018; Link et al., 2018).
In addition, numerical models of platelet activation using PLI by the Partial Differential Equations (PDEs) compared to the description of thrombus development remain elusive (Lu, Lee, Zhu, Sinno, & Diamond, 2017; Taylor, Yang, Deutsch, & Manning, 2017; Rojano, Mendez, & Nicoud, 2018).
This lack of knowledge about this issue limits our understanding of the thrombus as a spatial structure whose composition may vary over time. The purpose of this study was to investigate the hemostatic and numerical influence on thrombus formation in patients on hemodialysis with a CVC.
Material and methods
Study population
This is a cross-sectional study whose data were collected from June to November 2020 at the hemodialysis unit of Diamantina Hospital, state of Minas Gerais, Brazil.
For the platelet activation analysis, the participants were divided into three groups: Group I: represented the control of this study – healthy participants matching the other groups as to sex and age. Group II: hemodialysis patients who completed 1 month after CVC insertion; and Group III: patients who completed 4 months of CVC insertion. This study included patients with end-stage kidney disease undergoing hemodialysis and using CVC in the right or left internal jugular vein. At the end of the selection, 68 adult patients of both sexes, aged 34 to 66 years old, were included. The total sample was divided as follows: 34 participants for Group I, 17 for Group II, and 17 for Group III. Participants who agreed to participate in this study signed the Informed Consent Form.
This study was approved by the ethics committee at the Federal University of the Jequitinhonha and Mucuri Valleys, Minas Gerais, Brazil, (process number 2,740,297).
Sample collection
The blood samples were gently removed, in order to avoid the activation of platelets, both from the CVC lumen and from a peripheral vein of the same patient. A total of 4 ml were collected from each and inserted into tubes containing EDTA-K3 sodium citrate using a Vacuette® system for flow cytometry. Besides, an additional 4 ml of blood were collected from both the CVC and the same peripheral vein, then inserted into EDTA tubes for platelet count (BC-5380 Mindray®). Blood samples were collected just before the start of the hemodialysis procedure and were used for flow cytometry assays immediately after being collected at the hemodialysis unit.
Flow cytometry
Initially, to obtain platelet-rich plasma (PRP), citrated samples were centrifuged at 57x g for 10 minutes. PRP 1x was dripped into a new tube and then platelet counts were performed. For platelet fixation, aliquots of 400 µL of PRP were dripped into three 12 x 75mm polystyrene tubes containing 1.00 µL of fixing solution (10 g L-1 paraformaldehyde in 10.2 g L-1 sodium cacodylate and 6.63 g L-1 sodium chloride). The fixed-platelet suspension was adjusted to 5 x 10³ platelets mL-1.
Then, 100 μL aliquots of the platelet suspension were added into a 12 x 75 mm polystyrene tube containing 3 to 5 μL of monoclonal antibodies directed against platelet glycoproteins. An amount of 5 μL CD62P PE antibody (BD Biosciences, San Jose, CA) and 3 μL of the anti-CD41a FITC antibody (BioAlbra Biotecnologia Ltd., MG, Brazil) was added into a single tube. Another tube contained an internal auto-fluorescence control (white) in which the platelet suspension was incubated in the absence of monoclonal antibodies. The tubes were homogenized in a vortex and then incubated at room temperature and protected from light for 30 minutes. After the incubation period, the samples were washed with 1mL of phosphate buffered saline (PBS) solution, homogenized in a vortex (AP56®, Phoenix) and centrifuged at 157 x g for 10 minutes. The supernatant was discarded by inversion, and the excess was poured out of the tube on absorbent paper. The pellet was resuspended in 200 µL of PBS.
A total of 50,000 events were acquired per tube using BD FACSCanto™ II flow cytometry. The results were registered using BD FACSDIVA® 8.0.1 software and analyzed using FlowJo®, LLC (Ashland, Oregon, USA-Tree Star) software 10.4.2. Platelets were identified based on forward scatter area (FSC-A) versus side scatter area (SSC-A) properties. The platelets were further identified by the specific platelet marker, CD41a/ GPIIb/IIIa, and their activation was measured by the expression of CD62P/P-selectin on the surface of the platelets (Figure 1).
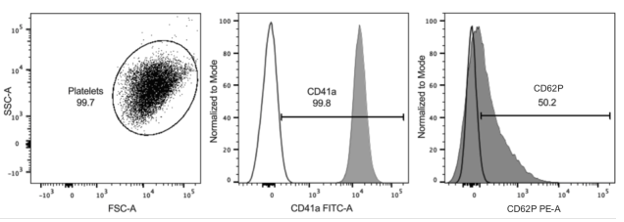
Figure 1. Forward scatter area (FSC-A) versus side scatter area (SSC-A) (left graph, dot plot). Platelets identified and marked with CD41a-FITC. P-selectin (CD62P PE) was used to evaluate activated platelets (right graph). Gate regions were defined using unstained controls from each participant (unfilled).
Numerical simulation
Three-dimensional geometry was imported into the ANSYS-Fluent® 19.2 software (ANSYS-Fluent Inc., Lebanon, NH, USA) and it was applied to obtain momentum equations in transient flows incomprehensible with the rigid vessel wall assumption. The mesh test was done following The American Society of Mechanical Engineers Standards (The American Society Engineering Standards, 2009), and it was refined using adaptive criteria for the velocity, pressure and strain rate gradient until the results become mesh independent. The meshes comprise unstructured tetrahedral and hexahedral elements. Hexahedral refined elements were used in near wall region to reduce the numerical error, in addition to capturing the boundary layer effects accurately. A boundary layer consisting of four rows was established, with an expansion factor of 1.2 and a total depth of 0.1 mm (Figure 2).
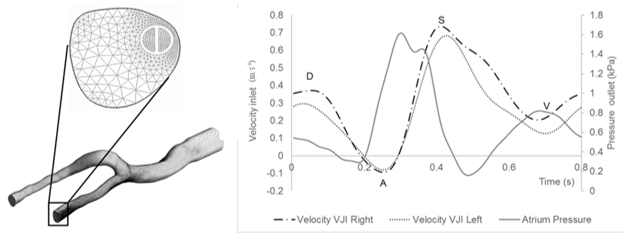
Figure 2. Generated mesh of venous model with the catheter inserted into the right internal jugular vein. Enlarged image of the hexahedral elements near the wall of the vessel and the boundary layer. Waveforms of the blood flow in the internal jugular vein and of the pressure in the atrium.
Waveforms of the jugular blood inlet velocity and atrium pressure were approximated from the experimental curves found in the literature and intravenous color Doppler lines (Lucas et al., 2014; Cronenwett & Johnston, 2016; Fulker, Sayed, Simmons, & Barber, 2017) (Figure 2). The (A) wave occurs when the atrium contracts, increasing atrial pressure. At the same time, blood is propelled in a retrograde direction toward the veins. When the tricuspid valve closes, the systole wave (S) occurs. The transitional (V) wave corresponds to atrial overfilling against a closed tricuspid valve, anticipating the opening of the valve in diastole (D).
The simulation was performed using a k-ω Shear Stress Transport (SST) turbulence model with correction for low Reynolds values (Govindarajan et al., 2018; Link et al., 2018). Blood flow was considered to be non-Newtonian fluid with density of 1,060 kg m-3 and viscosity followed by the Carreau-Yasuda (C-Y) model (Govindarajan et al., 2018). The following set of parameters was used for blood analog fluid: viscosity of 0.056 Pa s and 0.0035 Pa s; time constant of 3.313s, power-law index = 0.3568 and Yasuda exponent = 2.
The ‘upwind’ was chosen as the differentiation scheme for PLI calculation. The shear stress threshold value (ts) was set equal to zero so all stress values were included in the calculation. The duration of a cardiac cycle was assumed to be 0.8 s, yielding a heart rate of 75 beats per minute. The second-order backward Euler method was used for time integration. A constant time step was employed, and Δt = 0.005 s with 160 total time steps per cardiac cycle, respecting the Courant-Friedrichs-Lewy condition.
PDE-platelets activation
To quantify the potential for thrombus formation, a new method combined with the original research was proposed (Mareels, Kaminsky, Eloot, & Verdonck, 2007), to describe a numerical model of Platelet Lysis Index equation with experimentally defined constants previously. The model is described by the following Equation (1).
 (1)
(1)This equation can be used as a tool to aid visualization and estimation of platelet activation and its transport through the vessel. Where is the magnitude of shear stress and t is the exposure time. To develop a PDE, we built a time linear Equation (2) by multiplying it by
 , creating the linear
 .
.
 (2)
(2)Considering that Equation (1) was created based on experimental data from a Couette flow (Mareels et al., 2007), the shear stress was constant in the material volume, and the time derivative along a streamline can be given by Equation (3):
 (3)
(3)Then, we have to assume that the results obtained in the initial experiment were valid in any arbitrary micro-volume of blood moving through the device. Applying the Reynolds transport theory, the local variation of in time at a reference instant was:
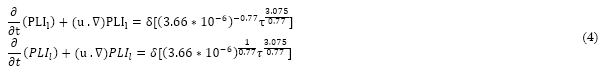 (4)
(4)Solving Equation (4) in the computational domain resulted in a field of , which can be known at each point of the domain. The coefficient was added to represent the shear stress threshold
  , below which platelets were not activated even despite very high dwell time, according to Equation (5):
 (5)
(5)Thus, the general formulation of the partial differential equation for PLI calculation was:
 (6)
(6)In our case,
Equation (6) is a first-order linear equation, which can be easily calculated as a transport equation in the most used computational fluid dynamics software. Lastly, the average PLI value was calculated, using its mass flow average measured over the outflow boundaries, as given in Equation (7).
 (7)
(7)Results
Flow cytometry
A significant difference was found by the expression of p-selectin comparing control group (33.42 ± 4.74) and the percentage obtained from CVC at a time of 1 month (40.79 ± 5.54) and 4 months (51.00 ± 7.21) after CVC insertion (p < 0.0001). The median values for GPIIb/IIIa expression were 10426 MFI (10029-10721) for the control, 13921 MFI (13412-15652 for the 1 month of catheter insertion and 19946 (18714-21815) for the 4 months of catheter insertion (p < 0.0001) (Figure 3).
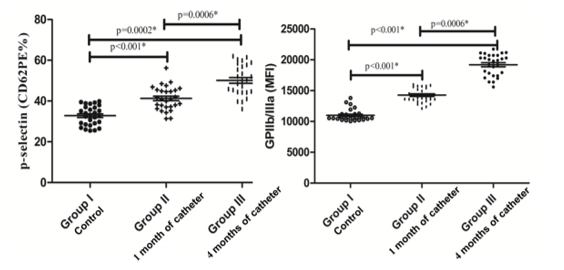
Figure 3. Percentage analysis of p-selectin on the left, and GPIIb/IIIa expressed in median fluorescence intensity (MIF) on the right. *Student’s t-test and Mann-Whitney test.
Numerical simulation
Figure 4 illustrates the volumetric distribution of PLI in CVC geometry inner the vein. The platelet activation potential gradually increased within the catheter mainly due to the constant shear stresses in the internal lumen. The effect on the PLI deposition is illustrated when the outer region of the catheter comes in contact with the intima layer of the vein wall. The platelet activation potential in this region is much higher when compared to the other analysis points.
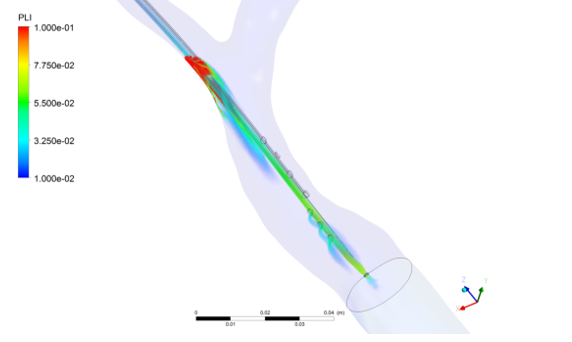
Figure 4. Volumetric distribution of platelet lysis index in the geometry of the internal jugular vein with the Central Venous Catheter.
Figure 5 shows the average of the wall shear stresses when compared the inner and outer wall of the CVC. In it we can see major characteristics of the behavior of wall shear stresses in CVC wall.
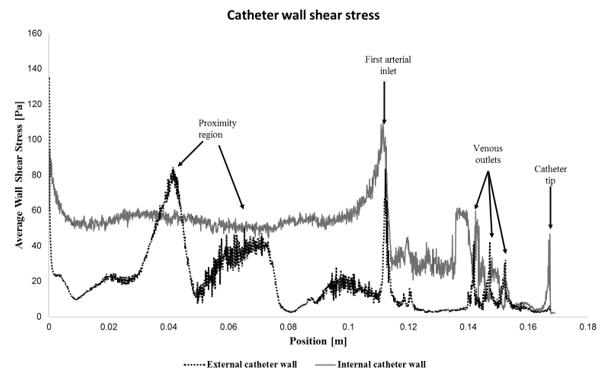
Figure 5. Average wall shear stress at external and internal catheter wall.
The inner wall of the catheter also produces an almost constant shear stress with relatively high values, as can also be seen in Figure 6a. This contributes to the higher PLI values found at the catheter’s arterial lumen outlet (Figure 6b). The arterial orifices, unlike the venous orifices, present a concentration of stresses in only the first orifice (Figure 6c). The proximal orifice is the nearest to the valve (first arterial orifice), while distal orifice is the nearest to the tip of the catheter.
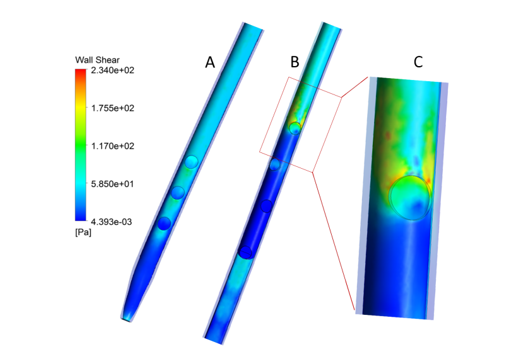
Figure 6. Distribution of wall shear stress in the inner wall of the Central Venous Catheter: a) venous orifices side; b) arterial orifices side, and c) details of the first arterial orifice.
Discussion
Flow cytometry
This study revealed that the expression of activated platelets was greater compared to the control group (Figure 3). This result corroborates with other studies that also identified a tendency to thrombus formation the longer the CVC remains inserted in the patient (Brockman et al., 2017; Gunawansa et al., 2018; Ivert et al., 2019). Platelet activation is a factor that worsens the clinical condition of patients with chronic end-stage kidney disease because, due to a natural state of hypercogulability intrinsic to the disease, the CVC can increase the accumulation of various pro-coagulating factors, platelets and leukocytes, leading to thrombus formation (Yu et al., 2018). The increase in p-selectin promotes platelet aggregation and, after platelet activation, the glycoprotein is transferred to its cell surface, activating the endothelium by the CVC being in contact with the vessel wall (Wei et al., 2019).
In this sense, the formation of a thrombus becomes a possible adverse event that can lead to complications for the patient on hemodialysis. Frequent monitoring, especially by the nursing team, of the dialysate flow and amount of blood that passes through the CVC lumens is an important care to avoid not only compromising the quality of hemodialysis, but also the occurrence of thrombi and the consequent formation of pulmonary emboli. An indicator of risk for thrombus development would be that, despite the use of anticoagulants and fibrinolytic agents applied to the CVC lumen, when the thrombus develops it creates dense fibrins that bind to the wall of the arterial and venous orifices of the CVC, preventing the dissolution of this tissue that binds to the CVC polymer (Lucas et al., 2014).
Thus, stimulating platelet activation can cause a thrombus to develop quickly and indissolubly, mainly due to increased expression of p-selectin (Figure 3). Different results were found by a study that was also conducted with patients on hemodialysis and that assessed the expression of p-selectin collected, however, from the FAV (Yu et al., 2018). The findings showed that the percentage of p-selectin was lower compared to that of healthy patients, but probably due to the use of anticoagulants inserted in the hemodialysis machine. Moreover, in this study, blood was collected prior to dialysis sessions, which contributed to the non-interference of the anticoagulant used during the sessions. Another study assessed platelet dysfunction caused by a mechanically-assisted circulation device and also found an increase in p-selectin and GPIIB/IIIa 4 hours after the device was inserted, besides showing, using fluorescence microscopy, the adhesion of platelets to the device wall (Chen et al., 2019). These findings corroborate the results of this study by showing increased expression of surface glycoproteins after CVC insertion.
Another study also assessed the hemostatic variation of p-selectin after three months of myocardial revascularization surgery (Ivert et al., 2019). The results revealed that p-selectin expression increased significantly (p < 0.05) three months after the surgery and was associated with thrombotic complications (Ivert et al., 2019). Within this context, it is possible to note that, over time, medical-hospital devices can trigger an increase in the intrinsic and extrinsic coagulation pathways, thus increasing the risk of adverse events in patients on hemodialysis.
A study that assessed platelet expression after different incubation times also showed an increase in p-selectin over time when exposed to stimulus activation (Södergren & Ramström, 2018). These findings also corroborate with the present study by revealing that contact between the tip and wall of the CVC and the vessel endothelium can damage it and lead to an increase in the expression of activated platelets. Finally, in daily practice, small precautions such as CVC non-traction, instructing the patient not to sleep on the same side as the CVC, checking the dialysate flow that passes through the catheter could contribute to reducing the stimulus to wounds in the vessel endothelium.
Numerical simulation
The PLI distribution was obtained along the three-dimensional-geometry of veins and CVC. The PLI values are much higher in the region of proximity between the vein and the CVC walls. After this region, PLI values are transported by convection into the vein (Figure 4). This can result in backflow and leakage of infusate from the catheter insertion site due to the extrinsic thrombi that can attach to the vessel wall intima at the point of its contact with the catheter and have a risk of propagation and embolization similar to other forms of deep vein thrombosis. The concentration of the PLI in the first arterial orifice is about 61.5% total mass flow when the blood enters the arterial lumen. Thus, evidence indicates that the first proximal arterial orifice in a catheter could be the primary sites of thrombus formation potential.
Further, the mass flow in most of the other arterial orifices were distributed as follows: with values of 23.3, 10.3 and 4.9%, from the proximal orifice to the orifice closest to the tip of the catheter. On the other hand, the mass flow in venous orifices, from the third orifice to the central tip orifice were 31.6, 30.0, 27.1 and 11.3%. Thus, there was an imbalance of mass flow between venous and arterial orifices, which may differ in the probability of forming thrombi.
It is worth noting that also in the catheter’s first arterial orifices, the wall shear stress values were much higher when compared with other arterial or venous orifices (Figures 5 and 6). Despite the differences in platelet activation potential between the arterial and venous orifices, there were higher values of wall shear stresses in all lateral catheter orifices when compared to the catheter lumen extension. This result may demonstrate that catheters with lateral orifices tend to have a greater potential for platelet activation when compared to those without them. Also, the thrombus formed may be developed both within the CVC orifices and also in the outer wall of the catheter lumen when in contact with the intima layer of the vessel.
The averages of stresses were usually higher within the catheter than on the outside. This implies a larger PLI in the interior, when considered the values of mass flow weighted average in each outlet, being 1.477E-2 at the outlet of the arterial lumen and 2.115E-3 at the outlet of the internal jugular vein
Thus, this could indicate an optimized CVC design, altering the dimensions and positioning of the arterial and venous orifices to equilibrate the distribution of the wall shear stresses and consequently reduce the potential for thrombus formation.
Experimental measurements by flow cytometry and viscometer showed the influence of non-physiological high shear stress on activation of platelet GPIIb/IIIa receptor and p-selectin status with three short exposure times (0.05, 0.5, 1.5 s) (Chen et al., 2015). The results showed that the number of activated platelets, as indicated by the surface GPIIb/IIIa activation and P-selectin expression, increased with increasing the shear stress level and exposure time (Chen et al., 2015).
In this study, also the PLI intensity increased with increasing time of exposure to wall shear stress (Figures 5 and 6). From the aforementioned results, since more activated platelets are concentrated in the regions of proximity to the vein wall, they could remain longer in the catheter wall and consequently increase the expression of the activated GP IIb/IIIa and P-selectin expression.
In a proximity region, wall shear stress is high for a longer length which explains the higher PLI values found in Figure 5.
Even the exposure time was very short (0.05 s), platelets became activated by the non-physiological shear stress if the applied shear stress level exceeded 75 Pa (Chen et al.,2015). In this study, the calculation of PLI also consider the cross relationship between the wall shear stress and the exposure time to this stress. The experimental result from this study showed that the longer the CVC stay in the vein, the greater the platelet activation, seen mainly by the increase in P-selectin. Thus, the GPIIb/IIIa activation and P-selectin also increased with increasing the wall shear stress level and exposure time.
Another computational fluid dynamic analyzed the hemodynamics of blood exiting a hemodialysis plastic cannula (Fulker et al., 2017). The study reported that elevated levels of wall shear stress may lead intimal hyperplasia on the vein as well as regions of high wall shear stress residence time (Fulker, Sayed, Simmons & Barber, 2017). A similar result was found in this study, where high levels of wall shear stress were associated with high values of PLI (Figure 6).
In addition to the results of this study, the magnitude of wall shear stress, and the duration of exposure to these forces were also important factors in activating platelets (Figure 6).
Many studies have been conducted to identify the level of non-physiological high mechanical shear stress and exposure time as the dominant factors causing platelet activation by computational fluid dynamics (Chen et al., 2015; Brass & Diamond, 2016; Link et al., 2018).
However, due to the complexity of these processes, it is difficult to intuit the overall hemostatic response without quantitative methods. Therefore, in this study, the PDE method could be a good instrument to predict the thrombogenic potential; and both the prediction measures and source term were a valid solution for uniaxial flow with constant velocities along the flow field. Nevertheless, there is a limitation in this study for the prediction of platelet activation since the multiphase and chemical model were not considered for the entire coagulation cascade considering the agonists and antagonists in the thrombus formation process.
Conclusion
The results of this study identified that, the longer the CVC remained inserted in patients with end-stage kidney disease on hemodialysis, platelets were activated with the expression of glycoproteins on their surface. The PLI showed that excluding the first arterial orifice, venous orifices tend to have greater platelet activation when compared to the other arterial orifices.
In the daily practice, especially for the nursing team, our findings represent important data to ensure participant safety and prevent adverse events from occurring in hemodialysis once the first arterial orifice presented greater tendency to platelet activation among the lateral orifices of the catheters, when compared to the other orifices.
Acknowledgements
This work was supported by the National Council for Scientific and Technological Development (CNPq) [grant numbers 401217/2016-7].
References
Brass, L.F., & Diamond, S.L. (2016). Transport physics and biorheology in the setting of haemostasis and thrombosis. Journal of Thrombosis and Haemostasis, 14(5), 906-917. DOI: https://doi.org/10.1111/jth.13280
Brockman, K. S., Kizhakkedathu, J. N., & Santerre, J. P. (2017). Hemocompatibility studies on a degradable polar hydrophobic ionic polyurethane (D-PHI). Acta Biomaterialia, 48(1), 368-77
Catieau , B., Devos, V., Chtourou, S., Borgel, D., & Plantier, J. L.(2018). Endotheliall cell surface limits coagulation whitout modulating the antithrombin potency. Thrombosis Research,167(7), 88-95. DOI: https://doi.org/10.1016/j.thromres.2018.05.019
Chen, Z., Mondala, N. K., Ding, J., Koeniga, S. C., Slaughter, M. S., Griffith, B. P., & Zhongjun, J. W. (2015). Activation and shedding of platelet glycoprotein IIb/IIIa under non-physiological shear stress. Molecular and Cellular Biochemistry, 409(1), 93-101. DOI: https://doi.org/10.1007/s11010-015-2515-y
Chen, Z., Zhang, J., Kareem, K., Tran, D., Conway, R. G., Arias, K., … Wu, Z. J. (2019). Device-induced platelet dysfunction in mechanically assisted circulation increases the risks of thrombosis and bleeding. Artifical Organs, 43(8), 745-755. DOI: https://doi.org/10.1111/aor.13445
Cronenwett, J. L., & Johnston, K. W. (2016). Rutherford’s vascular surgery. Philadelphia, PA: Elsevier Saunders.
Feng, Z. G., Cortina, M., Chesnutt, J. K. W., & Han, H. C. (2017). Numerical simulation of thrombotic occlusion in tortuous arterioles.Journal of Cardiology and Cardiovascular Medicine, 2(1), 95-111.
Fulker, D., Sayed, Z., Simmons, A., & Barber, T. (2017). Computational fluid dynamic analysis of the hemodialysis plastic cannula. Artificial Organs, 41(11), 1035-1042. DOI: https://doi.org/10.1111/aor.12901
Govindarajan, V., Zhu, S., Li, R., Lu, Y., Diamond, S. L., Reifman, J., & Mitrophanov, A. Y. (2018). Impact of tissue factor localization on blood clot structure and resistance under venous shear. Biophysical Journal, 114(4), 978-999. DOI: https://doi.org/10.1016/j.bpj.2017.12.034
Gunawansa, N., Sudusinghe, D. H., & Wijayaratne, D. R.(2018). Hemodialysis catheter–related central vanous thrombosis: clinical approach to evaluation and management. Annals of Vascular Surgery, 51(1), 298-305. DOI: https://doi.org/10.1016/j.avsg.2018.02.033
Ivert, T., Dalén, M., Ander, C., Stålesen, R., Lordkipanidzé, M., & Hjemdahl, P. (2019). Increased platelet reactivity and platelet–leukocyte aggregation after elective coronary bypass surgery.Platelets, 30(8), 1-7. DOI: https://doi.org/10.1080/09537104.2018.1542122
Link, K. G., Stobb, M. T., Di Paola, J., Neeves, K. B., Fogelson, A. L., & Sindi, S. S. (2018). A local and global sensitivity analysis of a mathematical model of coagulation and platelet deposition under Increased platelet reactivity and platelet–leukocyte aggregation after elective coronary bypass surgery flow. PLoS One, 13(7), e0200917. DOI: https://doi.org/10.1371/journal.pone.0200917
Long, A. T., Kenne, E., Jung ,R., Fuchs, T. A., & Renné, T. (2016). Contact system revisited: an interface between inflammation, coagulation, and innate immunity. Journal of Thrombosis Haemostasis, 14(3), 427-437. DOI: https://doi.org/10.1111/jth.13235
Lu, Y., Lee, M. Y., Zhu, S., Sinno, T., & Diamond, S. L. (2017). Multiscale simulation of thrombus growth and vessel occlusion triggered by collagen/tissue factor using a data-driven model of combinatorial platelet signaling. Mathematical Medicine and Biology, 34(4), 523-46. DOI: https://doi.org/10.1093/imammb/dqw015
Lucas, T. C., Tessarolo, F., Jakitsch, V., Cola, I., Brunori, L., & Nollo, L. (2014). Blood flow in hemodialysis catheters: a numerical simulation and microscopic analysis of in vivo-formed fibrin. Artificial Organs, 38(7), 556-565. DOI: https://doi.org/10.1111/aor.12243
Mareels, G., Kaminsky, R., Eloot, S., & Verdonck, P. R. (2007). Particle image velocimetry-validated, computational fluid dynamics-based design to reduce shear stress and residence time in central venous hemodialysis catheters. Journal of American Society for Artificial Internal Organs, 53(4), 438-446. DOI: https://doi.org/10.1097/MAT.0b013e3180683b7c
Mukherjee, D., & Shadden, S. C. (2018). Modeling blood flow around a thrombus using a hybrid particle-continuum approach. Biomechanics and Modeling in Mechanobiology, 17(3),645-663. DOI: https://doi.org/10.0007/s10237-017-0983-6
Rojano, R. M., Mendez, S., & Nicoud, F. (2018). Introducing the pro-coagulant contact system in the numerical assessment of device-related thrombosis. Biomechanics and Modeling Mechanobiology, 17(3), 815-826. DOI: https://doi.org/10.1007/s10237-017-0994-3
Södergren, A. L., & Ramström, S. (2018). Platelets subpopulations remain despite strong dual agonist stimulation and can be characterized using a novel six-colour flow citometry protocol. Scientific Reports, 28(1), 1-12. DOI: https://doi.org/10.1038/s41598-017-19126-8
Taylor, J. O., Yang, L., Deutsch, S., & Manning, K. B. (2017). Development of a platelet adhesion transport equation for a computational thrombosis model. Journal of Biomechanics, 50(1), 114-120.
The American Society Engineering Standards [ASME]. (2009). Standard for verification and validation in computational fluid dynamics and heat transfer. Retrieved from https://www.asme.org/codes-standards/find-codes-standards/v-v-20-standard-verification-validation-computational-fluid-dynamics-heat-transfer
Unsworth, A. J., Kriek, N., Bye, A. P., Naran, K., Sage, T., Flora, G. D., & Gibbins, J. M. (2017). PPARc agonists negatively regulate aIIbb3 integrin outside-in signaling and platelet function through up-regulation of protein kinase activity. Journal of Thrombosis and Haemostasis, 15(2), 356-369. DOI: https://doi.org/10.1111/jth.13578
Wang, X. F., Zhang, B. H., Lu, X. Q., & Wang, P. (2018). Efficacy of different hemodialysis methods on dendritic cell marker marker CD40 and CD80 and platelet activation marker CD62P and P10 in patients with chronic renal failure, 33(3), e22713. DOI: https://doi.org/10.1002/jcla.22713
Wei, G., Luo, Q., Wang, X., Wu, X., Xu, M., Ding, N., ... Qiao, J.(2019). Increased GPIbα shedding from platelets treated with immune thrombocytopenia plasma. International Immunopharmacology, 66(1), 91-98. DOI: https://doi.org/10.1016/j.intimp.2018.11.011
Yazdani, A., Li, H., Humphrey, J. D., & Karniadakis, G. E. (2017). A general shear-dependent model for thrombus formation. PLoS Computational Biology, 13(1), e1005291. DOI: https://doi.org/10.1371/journal.pcbi.1005291
Yu, J. R., Wang, F. M., Xu, S. C., & Gao, M. (2018). CD62P and P10 as predictive markers for assessing the efficacy of hemodialysis in treating end-stage renal disease. Journal of Clinical Laboratory Analysis, 33(2), e22662. DOI: https://doi.org/10.1002/jcla.22662
Notas de autor
thabata.coaglio@edu.ufvjm.br