Construct and Concurrent Validity of two Scales Designed to Measure Reinforcement Sensitivity
Construct and Concurrent Validity of two Scales Designed to Measure Reinforcement Sensitivity
Revista Argentina de Ciencias del Comportamiento, vol. 15, núm. 1, pp. 93-106, 2023
Universidad Nacional de Córdoba
Recepción: 23 Marzo 2023
Aprobación: 05 Abril 2023
Abstract: Two studies assessed construct and concurrent validity of two scales designed to measure reinforcement sensitivity. Two non-probabilistic samples of college students from Mexico City were used. The first study showed that while the BIS/BAS (behavior inhibition and behavior activation scales) scales may possess construct validity, they lack in concurrent one; conversely, the SPSRQ (sensitivity to punishment and sensitivity to reinforcement questionnaire) did not show construct validity but showed evidence of concurrent one. Convergent validity was assessed using self-report questionnaires. The second study showed that the BAS scales may predict response distribution, in the IOWA-GT, in a way that is consistent with Reinforcement Sensitivity Theory (RST); this was not the case with the BIS scale. The results suggest that either the scales developed to assess RST, or the theory itself (or both) require a thorough revision.
Keywords: Reinforcement sensitivity theory, BIS, BAS scales, SPSRQ, validity, Mexican college students.
Resumen: Validez de constructo y concurrente de dos escalas diseñadas para medir sensibilidad al reforzador. Se presentan dos estudios para evaluar validez de constructo y concurrente de dos escalas diseñadas para medir sensibilidad al reforzador. Se emplearon dos muestras no probabilísticas de estudiantes de licenciatura mexicanos. El primer estudio, evaluó la validez de constructo y concurrente de las escalas EIC/EAC (escalas de inhibición y activación conductual) y CSCSR (cuestionario de sensibilidad al castigo y sensibilidad al reforzador). Los resultados mostraron que la primera escala posee validez de constructo, pero no validez concurrente; por su lado la CSCSR carece de validez de constructo, pero presenta validez concurrente. El segundo estudio evaluó la validez concurrente de las escalas EIC/EAC usando un programa de reforzamiento de elección. Los resultados mostraron que la escala EAC hace predicciones consistentes con la Teoría de la Sensibilidad al Reforzador; no así la escala EIC. Los resultados sugieren que las escalas, o la teoría que les dio sustento, requieren revisión de fondo.
Palabras clave: Teoría de la sensibilidad al reforzador, escalas EIC, EAC, escala CSCSR, validez, estudiantes universitarios mexicanos.
Introduction
Within the field of psychology, development of personality theories is, perhaps, one of the most prolific endeavors. Most theories, however, are developed by means of clinical experiences with human patients and intuition, rather than objective scientific evidence. One exception to this rule may be found in J.A. Gray’s “Reinforcement Sensitivity Theory” (Gray, 1976, 1982). The foundations of the theory can be found in randomized experiments, using non-human animals, in classical and operant conditioning preparations (specifically conditioned emotional suppression of instrumental behavior). Additionally, in Gray’s studies, behavioral findings are frequently correlated with brain chemistry and architecture (Bozarth, 1991; Gray, 1987; Smillie, 2008). Scientific research has validated some of these hypothesized correlations (Adrián-Ventura, Costumero, Parcet, & Ávila 2019; Corr & McNaughton, 2015; Hahn et al., 2010; Pickering & Gray, 1999; 2001). These features have made Gray’s theory attractive to scientists that favor an objective and evidence- based approach in the description and explanation of human behavior. Gray’s theory is, in some ways, similar to Eysenck’s 1957 Causal Systems Theory. In both theories, personality is accounted for in terms of a limited number of opposing behavioral taxonomies. Additionally, both theories are based on objective data (response frequency in Gray’s studies and statistical factor analysis in Eysenck’s case). In reinforcement sensitivity theory (RST), these dichotomies are a couple of integrated brain systems termed: a) Behavior Activation System (BAS) and b) Behavior Inhibition System (BIS). The neural bases of the BAS system are presumed to consist of the catecholaminergic, and especially dopaminergic pathways (Stellar, J. & Stellar, 1985). This system should allow the organism to identify cues associated with appetitive stimuli and to direct it towards them. Overall, the activation of the BAS system is associated with emotions of happiness, wellbeing, and elation. In a similar vein, the neural bases of the BIS system are located on the septo-hippocampal region of the brain; they also comprise the monoaminergic afferents from the brainstem (Gray, 1972; 1977). This system allows the organism to identify cues related with punishment, absence of reinforcement and novelty; it should also allow the organism to redirect its behavior (in order to avoid the painful results associated with these cues). The emotions associated with the activation of the BIS are fear, anxiety, frustration and sadness.
Since his early writings, Gray compared his findings to those of Eysenck (Gray 1970; 1972; 1975; 1976); by doing so, he was implicitly (and explicitly) suggesting that he regarded his results as general between human and non-human organisms. In fact, most of his later papers (Gray, 1982; Gray & McNaughton, 1996; 2000) were designed to assess the correlation between conditioning processes and two psychological constructs (anxiety and impulsivity). Once Gray and his colleagues empirically established that human behavior could be understood in terms of the BIS/BAS systems (see Pickering & Corr, 2008 for a review), research reoriented itself towards the development of strategies to measure the constructs. Self-report questionnaires have been the preferred choice (see for instance, Cloninger, 1987; MacAndrew & Steele, 1991; Torrubia & Tobena, 1984; Waller, Lilienfeld, Tellegen, & Lykken, 1991; Wilson, Gray, & Barret, 1990). Some scientists have argued that two self-report scales distance themselves from all others (see Cogswell, Alloy, van Dulmen, & Fresco, 2006 for a review): the BIS/BAS scales developed by Carver and White (1994) and the Sensitivity to Punishment, Sensitivity to Reinforcement Questionnaire (SPSRQ), designed by Torrubia, Ávila, Moltó, and Caseras (2001). This distancing is based principally on their psychometric properties and general agreement with the basic principles of RST (see Corr, 2016 for a review). Regarding the first scale, its original authors presented data suggesting adequate construct validity and internal consistency (these findings have been replicated by other scientists, see for instance, Heubeck, Wilkinson, & Cologon, 1998; Jorm et al., 1998; Leone, Perugini, Bagozzi, Pierro, & Mannetti, 2001; Ross, Millis, Bonebright, & Bailley, 2002). In their original study, Carver and White (1994) also presented data suggesting that the scales predict “fear” from cold water and “happiness” produced by obtaining extra university credits. Torrubia and colleges, on the basis that the BIS/BAS scales did not adequately represent Gray’s theory, designed the SPSRQ. There is less information regarding the psychometric properties of this latter scale. Some of the existing data suggest the SPSRQ may not possess construct validity and that some of its items may have weak factor loadings (Cogswell et al., 2006; O’Connor, Colder, & Hawk, 2004). However, a study by Barranco Jiménez, Rodarte Acosta, Medina Cuevas, and Solís-Cámara Reséndiz, (2009) suggests that this same questionnaire may possess construct, convergent and concurrent validity.
Despite their alleged shortcomings and limitations, both the BIS/BAS scales and the SPSRQ have been translated into different languages and employed in several countries (Caci, Deschaux, & Baylé, 2007; Franken, Muris, & Rassin, 2005; Müller & Wytykowska 2005). For instance, Pulido et al. (2016) assessed the construct validity and internal consistency of Spanish language BIS/BAS scales in undergraduate students from Mexico City. Exploratory factor analysis (EFA) showed that the items distributed themselves as hypothesized by Carver and White (1994); additionally, internal consistency exceeded .70 for all subscales. These findings were replicated by a second study conducted by Pulido, Rivera, Fondón and Vázquez (2016). Overall, data suggest that the BIS/BAS scales are valid and reliable in Mexican college students; however, to date the adaptation of self-report measures of the RST is still incomplete. One pending issue regards construct validity; specifically, the construct validity of the scales (in the Mexican population) may not be considered conclusive, as only EFA has been conducted on the data (Thompson, 1951). Additionally, the concurrent validity of the scales has not been determined. The purpose of the first study was to assess the construct validity of the BIS/BAS scales and the SPSRQ using confirmatory factor analysis (CFA). A second purpose of the first study was to assess concurrent validity of the previously mentioned questionnaires.
First Study
The first study attempted to assess construct and concurrent validity of the BIS/BAS scales and the SPSRQ. Regarding concurrent validity some scientists have suggested that the BIS/BAS constructs could probably be understood, respectively, as anxiety and impulsivity correlates (Dawe, Gullo, & Loxton, 2004; Franken et al., 2005; Gray, 1981; Pickering & Corr, 2008; Poythress et al., 2008). Thus, based on this hypothesis, concurrent validity of the BIS/BAS scales and the SPSRQ was assessed based on their correlation with impulsivity and anxiety scales. The specific hypotheses sustain that BAS should maintain a direct correlation with impulsivity, and BIS should maintain a direct correlation with anxiety.
Methods
Participants
A total of 1025 undergraduate students from different colleges in Mexico City participated in the study. The sample was predominantly female (59.2%) and mean age was established at 20.9 years with a SD of 2.5 years. Most students lived with their original families (82.5%). Only those students who freely answered the battery and signed the informed consent form, participated in the study.
Instruments
Participants received a battery conformed by: a) the informed consent form, b) demographic data questionnaire, c) BIS/BAS scales, d) SPSRQ, e) Barratt impulsivity scale and f) Beck Anxiety Inventory.
Carver and White’s (1994) BIS/BAS scales, translated and adapted to Spanish language by Pulido, Rivera et al. (2016) were used in the study. The scales consist of 20 statements that assess four different dimensions. The BIS dimension is composed of seven items that measure the sensitivity of the behavior inhibition system. These items quantify the individual’s perception about the effects that punishment, (or cues associates with punishment) have on an individual’s behavior; for instance, “I worry about making mistakes” The BAS dimension is divided into three different subsections. The BAS-Reward-Responsiveness scale (five items) measures the capacity to feel pleasure in anticipation (or presence) of a rewarding stimulus; for instance, “It would excite me to win a contest.” The BAS-Drive scale (four items) measures the capacity of the individual to persist in the pursuit of a rewarding stimulus; for instance, “I go out of my way to get things I want.” Finally, the BAS Fun Seeking scale (four items) refers to the frequency with which the individual looks for new sources of reinforcement; for instance, “I crave excitement and new sensations.” The scales use a four-point Likert scale that ranges from “strongly agree” to “strongly disagree”. Previous studies with the Mexican population have proved the scales to be reliable (internal consistency has ranged from .79 to .85) and have suggested that it may possess construct validity (Pulido, Hernández et al., 2016). The scales were translated to Spanish language using the translation-retranslation technique. So far, some research conducted in the Mexican population suggests that the scales adapt well to a four-factor model (Pulido, Rivera, et al., 2016). Other studies conducted in this same population have favored a two-factor solution (Barranco Jiménez et al., 2009). Some studies conducted in other countries have found that a five-factor model may best describe the scales structure (see for instance, Gray, Hanna, Gillen, & Rushe, 2016).
The Sensitivity to Punishment, Sensitivity to Reward Questionnaire (SPSRQ) was designed by Torrubia et al. (2001). It consists of 48 dichotomous (yes/no) items. Odd items measure sensitivity to reward; even items measure sensitivity to punishment. The present authors used the 2001 scale published by Torrubia and colleagues in English language and translated it to Spanish language using the translation-retranslation technique. The scale has shown acceptable test-retest reliability and internal consistency (ranging from .70 to .83); it has also produced data that suggest that its two factors are orthogonal. These findings have been replicated in the Mexican population by Barranco Jiménez et al. (2009).
The Beck Anxiety Inventory (BAI) is widely known and used within the behavioral sciences. Tafoya Ramos, Gómez Pérez Mitre, Ortega Soto, and Ortiz León (2006) developed a Spanish language version for Mexican college students. This test presents acceptable internal consistency (.86) and a high correlation with the Hamilton anxiety scale. It can also differentiate between students with (and without) anxiety diagnosis.
Patton, Stanford, and Barratt (1995) developed the Barratt Impulsivity Scale (BIS). The BIS consists of 30 items answered on a Likert type scale. It has been translated to Spanish language in both Chile (Salvo & Castro, 2013) and Argentina (Folino, Escobar Córdoba, & Castillo, 2006). In both countries it has shown acceptable internal consistency (ranging from .85 to .90) and predictive validity. In the present study, the English language version was translated into Spanish using the translation-retranslation technique. The authors proceeded with this translation, because the existing Spanish language version was found incomprehensible to our research group.
Procedure
The battery was applied in the student groups. The application was preceded by an explanation of the research objectives. The informed consent letter was read with the participants, and the questions were answered. The battery was presented in printed paper
Data Analysis
Data were analyzed, for both scales (BIS/BAS and SPSRQ), in two different stages. First an EFA, using the principal component method, was carried out a sample of 300 individuals. As in the BIS/BAS scales, a degree of correlation is assumed between the factors (see Carver & White, 1994), an oblique rotation (Promax) was used. As in the SPSRQ, the scales are assumed to be orthogonal (Torrubia et al., 2001), EFA was conducted using a Varimax rotation.
In the second stage, results from an independent sample of 725 individuals were analyzed using CFA. This second analysis allowed the testing of the three competing models previously described for the BIS/BAS scales (2, 4 or 5 correlated factors). A two-factor uncorrelated model was tested for the SPSRQ (because most studies suggest this may be its factorial structure, see Corr, 2016 for a review). For both scales, CFA was conducted using a Diagonally Weighted Least Squares Method (DWLS) because multivariate normality was not assumed.
Individual analysis of the test items for the BIS/BS scales showed that most items were either positively or negatively skewed. Multivariate normality was also assessed using the critical-ratio method (Bentler, 2005). Results were considerably superior to the established limits for normality (29.3 > 3.3). Another argument in favor of using the DWLS method with the BIS/BAS scales is that Likert type scales are considered as an ordinal measure (Flora & Curran, 2004). Data analysis used a polychoric correlation matrix, as the DWLS method with Likert type scales requires.
Individual analysis of the SPSRQ items also showed extreme positive or negative skewness; multivariate normality analysis showed a critical-ratio value way above 3.3. Both normality analyses and the fact that the questionnaire uses a dichotomous answer scale suggested that CFA should be conducted using DWLS (Flora & Curran, 2004). Data analysis used a tetrachoric matrix, as the DWLS method with dichotomous-answer variables requires.
Only complete questionnaires were captured, (the database had no missing data). Analyses were conducted using the “Libraria Lavaan module” for the R program (version 4.0.2). Model fit was determined using the root mean error of approximation (RMSEA, Steiger, 1990). RMSEA values of .05 or less are considered indicative of good fit. The comparative fit index (CFI, Bentler, 1990) was also used. CFI indexes above .95 are considered indicative of good fit). Other fit indexes, such as RMR, GFI and AGFI, were not reported, because they were redundant to CFI and RMSEA.
Results
Table1 shows the results for the EFA for the BIS/BAS scales.
| Factors | Eigen value | % Variance | %Cumulative variance |
| BIS | 4.62 | 23.12 | 23.12 |
| BAS/Responsivity | 3.98 | 19.19 | 43.02 |
| BAS/Drive | 1.63 | 8.17 | 51.19 |
| BAS/Fun seeking | 1.37 | 6.85 | 58.04 |
| KMO test = .84 Convergence in 5 iterations. | |||
| Bartlett test X2= 2024.68 (gl = 190), p < .001 Cronbach’s Alpha = .81 | |||
Table 1 shows that the BIS/BAS scales are composed by four correlated factors. These factors explain more than 58% of the variance and correspond to the four factors hypothesized by Carver and White (1994).
Table 2 shows the results of CFA testing three different models (two, four and five correlated factors). These specific models were chosen, as current research debates that the latent structure of the BIS/BAS scales to be one or the other (see Demianczyk, Jenkins, Henson, & Conner, 2014). As was previously mentioned in the method section research produced in Mexican samples has produced either a two-factor, or four-factor solution (Barranco Jiménez et al., 2009; Pulido, Rivera et al., 2016). Five-factor solutions have been found in samples from other countries (Gray et al., 2016).
| Factors | CFI | RMSEA |
| 2 | .91 | .07 |
| 4 | .97 | .04 |
| 5 | .97 | .04 |
In general, Table 2 shows that four and five factor models are associated with better fit indexes than the two-factor model. The finding is consistent across both the CFI and the RMSEA values. Additionally, both indexes suggest that four and five factor models are a good fit (.97 > .95 and .04 < .05).
Table 3 shows the results of an EFA, on the SPSRQ.
| Factors | Eigen Values | % Variance | %Cumulative variance |
| 1 | 2.8 | 5.9 | 5.9 |
| 2 | 2.7 | 5.6 | 11.5 |
| 3 | 2.2 | 4.5 | 16.0 |
| 4 | 2.1 | 4.4 | 20.4 |
| 5 | 2.1 | 4.3 | 24.8 |
| 6 | 2.0 | 4.1 | 28.3 |
| 7 | 1.9 | 3.8 | 32.8 |
| 8 | 1.8 | 3.8 | 36.6 |
| 9 | 1.7 | 3.5 | 40.1 |
| 10 | 1.5 | 3.1 | 43.2 |
| 11 | 1.5 | 3.0 | 46.2 |
| 12 | 1.4 | 3.0 | 49.2 |
| 13 | 1.4 | 2.9 | 52.1 |
| 14 | 1.4 | 2.8 | 54.9 |
| 15 | 1.3 | 2.7 | 57.6 |
| KMO Test = .769 Convergence in 22 iterations | |||
| Bartlet Test X2= 3001.9 (1128), p < .001 Cronbach’s Alpha = .814 | |||
Table 3 shows that the SPSRQ is composed of fifteen factors. These factors explain more than 57% of the variance and do not correspond to the two factors hypothesized by Torrubia et al. (2001).
Table 4 shows the results of confirmatory factor analysis testing a two-factor model.
| Factors | CFI | RMSEA |
| 2 | .802 | .04 |
In general, Table 4 shows that the two-factor hypothesis suggested by Torrubia et al. (2001) fit the data when the RMSEA is used (.04 < .05); however fit is poor when the data are analyzed by the CFI (.80 < .95).
Table 5 shows Pearson correlations between the SPSRQ, the BIS/BAS scales and impulsivity and anxiety.
| Scale | Impulsivity | Anxiety |
| SPSRQ (Reward) | r = .305, p < .001** | r = .093, p = .019* |
| SPSRQ (Punishment) | r =.026, p = .529 | r = .359, p < .001** |
| BIS/BAS (BIS) | r = .029, p = .470 | r = .334, p<.001** |
| BIS/BAS (BAS responsivity) | r =.049, p = .226 | r = .034, p < .388 |
| BIS/BAS (BAS drive) | r = .187, p < .001** | r = -.004, p = .925 |
| BIS/BAS (BAS fun seeking) | r =.337, p < .001** | r = .077, p = .049* |
Discussion
In general, both the exploratory and the confirmatory factor analyses suggest that the BIS/BAS scales possess construct validity and internal consistency; the SPSRQ shows only adequate internal consistency. Carver and White (1994) suggested that the BIS/BAS scales consisted of four correlated scales, latter revisions have suggested that a five-factor solution may possess a better fit. The results of the present study show that both a four and a five-factor solution are superior to a two-factor one (and almost indistinguishable between themselves). They also show that goodness of fit indexes (for the four and five-factor models) exceed the critical values established for psychometric research (Bentler, 1990). None of the above is true for the two-factor model proposed by Torrubia et al. (2001) in the SPSRQ. First, the EFA identifies fifteen different factors (instead of the hypothesized two factors). Additionally, fit indexes are at odds; while the RMSEA suggests a two-factor model is a good fit, the CFI points in a different direction. Overall, CFA suggests that the BIS/BAS scales may possess construct validity in a Mexican college student sample; the SPSRQ may not possess construct validity in this same sample.
Regarding concurrent validity the picture seems clear for the SPSRQ; sensitivity to punishment presents a positive and significant correlation with anxiety, and a low non-significant correlation with impulsivity. Sensitivity to reward shows a direct and significant correlation with impulsivity, and a comparatively lower, yet significant correlation with anxiety. Regarding the BIS/BAS scales, the BIS scale null correlation with impulsivity and direct and significant correlation with anxiety are in general agreement with its conceptualization by Carver and White (1994). Regarding the BAS scales, only BAS drive and BAS fun seeking comply with the hypothesis of a direct and significant correlation with impulsivity, and comparatively lower correlations with anxiety. The BAS responsiveness scale shows null correlations with both impulsivity and anxiety. The findings regarding the correlations between anxiety, punishment sensitivity and BIS are in general agreement with a Meta-Analysis conducted by Katz, Matanky, Aviram, and Yovel (2020); the results of the present study are also in agreement with Gray’s original conceptualization of the sensitivity to punishment construct. Regarding the correlation between impulsivity and reward sensitivity, the finding agrees with other studies (Potts, George, Martin, & Barratt, 2006; Mechelmans et al., 2017; Wilbertz et al., 2012); they also agree with Gray’s conception of the construct. Only the BAS drive and BAS fun seeking scales agree with Gray’s hypothesis relating impulsivity and reward sensitivity.
Second Study
For the second study, the present authors decided to proceed using only the BIS/BAS scales (as the first study showed they might possess construct validity, and three out of four scales showed evidence on the concurrent one). The second study further assessed the convergent validity of the previously mentioned scales. A review of the scientific literature on the subject showed that the IOWA Gambling Task (IGT, Bechara, Damasio, Damasio, & Anderson, 1994) could help accomplish this purpose. The scale may be conceived as a concurrent schedule; in this schedule, the subject may choose between four different options that differ in money that they may produce (or take away). Cards A and B are “risky options” in the sense that they produce more money; however, they also expose the subject to greater money loss risk. Cards C and D are considered “safe bets,” as they produce relatively lower amounts of money but also take away smaller amounts. The IGT has been used by other scientists to determine the convergent validity of the BIS/BAS scales (Franken et al., 2005; Suhr & Tsanadis, 2007; van Honk, Hermans, Putman, Montagne, & Schutter, 2002). Although they have produced mixed results, their findings suggest that high scorings on the BAS scales may be related to a greater frequency of risky card choosing. Thus, in this second study, we assessed the concurrent validity of the BIS/BAS scales by determining their ability to predict “risky” or “safe” card choosing in undergraduate students.
Method
Participants
Sampling proceeded in two discrete stages.
First sampling stage: A convenience sample of 200 undergraduate students answered the BIS/BAS scales. The sample was predominantly female 67% with an average age of 20.7 years and a SD of 1.9 years.
Second sampling stage: In a second sampling procedure the six highest and six lowest scorers in each scale were selected to play four consecutive IGT. The cut points that helped determine if individuals could be considered high (or low) scorers, were established calculating the total scores on each one of the BIS/BAS scales. Subsequent scores were rank-ordered, and the six higher (and lower) scores identified. High and low scorers were contacted and invited to participate in the IGT sessions.
In all sampling procedures participation was voluntary and the participants signed an informed consent form.
Instruments
Participants were asked to answer the BIS/BAS scales described in the previous study. They were also asked to give an email address; in case their participation was required in a second study. Subjects selected for the second study were asked to “play” the IGT in four consecutive occasions. The IGT was downloaded from a free online platform (Psytoolkit). It consisted of 100 independent choosing trials, where the individual must pick one of the four different cards discussed previously in the introduction. The program provided several dependent variables: a) reaction time, b) chosen card, and c) amount of money (gained or lost) by the individual. Previous studies have favored overall money (gained or lost) as a dependent variable; however, we used card selection frequency because it is the most common dependent variable in the concurrent schedules literature (Baum & Aparicio, 1999). In previous studies (Franken et al, 2005; Suhr & Tsanadis, 2007; van Honk et al. 2002), the IGT is presented once to the experimental subject. We chose to make four applications, because operant conditioning literature regarding concurrent reinforcement schedules has shown that stable behavior patterns do not occur instantly (Borrero et al., 2010). Additionally, Overman and Pierce (2013) have demonstrated that card choosing in the IGT only shows stability after 200 trials.
Procedure
The procedure was similar to that used in the first study. The only difference was that once the data from the BIS/BAS scales were analyzed, the six highest and lowest scorers on each scale were contacted to proceed with the IGT. The selected participants were invited to work in the university’s public study cubicles in the IGT (in a date and hour that was convenient to both parties).
Results
Figure one, shows card choosing frequency for each one of the four cards of the IGT. The six highest scorers on each scale are shown by grey bars; the lowest scorers are shown by black bars. A star identifies statistically significant differences, established by a chi square test (with p value equal or lower than .05).
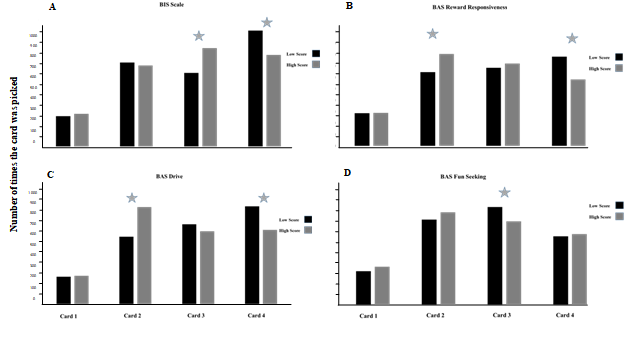
Figure 1.
Card choosing frequency, for low and high scorers, in the BIS/BAS scales.
★ p <.05
In general, graph A (BIS) shows that both high and low scorers avoid the first card (and distribute their cards more or less homogeneously amongst the other three cards). A Chi-Square test found statistical differences between low and high scorers in both cards three and four. Apparently, “high scorers” favor the former and “low scorers” favor the latter. Graph B (BAS Reward Responsiveness) shows significant differences by low and high scorers in both cards two and four. “High scorers” favor the former, while “low scorers” favor the latter. Graph C (BAS Drive) shows essentially the same as Graph B. Specifically, cards two and four show statistically significant differences between high and low scorers. “High scorers” choose card two with a higher frequency than “low scorers.” The opposite is true for card number four. Graph D (BAS Fun Seeking) shows only statistically significant differences in card three “low scorers” chose this card more frequently than high ones.
Discussion
In this study, the concurrent validity of the BIS/BAS scales was determined by the degree with which each scale made accurate predictions of card frequency choosing in the IGT. Based on this assumption, the BIS scale shows results that are mostly inconsistent with Gray’s conceptualization of RST. It was expected that a “high BIS score” would be associated with the selection of a safe card in a similar way, a “low BIS score” should be associated with the selection of risky cards. Results showed that card choosing by “low and high BIS scorers” was very similar to the risky cards; there were however statistical differences by both groups in the safe cards. “High scorers” preferred the third card (a result that is congruent with RST), and “low scorers” the fourth (a result that is not congruent with RST). Regarding the BAS scales, results are relatively congruent with the predictions of RST. For instance, with both the BAS Reward Responsiveness and the BAS Drive scales, high BAS scores were associated with significantly higher frequencies of “card two choosing” (a risky card). In contrast, low BAS scores were associated with significantly higher frequencies of a safe card (card four). Regarding BAS Fun Seeking, only card three (a safe card) showed statistically significant differences between groups. As expected, low BAS scores were associated with a “more frequent choosing” of card three (a finding that is in general agreement with the scale conceptualization by Carver & White, 1994). In summary results from the BAS scales are in general agreement with others relating these scales and the IGT; the BAS scales make predictions that support reinforcement RST, the BIS scale does not (Franken et al, 2005; Suhr & Tsanadis, 2007, van Honk et al., 2002). Thus, the results suggest that only the BAS scales possess convergent validity (when using card choosing in the IGT as criterion). Nevertheless, the results of the study also raise a number of puzzling issues. For instance, the consistent “infrequent choosing of card one” is perhaps the most powerful result of the study (and consistent with the findings of other scientists see Overman & Pierce, 2013; Steingroever, Wetzels, Horstmann, Neumann, & Wagenmakers, 2013). Additionally, it is not clear why low BAS scorers should prefer certain safe cards (for instance card four in the “BAS Drive” and “BAS Response Sensitiveness” low scorers) and not others. Equally perplexing is the fact that low scores in BAS Fun Seeking leads subjects to choose card three but not card four. Of course, the problems of the BIS scale to make predictions that are consistent with RST is equally puzzling.
General discussion
In general, the present studies suggest that two of the most conspicuous self-report measures designed to assess RST may be seriously flawed. The first study suggests that only the BIS/BAS scales may possess construct validity however these scales face problems regarding concurrent validity (in particular the BAS “responsivity” scale). In a similar way, the SPSRQ may possess concurrent validity; results, however, show no signs of construct validity. The second study shows that although the BAS scales make some predictions that are in general agreement with RST, the BIS scale makes predictions that are both congruent (high BIS scorers favor a safe card), and incongruent (low BIS scores favor a safe card) with RST.
Taken together, the results of the present study are in general agreement with a number of studies that have attempted to translate and adapt the BIS/BAS scales or the SPSRQ (or both) to different cultures and languages; the results of these studies have generally been disappointing. For instance, Heubeck et al., (1998) assessed construct and concurrent validity of the BIS/BAS scales in a sample of Australian college students. Although CFA suggested that the best model fit corresponded to four correlated factors, model fit was only “modest.” In a similar way, correlations with the Eysenck Personality Questionnaire (EPQ) failed to support Carver and White’s predictions (regarding the relation between the former and the BIS/BAS scales).
A previous attempt to adapt the BIS/BAS scales in the open Mexican population by Barranco Jiménez et al. (2009) was equally disappointing. Instead of a four-factor solution, EFA suggested a two-factor model was a better fit. Internal consistency and reliability of the BIS/BAS scales (in this same study) did not reach acceptable values (Cronbach’s alphas were always below .7, and sometimes below .6). Additionally, correlations with the EPQ were not always in agreement with Carver and White’s predictions. Moreira, Almeida, Pinto, Segarra, and Barbosa (2015) assessed the psychometric properties of the BIS/BAS scales in open the Portuguese population. Confirmatory factor analysis found a poor fit for two, four and five-factors models. Franken et al (2005) assessed the construct validity and reliability of the BIS/BAS scales in a sample of college students from the Netherlands. Although their results suggest that the four correlated factors model may be correct, BAS internal consistency was inadequate and correlations with the EPQ were not always consistent with Carver and White’s predictions. Demianczyk et al., (2014) found that even within the United States different models describe the BIS/BAS latent structure in different racial groups. In fact, they caution BIS/BAS scales’ potential users about the use of the scales in racially diverse samples. Baggio, Dupuis, Iglesias, and Daeppen (2015) assessed the factor structure of French and German language versions of the BIS/BAS scales in the Swiss population. None of the proposed factor structures for the BIS/BAS (2, 4 or 5 factors) met the minimum standards of model fit. Their data suggested that at least nine of the items had to be removed to achieve adequate model fit. The scientists concluded that the French and German versions of the BIS/BAS scales “should be avoided” in the Swiss population. In order to balance this discussion, it is necessary to acknowledge some success in the translation and adaptation of the scales. Leone et al., (2001) reported good psychometric properties with an Italian language version of the BIS/BAS scales. In a similar way, Müller & Wytykowska (2005) produced data that suggests that the Polish version of the scales may possess adequate psychometric properties.
Regarding the SPSRQ, our finding that a two-factor solution is inadequate to represent the latent structure of the questionnaire also replicates the findings of a number of studies. Dufey, Fernández, and Morgues (2011) adapted and assessed the SPSRQ in an undergraduate student sample from Chile. Although their results suggest that the instrument may be reliable and possess concurrent validity, both exploratory and confirmatory factor analysis showed that the two-factor solution is inadequate and that the scale probably divides into a much larger number of factors (exactly the same result obtained in the present study). In a similar way, Cogswell et al., (2006) adapted and assessed the SPSRQ in an undergraduate student sample from the US. Both exploratory and confirmatory factor analysis showed that a two-factor solution poorly fitted the data, (even when items with low factor loadings were trimmed). Problems with the construct validity of the SPSRQ have also been reported in the US by O’Connor et al., (2004) and in Romania by Sava and Sperneac (2006). However, some success in replicating the two-factor model has also been reported (e.g., Barranco Jiménez et al., 2009; Lardi, Billieux, d’Acremont, & Van der Linden, 2008)
Regarding the relationship between scores on the BIS/BAS scales and performance on the IGT, four different studies, suggest that there may be two distinct ways of predicting risky choosing in gambling tasks. van Honk et al. (2002) compared two clinical groups of psychopaths; those in the first group scored low on the BIS scale and high on the BAS scales; those in the second group scored high on the BIS and low on the BAS. Overall choosing of risky cards on the IGT was higher in the first group. These findings are in general agreement with those produced by Kim and Lee (2011) in non-clinical samples. Franken et al (2005) also used the BIS/BAS scales to predict overall performance in the IGT in college students. Their findings suggest that “to some extent,” risky decision making was predicted by the BAS scales (in particular by the Sensitivity to Reward scale). Suhr and Tsanadis (2007) reported similar findings in non-clinical samples. In their study, the BAS scales predicted risky choosing in the IGT (the fun seeking scale was a particularly good predictor). In general, the findings of our second study align well with the Franken et al and Suhr and Tsanadis studies. In all three experiments, BAS is a consistent predictor of IGT scores, and BIS makes non-significant or incongruent predictions. The present study has the added virtue of assessing choosing in a “card by card basis” (and of exposing the participants to 400 IGT trials). It is unclear why some studies should suggest that a combination of BIS and BAS predicts card choosing in the IGT, and others (including the present study) should point exclusively to the BAS. Perhaps these incongruences could be attributed to the different cut-points used in each study to determine high and low scorers (especially when comparing clinical and non-clinical samples); future research may help clear this issue.
Taken together, the results of the present studies suggest that the adaptation of the BIS/BAS scales and the SPSRQ to the Mexican population faces most of the challenges raised when these self-report measures have been adapted to other cultures and languages. Specifically, construct and concurrent validity are seriously compromised in one (or both) instruments. Perhaps it is time to develop a new instrument (or to correct the existing ones), and the present authors are not alone in these suggestions (see for instance, Corr, 2016; Corr & Cooper, 2016; Corr, & McNaughton, 2015; Demianczyk et al., 2014; Heym, Ferguson, & Lawrence, 2008; Maack & Ebesutani, 2018).
Acknowledgments
The authors wish to thank the Centro de Estudios Superiores Monte Fénix and the Universidad Anáhuac for their support. The authors are especially thankful for the support of Ricardo Rivas, Perla Vázquez, Ernesto Reyes, Diana Betancourt, Alejandro González, Abril Alfaro, Luis Dulché and Natalia Vázquez.
References
Adrián-Ventura, J., Costumero, V., Parcet, M.A. & Ávila, C. (2019). Linking personality and brain anatomy: a structural MRI approach to Reinforcement Sensitivity Theory. Social Cognitive and Affective Neuroscience,14(3), 329-338. doi: 10.1093/scan/nsz011.
Baggio S., Dupuis M., Iglesias K., & Daeppen J. B. (2015). Independent and combined associations of risky single-occasion drinking and drinking volume with alcohol use disorder: evidence from a sample of young Swiss men. Drug and Alcohol Dependence, 154, 260-263. doi: 10.1016/j.drugalcdep.2015.07.008
Barranco Jiménez, L., Rodarte Acosta, B., Medina Cuevas, Y. & Solís-Cámara Reséndiz, P. (2009). Evaluación psicométrica de los sistemas de activación e inhibición del comportamiento en adultos mexicanos. Anales de Psicología, 25(2), 358-367.
Baum, W. M., & Aparicio, C. F. (1999). Optimality and concurrent variable‐interval variable-ratio schedules. Journal of the Experimental Analysis of Behavior, 71(1), 75-89. doi: 10.1901/jeab.1999.71-75
Bechara, A., Damasio, A. R., Damasio, H. & Anderson, S. W. (1994). Insensitivity to future consequences following damage to human prefrontal cortex. Cognition, 50(1-3), 7-15. doi: 10.1016/0010-0277(94)90018-3
Bentler, P. M. (1990). Comparative fit indexes in structural models. Psychological Bulletin, 107(2), 238–246. doi: 10.1037/0033-2909.107.2.238
Bentler, P. M. (2005). EQS 6 structural equations program manual. Encino, CA: Multivariate Software.
Borrero, C. S., Vollmer, T. R., Borrero, J. C., Bourret, J. C., Sloman, K. N., Samaha, A. L., & Dallery, J. (2010). Concurrent Reinforcement Schedules for Problem Behavior and Appropriate Behavior: Experimental Applications of the Matching Law. Journal of the Experimental Analysis of Behavior, 93(3), 455–469. doi: 10.1901/jeab.2010.93-455
Bozarth, M. A. (1991). The mesolimbic dopamine system as a model reward system. In P. Willner, & J. Scheel-Krüger (Eds.), The mesolimbic dopamine system: From motivation to action (pp. 301–330). London: John Wiley & Sons.
Caci, H., Deschaux, O., & Baylé, F. J. (2007). Psychometric properties of the French versions of the BIS/BAS scales and the SPSRQ. Personality and Individual Differences, 42(6), 987-998. doi: 10.1016/j.paid.2006.09.008
Carver, S. C., & White, T. L. (1994). Behavioral inhibition, behavioral activation, and affective responses to impending reward and punishment: The BIS/BAS scales. Journal of Personality and Social Psychology, 67(2), 319-333. doi: 10.1037/0022-3514.67.2.319
Cloninger, C. R. (1987). A systematic method for clinical description and classification of personality variants. Archives of General Psychiatry, 44(6), 573-588. doi: 10.1001/archpsyc.1987.01800180093014
Cogswell, A., Alloy, L. B., van Dulmen, M. H. M., & Fresco, D. M. (2006). A psychometric evaluation of behavioral inhibition and approach self-report measures. Personality and Individual Differences, 40(8), 1649-1658. doi: 10.1016/j.paid.2005.12.008
Corr, P. J. (2016). Reinforcement Sensitivity Theory of Personality Questionnaires: Structural survey with recommendations. Personality and Individual Differences, 89, 60–64. doi: 10.1016/j.paid.2015.09.045
Corr, P. J., & Cooper, A. J. (2016). The Reinforcement Sensitivity Theory of Personality Questionnaire (RST-PQ): Development and validation. Psychological Assessment, 28(11), 1427–1440. doi: 10.1037/pas0000273
Corr, P. J. & McNaughton, N. (2015). Neural mechanisms of low trait anxiety and risk for externalizing behaviour. In T. Beauchaine & S. Hinshaw (eds.), Oxford Handbook of Externalizing Spectrum Disorders: A Developmental Psychopathology Perspective (pp. 220-238). Oxford: Oxford University Press
Dawe, S., Gullo, M. J., & Loxton, N.J. (2004). Reward drive and rash impulsiveness as dimensions of impulsivity: Implications for substance misuse. Addictive Behaviors, 29(7), 1389-1405. doi: 10.1016/j.addbeh.2004.06.004
Demianczyk, A. C., Jenkins, A. L., Henson, J. M., & Conner, B. T. (2014). Psychometric evaluation and revision of Carver and White’s BIS/BAS scales in a diverse sample of young adults. Journal of Personality Assessment, 96(5), 485-494. doi. 10.1080/00223891.2013.870570
Dufey, M., Fernández, A. M., & Morgues, C. (2011). Assessment of the behavioral –inhibition system and the behavioral approach system: Adaptation and validation of the Sensitivity to Punishment and Sensitivity to Reward Questionnaire (SPSRQ) in a Chilean sample. The Spanish Journal of Psychology, 14(1), 432–440. doi: 10.5209/revSJOP.2011.v14.n1.39
Eysenck, H.J. (1957). The dynamics of anxiety and hysteria. New York, Preger.
Flora, D. B., & Curran, P. J. (2004). An Empirical Evaluation of Alternative Methods of Estimation for Confirmatory Factor Analysis With Ordinal Data. Psychological Methods, 9(4), 466–491. doi: 10.1037/1082-989X.9.4.466
Folino, J. O., Escobar Córdoba, F., & Castillo, J.L. (2006). Exploración de la validez de la escala de impulsividad de Barratt (Bis-11) en la población carcelaria argentina. Revista Colombiana de Psiquiatría, 35(2), 132-148.
Franken, I. H. A., Muris, P., & Rassin, E. (2005). Psychometric properties of the Dutch BIS/BAS scales. Journal of Psychopathology and Behavioral Assessment, 27(1), 25-30. doi: 10.1007/s10862-005-3262-2
Gray, J. A. (1970). The psychophysiological basis of introversion-extraversion. Behavior Research and Therapy, 8(3), 249-266. doi: 10.1016/0005-7967(70)90069-0
Gray, J. A. (1972). The psychophysiological basis of introversion-extraversion: A modification of Eysenck’s theory. In V. D. Nebylitsyn & J. A. Gray (Eds.), The biological bases of individual behavior (pp. 182-205). San Diego, CA: Academic Press. doi: 10.1016/b978-0-12-515350-8.50017-x
Gray, J. A. (1975). Elements of a two-process theory of learning. London, Academic Press.
Gray, J. A. (1976). The behavioural inhibition system: A possible substrate for anxiety. In M. P. Feldman & A. M. Broadhurst (Eds.), Theoretical and Experimental Bases of Behaviour Modification. London: Wiley.
Gray, J. A. (1977). Drug effects on fear and frustration: Possible limbic site of action of minor tranquilizers. In L. L. Iversen, S. D. Iversen & S. H. Snyder (Eds.), Handbook of psychopharmacology (pp. 433-529). New York, Plenum.
Gray, J. A. (1981). A critique of Eysenck´s theory of personality. In H. J. Eysenck (Ed.), A model for personality (pp. 246-276). Berlin: Springer-Verlag. doi: 10.1017/s0141347300009599
Gray, J. A. (1982). The neuropsychology of anxiety: an enquiry into the functions of the septo- hippocampal system. Oxford, USA: Oxford University Press.
Gray, J. A. (1987). The psychology of fear and stress. London: Cambridge University Press.
Gray, J. A., & McNaughton, N. (1996). The neuropsychology of anxiety: Reprise. Nebraska Symposium on Motivation, 43, 61–134.
Gray, J. A., & McNaughton, N. (2000). The neuropsychology of anxiety: an enquiry into the functions of the septo-hippocampal system (2nd.ed.). New York, NY: Oxford University Press.
Gray, J. D., Hanna, D., Gillen, A., & Rushe, T. (2016). A closer look at Carver and White's BIS/BAS scales: Factor analysis and age group differences. Personality and Individual Differences, 95, 20–24. doi: 101.1016/j.paid.2016.02.022
Hahn, T., Dresler, T., Plichta, M. M., Ehlis, A.C., Ernst, L. H., Markulin, F., … Fallgatter A. J. (2010). Functional amygdala-hippocampus connectivity during anticipation of aversive events is associated with Gray's trait "sensitivity to punishment". Biological Psychiatry, 68(5), 459-464. doi: 10.1016/j.biopsych.2010.04.033.
Heubeck, B. G., Wilkinson, R. B., & Cologon, J. (1998). A second look at Carver and White’s (1994) BIS/BAS scales. Personality and Individual Differences, 25(4), 785-800. doi: 10.1016/S0191-8869(98)00124-X
Heym, N., Ferguson, E., & Lawrence, C. (2008). An evaluation of the relationship between Gray’s revised RST and Eysenck’s PEN: distinguishing BIS and FFFS in Carver and White’s BIS/BAS scales. Personality and Individual Differences, 45(8), 709-715. doi: 10.1016/j.paid.2008.07.013
Jorm, A. F., Christensen, H., Henderson, A. S., Jacomb, P. A., Korten, A. E., & Rodgers, B. (1998). Using the BIS/BAS Scales to measure behavioural inhibition and behavioural activation: factor structure, validity and norms in a large community sample. Personality and Individual Differences, 26(1), 49-58. doi: 10.1016/S0191-8869(98)00143-3
Kim, D. Y., & Lee, J. H. (2011). Effects of the BAS and BIS on decision-making in a gambling task. Personality and Individual Differences, 50(7), 1131–1135. doi: 10.1016/j.paid.2011.01.041
Lardi, C., Billieux, J., d'Acremont, M., & Van der Linden, M. (2008). A French adaptation of a short version of the Sensitivity to Punishment and Sensitivity to Reward Questionnaire (SPSRQ). Personality and Individual Differences, 45(8), 722-725. doi: 10.1016/j.paid.2008.07.019
Leone, L., Perugini, M., Bagozzi, R. P., Pierro, A., & Mannetti, L. (2001). Construct validity and generalizability of the Carver-White behavioural inhibition system/behavioural activation system scales. European Journal of Personality, 15(5), 373-390. doi: 10.1002/per.415
Katz, B. A., Matanky, K., Aviram, G., & Yovel, I. (2020). Reinforcement sensitivity, depression and anxiety: A meta-analysis and meta-analytic structural equation model. Clinical Psychology Review, 77, 101842. doi: 10.1016/j.cpr.2020.101842.
Maack, D. J., & Ebesutani, C. (2018). A re-examination of the BIS/BAS scales: Evidence for BIS and BAS as unidimensional scales. International Journal of Methods in Psychiatric Research, 27(2), e1612. doi: 10.1002/mpr.1612
MacAndrew, C., & Steele, T. (1991). Gray’s behavioral inhibition system: A psychometric evaluation. Personality and Individual Differences, 12(2), 157-171. doi: 10.1016/0191-8869(91)90099-W
Mechelmans, D. J., Strelchuk, D., Doñamayor, N., Banca, P., Robbins, T. W., Baek, K., & Voon, V. (2017). Reward Sensitivity and Waiting Impulsivity: Shift towards Reward Valuation away from Action Control. International Journal of Neuropsychopharmacolgy, 20(12), 971-978. doi: 10.1093/ijnp/pyx072.
Moreira, D., Almeida, F., Pinto, M., Segarra, P., & Barbosa, F. (2015). Data concerning the psychometric properties of the behavioral inhibition/behavior activation scales for the Portuguese population. Psychological Assessment, 27(3), 1117-1122. doi. 10.1037/pas0000108
Müller, J. M., & Wytykowska, A. M. (2005). Psychometric properties and validation of a Polish adaptation of Carver and White’s BIS/BAS scales. Personality and Individual Differences, 39(4), 795-805. doi. 10.1016/j.paid.2005.03.006
O’Connor, R. M., Colder, C. R., & Hawk, L. W. (2004). Confirmatory factor analysis of the Sensitivity to Punishment and Sensitivity to Reward Questionnaire. Personality and Individual Differences, 37(5), 985-1002. doi: 10.1016/j.paid.2003.11.008
Overman, W. H., & Pierce, A. (2013). Iowa Gambling Task with non-clinical participants: effects of using real + virtual cards and additional trials. Frontiers in Psychology, 4, 935. doi: 10.3389/fpsyg.2013.00935
Patton, J. H., Stanford, M. S., & Barratt, E. S. (1995). Factor structure of the Barratt impulsiveness scale. Journal of Clinical Psychology, 51(6), 768-774. doi: 10.1002/1097-679(199511)51:63.0.CO;2-1
Pickering, A., & Corr, P. (2008). J. A. Gray’s reinforcement sensitivity theory (RST) of personality. In: G. Boyle, G. Matthews & D. Saklofske, (Eds.), The SAGE Handbook of Personality: Theory and Assessment Personality Measurement and Testing (pp. 239-255). London, New Delhi and Thousand Oaks: Sage.
Pickering, A., & Gray, J. A. (1999). The neuroscience of personality. In L. A. Pervin & O. P. John (Eds.), Handbook of personality: Theory and research (pp. 277–299). Nueva York: Guilford Press.
Pickering, A., & Gray, J. A. (2001). Dopamine, appetitive reinforcement, and the neuropsychology of human learning: An individual differences approach. In A. Eliasz & A. Angleitner (Eds), Advances in Research on Temperament (pp. 113-149). Germany: PABST Science Publishers Lengerich.
Potts, G. F., George, M. R., Martin, L. E., & Barratt E. S. (2006). Reduced punishment sensitivity in neural systems of behavior monitoring in impulsive individuals. Neuroscience Letters, 397(1-2), 130-134. doi: 10.1016/j.neulet.2005.12.003.
Poythress, N. G., Edens, J. F., Landfield, K., Lilienfeld, S. O., Skeem, J. L., & Douglas K. S. (2008). A critique of behavioral inhibition scale (BIS) for investigating theory of primary psychopathy. Personality and Individual Differences, 45(4), 269–275. doi: 10.1016/jpaid.2008.04.014
Pulido, M., Rivera, L., Fondón, A., & Vázquez, P. (2016). Propiedades psicométricas de la Escala BIS/BAS en una muestra de estudiantes universitarios mexicanos. Enseñanza e Investigación en Psicología, 21(3), 300-310.
Pulido, M., Hernández, A. M., Irecta, C., Reynoso, M., Silos, M. J., Valdés, D., Valenzuela, M., Valdez, D. & Rivera, L. (2016). Comorbilidad entre alcohol, tabaco y adicción a las nuevas tecnologías de la información: Evaluación del modelo BIS/BAS. Revista Mexicana de Investigación en Psicología, 8(1), 19-35.
Ross, S. R., Millis, S. R., Bonebright, T. L., & Bailley, S. E. (2002). Confirmatory factor analysis of the behavioral inhibition and activation scales. Personality and Individual Differences, 33(6), 861-865. doi: 10.1016/S0191-8869(01)00196-9
Salvo, G.L. & Castro, S.A. (2013). Confiabilidad y validez de la escala de impulsividad de Barratt (Bis-11) en adolescentes. Revista Chilena de Neuropsiquiatría, 51(4), 245-254. doi: 10.4067/S0717-92272013000400003.
Sava, F. & Sperneac, A-M. (2006). Sensitivity to Reward and Sensitivity to Punishment rating scales: a validation study on the Romanian population. Personality and Individual Differences, 41(8), 1445-1456. doi: 10.1016/j.paid.2006.04.024
Smillie, L. D. (2008). What is reinforcement sensitivity? Neuroscience paradigms for approach-avoidance process theories of personality. European Journal of Personality, 22(5), 359–384. doi: 10.1002/per.674
Steiger, J. H. (1990). Structural Model Evaluation and Modification: An Interval Estimation Approach. Multivariate Behavioral Research, 25(2), 173-180. doi: 10.1207/s15327906mbr2502_4
Steingroever, H., Wetzels, R., Horstmann, A., Neumann, J., & Wagenmakers, E. J. (2013). Performance of healthy participants on the Iowa Gambling Task. Psychological Assessment, 25(1), 180-193. doi: 10.1037/a0029929
Stellar, J. R. & Stellar, E. (1985). The neurobiology of motivation and reward. New York: Springer-Verlag.
Suhr, J., & Tsanadis, J. (2007). Affect and Personality Correlates of the Iowa Gambling Task. Personality and Individual Differences, 43(1), 27-36. doi: 10.1016/j.paid.2006.11.004
Tafoya Ramos, R., Gómez Pérez Mitre, P., Ortega Soto, S., & Ortiz León, S. (2006). Inventario de Ansiedad de Beck: Validez y confiabilidad en estudiantes que solicitan atención psiquiátrica en la UNAM. Psiquis, 15(3), 82-87.
Thompson, G. H. (1951) The factorial analysis of human ability. London: University of London Press.
Torrubia, R., Ávila, C., Moltó, J., & Caseras, X. (2001). The Sensitivity to Punishment and Sensitivity to Reward Questionnaire (SPSRQ) as a measure of Gray’s anxiety and impulsive dimensions. Personality and Individual Differences, 31(6), 837-862. doi: 10.1016/S0191-8869(00)00183-5
Torrubia, R., & Tobena, A. (1984). A scale for the assessment of ´susceptibility to punishment´ as a measure of anxiety: Preliminary results. Personality and Individual Differences, 5(3), 371-375. doi: 10.1016/0191-8869(84)90078-3
van Honk, J., Hermans, E. J., Putman, P., Montagne, B., & Schutter, D. J. (2002). Defective somatic markers in sub-clinical psychopathy. Neuroscience Research, 13(8), 1025-1027. doi: 10.1097/00001756-200206120-00009
Waller, N.G., Lilienfeld, S.O. Tellegen, A. & Lykken, D.T. (1991). The Tridimensional Personality Questionnaire: Structural validity and comparisons with the Multidimensional Personality Questionnaire. Multivariate Behavioral Research, 26(1), 1-23. doi: 10.1207/s15327906mbr2601_1
Wilbertz, G., van Elst L. T., Delgado, M. R., Maier, S., Feige, B., Philipsen, A., & Blechert, J. (2012). Orbitofrontal reward sensitivity and impulsivity in adult attention deficit hyperactivity disorder. Neuroimage, 60(1), 353-361. doi: 10.1016/j.neuroimage.2011.12.011
Wilson, G. D., Gray, J. A., & Barrett, P. T. (1990). A factor analysis of the Gray-Wilson personality questionnaire. Personality and Individual Differences, 11(10), 1037-1045. doi: 10.1016/0191-8869(90)90131-A
Notas de autor
Enviar correspondencia a: Pulido, M E-mail: mpulidor100@gmail.com
Enlace alternativo
https://revistas.unc.edu.ar/index.php/racc/article/view/30901/41154 (pdf)