Investigación
Urban Wind Energy Assessment Using Machine Learning and Multi-criteria Analysis
Evaluación del potencial eólico urbano mediante aprendizaje automático y análisis multicriterio
 Gianina Garrido-Silva gianinagarrido@usta.edu.co
María Paula Cajamarca-García maria.cajamarca@usantotomas.edu.co
Carlos Andrés Torres-Pinzón carlostorresp@usta.edu.co
Gianina Garrido-Silva gianinagarrido@usta.edu.co
María Paula Cajamarca-García maria.cajamarca@usantotomas.edu.co
Carlos Andrés Torres-Pinzón carlostorresp@usta.edu.co
Urban Wind Energy Assessment Using Machine Learning and Multi-criteria Analysis
TecnoLógicas, vol. 28, núm. 63, pp. 1-16, 2025
Instituto Tecnológico Metropolitano

Esta obra está bajo una Licencia Creative Commons Atribución-NoComercial-CompartirIgual 4.0 Internacional.
Recepción: 25 Septiembre 2024
Aprobación: 29 Mayo 2025
Publicación: 30 Junio 2025
Abstract: The transition toward renewable energy sources in urban environments presents technical and strategic challenges due to the variability of available resources and the inherent constraints of built-up spaces. This study assessed the potential for wind energy generation in Bogotá, D.C., Colombia, applying data science techniques and machine learning models. Clustering analysis, the Analytic Hierarchy Process (AHP), and Weibull distribution modeling used historical meteorological data on wind speed and temperature. The unsupervised analysis identified three representative hourly wind patterns, while the Weibull distribution estimated an operational wind speed of 2.2 m/s. The AHP method facilitated the selection of wind turbines based on technical criteria such as cut-in speed, rated power, and blade number. Among the key results, the 300 X-300 turbine achieved a Capacity Factor (CF) of 25.43%, a Yield Ratio (Yr) of 0.1352 h, and a Performance Ratio (PR) of 43.49%. These indicators reveal that, despite the moderate wind potential during specific periods, the low energy density and high variability limit the technical feasibility of wind systems in the study area. It is concluded that integrating data analysis tools with multi-criteria decision-making methods provides a robust framework for assessing urban wind resources and establishes a solid foundation for the tailored design of sustainable energy solutions.
Keywords: Clustering analysis, machine learning, wind energy, data preprocessing, system performance, hierarchical systems.
Resumen: La transición hacia fuentes de energía renovable en entornos urbanos representa un desafío técnico y estratégico, debido a la variabilidad de los recursos disponibles y a las restricciones propias de los espacios construidos. Esta investigación evaluó el potencial de generación de energía eólica en Bogotá D.C., Colombia, mediante la aplicación de técnicas de ciencia de datos y modelos de aprendizaje automático. Se empleó un análisis de clustering, el Proceso de Jerarquía Analítica (AHP, por sus siglas en inglés) y un análisis de distribución de Weibull, utilizando datos meteorológicos históricos de velocidad del viento y temperatura. Este análisis no supervisado permitió identificar tres patrones horarios representativos del comportamiento eólico, mientras que la distribución de Weibull estimó una velocidad de operación de 2.2 m/s. El método AHP facilitó la selección de turbinas eólicas con base en criterios técnicos como velocidad de arranque, potencia nominal y número de palas. Entre los resultados más relevantes, la turbina 300 X- 300 alcanzó un factor de capacidad de 25.43 %, una relación de producción (Yr) de 0.1352 h y un índice de desempeño del 43.49 %. Estos índices revelaron que, aunque existen periodos con potencial eólico moderado, la baja densidad energética y la alta variabilidad limitan la viabilidad técnica de estos sistemas en el área objeto de estudio. Se concluye que la integración de herramientas de análisis de datos con métodos de decisión multicriterio permite una evaluación robusta del recurso eólico urbano, y ofrece una base sólida para el diseño de soluciones energéticas sostenibles hechas a la medida.
Palabras clave: Análisis de clustering, aprendizaje automático, energía eólica, preprocesamiento de datos, rendimiento del sistema, sistemas jerárquicos.
Highlights
-
Characterizing the potential of urban wind energy requires quantifying its uncertainty.
The elbow method revealed three relevant hourly groups in the potential for wind energy.
The Weibull analysis determines whether the wind speed exceeds the minimum operating threshold.
The AHP method evaluates the cut-in speed, the rated power, and the number of blades.
Performance metrics determine technical feasibility in urban environments.
Highlights
-
La caracterización del potencial energético eólico urbano exige cuantificar su incertidumbre.
El método del codo reveló tres grupos horarios relevantes en el potencial energético del viento.
El análisis Weibull determina si el viento supera la velocidad mínima de operación.
El método AHP evalúa velocidad de arranque, potencia nominal y cantidad de palas.
Las métricas de desempeño determinan la factibilidad técnica en entornos urbanos.
1. INTRODUCTION
Conventional energy resources like coal and oil pose significant challenges, including volatile market prices, resource depletion, and detrimental environmental impacts caused by greenhouse gas emissions. A sustainable energy system prioritizes affordability, reliability, and minimal carbon footprint [1]. At the same time, wind energy offers a sustainable solution, but technical limitations impact the performance of the generator and, subsequently, the power grids. In other words, the increase in wind energy use can affect grid stability, which requires a balance between maximizing power integration and maintaining grid integrity [2]. These requirements need to consider the energy yields and resource variability estimation. Capacity factors, production yield, and performance ratio are metrics that allow the design of efficient hybrid systems, offering custom-made energy solutions [3], [4].
Turbulence is a drawback for small wind turbine designs in the urban context. For this reason, realistic models based on in situ meteorological data allow the characterization of wind speed using a Weibull distribution study. This method computes accurate urban wind turbine performance [5].
Brazil has significantly increased its investment in wind energy, with production growing from 0.9% to 7.6% in 2012 and 2018, respectively [6]. Wind energy projects are attractive due to their non-emissions operation, and they need the estimation of available local resources for suitable planning. Nevertheless, the urban environment has turbulent wind flows due to morphology and surface roughness. There are research works such as [7] that used computational models to simulate fluid dynamics; small wind turbines, including Vertical-Axis Wind Turbines (VAWTs), considering restrictions such as lower wind speeds and different blade sizes, resulting in lower energy solutions with higher operational risks [8].
The uncertainties in wind resources have caused several changes in energy prediction and wind turbine performance. However, computational fluid dynamics (CFD) and optimization techniques have improved these applications [9]. On the other hand, there are research works where the blade design and the advanced control systems, based on fuzzy logic and artificial intelligence, have improved the turbine efficiency and system reliability [10].
On the other hand, works such as [11] propose a data-driven methodology to evaluate solar-wind hybrid energy systems by computing key performance metrics such as Capacity Factor (CF) and Performance Ratio (PR). In this research, the authors use the k-means clustering algorithm to analyze renewable energy potentials, considering the features time, solar radiation, cubed wind speed, and temperature, which have been collected from a local weather station at Universidad de la Salle in Bogotá, Colombia. Finally, this method incorporates clustering-based assessments to identify suitable sites for solar photovoltaic (PV) power plants, offering insights into energy solutions in developing regions.
One promising approach combines traditional methods, such as the Analytical Hierarchy Process (AHP), with machine learning. This mixture allows a subjective balance between wind resource estimation and economic constraints. In other words, AHP allows the structure of decision-making processes, while machine learning uses historical data to predict the energy potential more accurately. This multicriteria methodology helps to optimize turbine performance [12].
The main contribution of this research work is the combination of clustering analysis, the Analytical Hierarchy Process (AHP), and Weibull distribution to estimate wind energy resources from historical meteorological data in Colombian urban environments. This methodology maximizes the available wind resources, improving grid resilience. It also evaluates suitable wind turbines for specific energy solutions using performance metrics, such as capacity factor, production yield, and performance ratio. These metrics allow evaluation of the technical feasibility of the selected wind system.
This paper is organized as follows: First, the materials and Methods section describes the case study, data acquisition process, and the methodology employed, including data preprocessing, statistical analysis, clustering, wind energy modeling, and performance metrics. Then, the Results and Discussion section shows the primary outcomes, including clustering analysis, Weibull distribution parameters, AHP-based turbine selection, and performance indexes. Next, a critical discussion is presented in the following stage, contrasting the obtained results from other authors. Finally, the last section summarizes the main insights derived from the study.
2. MATERIALS AND METHODS
2.1 Case study
The dataset was obtained from the Institute of Hydrology, Meteorology, and Environmental Studies (IDEAM). The meteorological station corresponds to El Dorado-CATAM, located in the Bogotá savanna, 12 kilometers west of the center of the Colombian capital, so its geographic coordinates are 4°42'05.77” North latitude and 74° 08'49.04” West longitude, located at 2547.49 meters above sea level. We formally requested from IDEAM the provision of data about the following meteorological parameters: wind speed (WS) in m/s, time (t) in h and temperature (T) in °C, over a time spanning 01/01/2022 to 18/10/2022, with a data sampling frequency of 10 minutes. Accordingly, the complete dataset encompasses 35094 samples across the required variables. This data will be used in further analyses and investigations on the potential for a future wind energy design to advance sustainable and innovative solutions for energy production and know growing energy needs.
The dataset structure from Table 1 details the meteorological conditions over approximately 24 hours, sampled every 10 minutes. It includes wind speed, temperature, wind direction, and time, which are necessary for assessing the wind energy systems implementation. Wind speed and direction data offer insights into the wind potential of the region, essential for turbine design and energy yield estimation. Temperature data informs how fluctuations might affect turbine efficiency. Overall, this dataset is foundational for stablishing the technical feasibility of wind energy implementation in Bogotá.
| Time stamp | h | Min | y | d | month | WS in m/s | T in °C |
| 1/1/22 0:00 | 0 | 0 | 2022 | 1 | 1 | 0.9 | 13.7 |
| 1/1/22 0:10 | 0 | 10 | 2022 | 1 | 1 | 1.0 | 13.4 |
| 1/1/22 0:20 | 0 | 20 | 2022 | 1 | 1 | 1.0 | 13.3 |
| 1/1/22 0:30 | 0 | 30 | 2022 | 1 | 1 | 0.8 | 13.2 |
| 1/1/22 0:40 | 0 | 40 | 2022 | 1 | 1 | 1.2 | 13.4 |
| 1/1/22 0:50 | 0 | 50 | 2022 | 1 | 1 | 1.6 | 13.1 |
2.2 Data preprocessing
Data normalization is a key preprocessing technique that improves the accuracy and effectiveness of machine learning algorithms. By scaling or transforming data, normalization ensures that each feature contributes equally to the analysis. The transformation from (1) enhances algorithm performance and ensures reliable insights [13].
 (1)
(1)Where X, Xmin, and Xmax correspond to the i-th feature in real units, its minimum and maximum values, respectively.
It is important to remark that the dataset has a standard preprocessing stage, which includes the MinMax transformation from (1)to ensure data consistency before the analysis [4]. On the other hand, no outlier values were considered because we assumed that they exhibit real environmental conditions.
Data preparation is needed before the clustering algorithm stage because this includes scaling numeric data, encoding categorical data, and selecting relevant features. The clustering stage aims to create a consistent, structured, standardized dataset for subsequent analysis [11].
2.3 Statistical analysis
This stage considers calculating basic statistical properties of the data and visualizing relationships between features, which can allow identifying patterns in the data and selecting the most relevant features for clustering. One of the commonly used features for wind energy production potential is the average wind speed Vavg[14], and it can be determined as shown in (2).
 (2)
(2)Where N and Vi are the sample size and the wind speed at the ith sample, respectively. The variance σ2 for wind speed records can be calculated as follows in (3).
 (3)
(3)2.4 Unsupervised learning algorithm
This subsection explains how to implement the k-means algorithm and shows how to evaluate its performance using validation indexes also.
2.4.1 K-means algorithm
The k-means clustering algorithm grouped elements based on their similarities, using the mean value of these elements in each cluster. Although selecting the optimal number of clusters implies a drawback, it helps with accurate analysis and interpretability. This method has the scalability property in large datasets [15].
2.4.2 Validation indexes
The elbow method, a validation index, determines the optimal number of clusters and needs a graphical interpretation [16]. It works by computing the squared distance between the centroid of each cluster and the samples that belong to that cluster. The performance metric in (4) corresponds to the sum of squared errors (SSE).
 (4)
(4)Where Xi, and Ck correspond to the data in each group and the centroid, respectively. The optimal value of K is identified where the SSE value drops abruptly, obtaining an “elbow” on the curve. This method uses inertia values from the k-means algorithm applied to the clusters, considering the inertia as the sum of squared distances of each object to its centroid. A sudden change in inertia indicates the optimal number of clusters. The distortion-based elbow method, using the Euclidean distance metric to find average squared distances to centroids, helps select the optimal clustering algorithm for a dataset through external validation techniques [17].
2.5 Wind power density (WPD)
The wind power P in W flowing at a wind speed v in m/s through a swept area of the blade Aw in m2, considering the air density ρ in Kg/m3, can be expressed by (5).
 (5)
(5)While the efficiency of the wind itself plays an important role, there is an inherent limit to how much energy a turbine can capture from it. This limit is known as the Betz (represented by Cp), a ceiling on efficiency, with 59.3% being the theoretical maximum [18]. The previous (5) can be modified into (6).
 (6)
(6)Wind power expressed in terms of area, independent of the area of the wind turbine, is known as the Wind Power Density (WPD), as shown in (7) This density is an indicator that shows the potential of wind resources in a specific location [19].
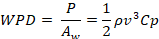 (7)
(7)2.6 Available wind energy
Air density can be determined indirectly by knowing parameters such as temperature and altitude above sea level [20], as shown in (8).
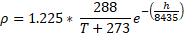 (8)
(8)The wind power density is a fundamental parameter for obtaining wind potential and showing the amount of wind energy at different wind speeds at a particular location, over a time interval t2-t1. Wind energy density allows the evaluation of the suitable wind turbine for a specific location [21]. Wind power is defined by (9).
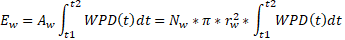 (9)
(9)Where rw, Nw, and Aw corresponds to the blade radius, the number of wind turbines, and the area swept by the blades, respectively.
2.7 Capacity factor (CF)
This metric is defined as the ratio between the energy supplied (Ew) and the nominal peak energy in each period (ENw), as shown in (10) The feasible range of values for the capacity factor falls between 25% and 45% [22].
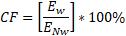 (10)
(10)2.8 Performance yields (Yr)
This index is related to the total energy density Ht, according to (9) and the power density G0. The expression is given in (11) and (12) [23].
 (11)
(11)
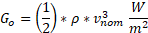 (12)
(12)Where, vnom corresponds to the nominal speed of the wind turbine.
2.9 Performance ratio (PR)
The performance ratio is a dimensionless relation between the actual performance Yf and the reference YR, as shown in (13) While the performance coefficient is closer to 100%, the system will work most effectively. However, the range from 60% and 80% demonstrates that the solution is realistic [24].
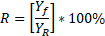 (13)
(13)2.10 Weibull probability density function (PDF)
The PDF indicates the fraction of time during which an observed wind speed possibly prevails in the study region. The Weibull PDF of wind speed can be shown in (14):
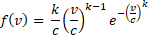 (14)
(14)Where c and k correspond to scale and shape parameters, respectively. We can compute the percentage of time the wind speed is between an operational range of the wind turbine, providing valuable insights into its potential profitability [25], [26]. Therefore, it can be expressed in (15):
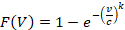 (15)
(15)Estimating the distribution parameters is relevant for obtaining a realistic wind energy potential [27]. For this reason, a linearized Weibull transformation has been applied; using the least squares method, we find the slope and intercept, and they are related to the original PDF parameters [18].
2.11 Analytical hierarchy process (AHP)
The Analytic Hierarchy Process (AHP) allows a suitable decision-making process. A decision tree hierarchy is used to organize the decision-making process, which consists of four levels: goals, criteria, sub-criteria, and possibilities, creating a hierarchical framework. AHP employs a comprehensive nine-point scale to express personal preferences or judgments and facilitate pairwise comparisons. According to Satty, the fundamental scale is outlined in Table 2[28].
| Importance | Definition | Explanation |
| Low (1) | Equivalent | The activities possess equal importance in accomplishing the desired outcome. |
| Medium (3) | Moderately important | Based on experience and judgment, one activity holds a marginal advantage. |
| High (5) | Essential or strongly important | A clear preference for one activity exists based on robust evidence from experience and judgment. |
| Very High (7) | Very strong importance | Overwhelming evidence favors one activity, which has demonstrably superior performance in practice. |
| Extreme (9) | Extreme importance | A preponderance of evidence decisively favors one activity, demonstrably outperforming the other in practical application. |
| 2,4,6,8 | Intermediate values | When a middle ground or balance is necessary. |
The sequential process involved in AHP is as follows [29]:
-
· Summing up: First, we add the values in each column of the comparison matrix. These values help us understand the overall importance assigned to each criterion.
· Normalization: Next, we create a normalized comparison matrix. To achieve this, we divide each value into the matrix by the sum of its corresponding column. This matrix essentially creates a relative weight for each criterion.
· Calculating weights: Finally, we calculate the average value for each row in the normalized matrix. These averages represent the relative weights for being compared. These weights allow us to quantify the importance of each criterion in the decision-making process.
A key advantage of AHP is its ability to evaluate the consistency of judgments using the Consistency Ratio (CR). The CR reflects the consistency of pairwise comparisons; a higher CR indicates lower consistency. Ideally, the CR should be below 0.10. If it exceeds this threshold, decision-makers should review their comparisons. Consistency is also evaluated using the Consistency Index (CI), as shown in (16).
 (16)
(16)Where λmax is the maximum eigenvalue of the decision matrix and n corresponds to the length of the decision matrix (i.e., the number of alternatives or criteria).
The degree of membership between paired assessments can be determined using an equation that is based on the CR. The Equation (17) can obtain the consistency and reliability of the pairwise comparison matrices used in the AHP, and RI corresponds to the random index values [30].
 (17)
(17)3. RESULTS AND DISCUSSION
3.1 Optimal number of clusters
The elbow method is used to identify the optimal number of clusters by analyzing the Inertia Index from Figure 1. This index corresponds to the sum of squared distances between data points and their centroids, so that the optimal number of clusters is k = 3, where the slope of is equal to -1, indicating a balance between the number of clusters and their compactness. It is important to remark that we considered the normalized time and cubed wind speed features v3normand tnorm .
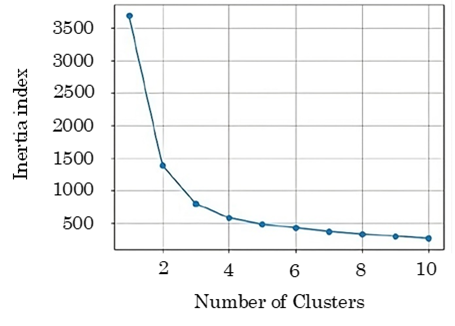
Figure 1.
Inertia Index
Source: own elaboration
On the other hand, the Elbow Method based on distortion is used to verify the optimal number of clusters obtained in the Elbow Method based on inertia. This method uses the Euclidean distance metric, and the distortion is calculated by dividing the inertia by the number of samples in the dataset. As shown in Figure 2, the optimal number of clusters is 3 also. The selection criterion is similar than the elbow method described above.
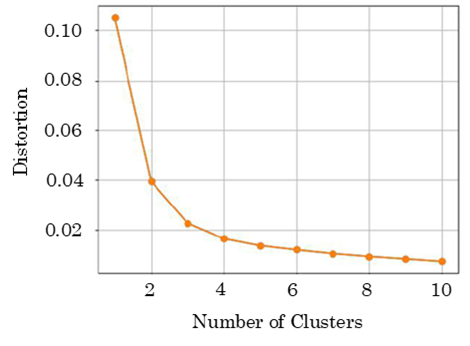
Figure 2.
Distortion Index
Source: own elaboration.
3.2 Centroids coordinates
In clustering analysis, centroids are representative points located within each formed cluster. These coordinates are essential for understanding the internal structure and characteristics of each data group. Figure 3 shows the collected data classified into three groups, represented by the colors red, blue, and green. Each of these clusters has a centroid, indicated by a star symbol, which represents the behavior of the data with its respective coordinates.
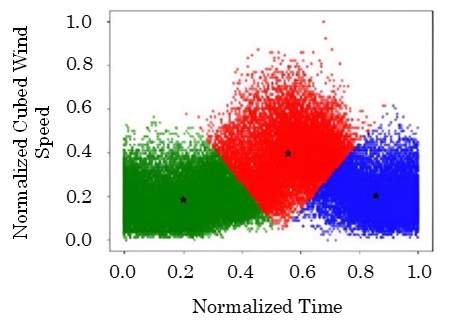
Figure 3.
Clustering Analysis and centroids, considering the normalized variables v3norm vs tnorm
Source: own elaboration
Table 3 shows the normalized coordinates, which are used for the analysis of the k-means algorithm implementation. However, to obtain the real-world coordinates, it is necessary a denormalization or inverse transform, as shown in Table 4. This result allows us to fit a quadratic function in Figure 4 to determine the performance metrics from subsections 2.7, 2.8, and 2.9.
| Label | Normalized Time | Normalized Cubed Wind Speed |
| Early Morning | 0.1992 | 0.1852 |
| Noon | 0.5578 | 0.3981 |
| Night | 0.8573 | 0.2053 |
| Label | Denormalized Time in h | Denormalized Cubed Wind Speed in m3/s3 |
| Early Morning | 4.7479 | 3.6871 |
| Noon | 13.295 | 32.928 |
| Night | 20.434 | 4.9286 |
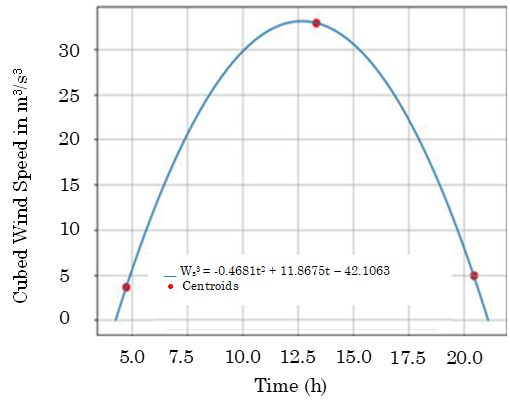
Figure 4.
Cubed wind speed (m3/s3) vs. Time (h) curve
Source: own elaboration
Figure 4 depicts the curve generated by the centroids of the clustering analysis carried out on denormalized wind speed and time data. This curve provides a general overview of the wind dynamics at the El Dorado-CATAM weather station. Below is a description of each identified centroid:
-
· Cluster 1 (early morning): This centroid is characterized by relatively low wind speeds on average over time. It can be observed that this cluster is associated with low wind conditions or periods of low wind energy generation.
· Cluster 2 (noon): The centroid 2 shows an increasing trend in wind speed over time. This cluster represents wind conditions ranging from light breezes to strong winds, indicating higher wind energy generation.
· Cluster 3 (night): The centroid 3 shows a decreasing trend in wind speed over time. This cluster is related to the decrease in wind energy generation due to the decrease in wind speed.
3.3 Parameters of Weibull distribution
One of the commonly used methods to linearize the distribution is using logarithmic graphs. Firstly, the natural logarithm of wind speed data is taken. Then, by transforming the linearized data, the cumulative probability function of Weibull is determined. As a preliminary step, the data is filtered from lowest to highest values, and the range of the median is calculated as a percentage.
Analyzing the Weibull distribution of wind speed, two key parameters are obtained: the scale c =2.227 m/s, the shape factor k=6.2433. The scale parameter indicates the characteristic wind speed at the site, and the shape factor reveals the variability of the wind speeds. These parameters are critical for selecting an appropriate wind turbine. The cut-in speed should be lower than the maximum wind speed at the location. Additionally, the power curve should be optimized for the most prevalent wind speed, as indicated by the shape factor, to ensure efficiency. Figure 5 combines two essential aspects of studying the wind velocity at the El Dorado airport: Weibull frequency distribution of occurrence of different wind speeds. The graph demonstrates that the maximum corresponds to 2.2 m/s, and it should be considered as the minimum starting velocity for the wind turbine. The wind speed that occurs most often is approximately 1.5 m/s. These parameters should be considered when selecting the appropriate wind energy system.
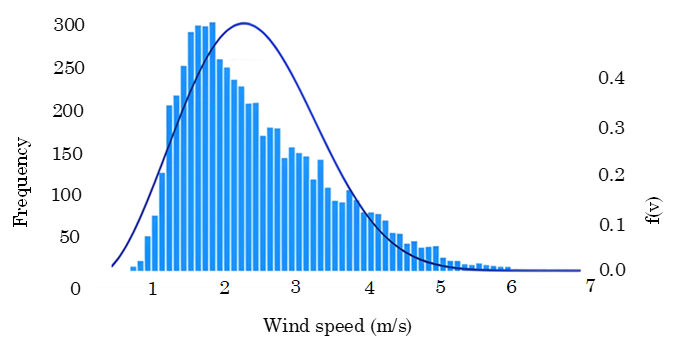
Figure 5.
Weibull probability density function and frequency distribution
Source: own elaboration.
3.4 Analytical hierarchy process (AHP)
The cluster analysis of wind speeds revealed that the maximum wind speed achieved is 3.2 m/s, indicating that the wind does not exceed this value under normal conditions. Therefore, it is necessary to select a wind turbine that can generate electricity at low wind speeds and is not adversely affected by high wind speeds. The frequency at this wind speed corresponds to 83 times, while the speed with the highest frequency is equivalent to 1.5 m/s, which means this value is repeated 294 times.
The maximum wind speed obtained by the probability density function is 2.1 [m/s], representing the highest possible wind speed, as shown in Figure 5. The Satty scaled method involves several evaluating criteria, such as maximum power, number of blades, minimum start-up speed, nominal speed, and nominal power. Technical data shown in Table 5 is applied to assign weights to these criteria and compare the available wind turbine options. Below is a table of the pre-selected wind turbines that meet the required conditions. The references 300 X-300 and FS-200 were selected from the horizontal and vertical axis wind turbines group, respectively. These choices were based on the technical data obtained during the analysis, considering criteria such as maximum power output, number of blades, minimum start-up speed, nominal speed, and nominal power.
To ensure the reliability of the AHP decision-making process, consistency metrics were evaluated using the Super Decisions software. This tool automatically calculates the Consistency Index (CI) and Consistency Ratio (CR) based on the pairwise comparison matrix. In our analysis, the resulting CR was below the acceptable threshold of 0.10, indicating consistent judgments. This validation supports the robustness of the weightings applied in the turbine selection process.
| Horizontal-axis turbines | Initial speed m/s | Nominal speed m/s | Rated power W | Max power W | Blades |
| 300 X-300 | 1.8 | 14 | 100 | 300 | 5 |
| Lowenergie 100W | 2.0 | 16 | 100 | 120 | 3 |
| ATO-WT-NE-100S5 | 2.0 | 10 | 100 | 130 | 3 |
| Vertical-axis turbines | Initial speed m/s | Nominal speed m/s | Rated power W | Max power W | Blades |
| EN-100W-XL | 2.0 | 13 | 100 | 110 | 2 |
| NE-100Q2 | 1.5 | 10 | 100 | 130 | 9 |
| FS-200 | 1.5 | 11 | 200 | 210 | 2 |
3.5 Performance indexes
For each selected wind turbine, the capacity factor is obtained. First, it is necessary to find the value of the air density and the swept area of the blades by means of (9) considering the average temperature T as 16.02 °C and the height above sea level h is 2547.49 m. This result is shown in (18)[20].
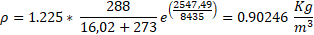 (18)
(18)A necessary technical characteristic is the radius of the turbine blades. For turbines 300 X-300 and Fs-200 corresponds to 0.9 m and 0.45 m, respectively. This information is used to determine the swept area of the blades using (19).
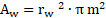 (19)
(19)Once the swept area of the blades is obtained, the energy generated can be determined using (9) considering t1 and t2 equal to 4.2660 h and 21.0854 h, respectively. Then, the nominal energy is calculated during a specific period, as shown in (20).
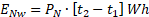 (20)
(20)A Capacity Factor (CF) near 10% indicates a technical unfeasibility of this energy solution. Values below this limit exhibit that the wind turbine is producing much less energy than its nominal capacity [31]. To obtain the Performance Yields (Yr) of this wind turbine, a consideration must be given to its nominal speed, which is the wind speed at which the wind turbine reaches its maximum energy generation capacity. Table 5 shows the nominal speed of this generator is 14 m/s, and this information is used to obtain (13) Finally, the Performance Ratio (PR) is a valuable tool for assessing the performance of a wind turbine under real conditions and determining whether the available wind resource is being effectively utilized. This relationship is given as the ratio of air densities, multiplied by power coefficient Cp. This performance metric is calculated based on (21).
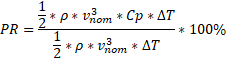 (21)
(21)Where ρ is the air density, vnom corresponds to the nominal wind velocity of the wind turbine, Cp=0.593, and ΔT=t2-t1 is the time interval considered. In Table 6 the results for each of the performance metrics of the pre-selected wind turbines are summarized.
| Selected wind turbine | Capacity Factor CF % | Performance Yields Yr in h | Performance Ratio PR % |
| 300 X-300 | 25.43 | 0.1352 | 43.49 |
| FS-200 | 3.16 | 0.2788 | 43.49 |
A PR of 43.39% for both the 300-X300 and Fs-200 wind turbines suggests that solution is realistic. It is important to remark that implementing a wind system with a PR greater than or equal to 90% is not realistic due to wind speed resource uncertainty [24].
3.6 Discussion
The findings of this study are consistent with previous research highlighting the technical constraints of urban wind energy systems. Studies such as [5] and [7] have shown that wind flow in urban environments is heavily affected by turbulence and surface roughness, diminishing turbine performance. Our clustering analysis reinforces this understanding by identifying low to moderate wind speeds during key time intervals, and the Weibull scale parameter of 2.2 m/s reflects the limited energy potential in Bogotá’s urban landscape. These values are comparable to those reported for other Latin American cities with similar topographic and meteorological profiles. In a similar vein, [19] found that industrial areas in Algeria showed wind profiles that were promising but required hybrid system integration for viable energy supply.
From a practical perspective, the Analytic Hierarchy Process (AHP) facilitated a structured evaluation of candidate wind turbines by integrating technical performance criteria and real-world feasibility. The 300 X-300 turbine, which achieved the highest scores, reported a Capacity Factor (CF) of 25.43% and a Performance Ratio (PR) of 43.49%, indicating its potential use in hybrid renewable energy configurations or pilot-scale urban deployments, such as those in public facilities or educational institutions. These findings are consistent with results by [24], where it is shown that clustering and performance metrics can enhance the assessment of commercial-scale systems in constrained environments.
Nonetheless, some limitations must be acknowledged. The study relied on data from a single weather station over a ten-month period, which may not reflect the full seasonal or spatial variability of wind conditions across Bogotá. The analysis did not consider factors such as economic feasibility, grid connection requirements, or urban planning constraints, all of which are essential for the implementation of wind energy systems in densely built environments. Additionally, the methodology assumes that all meteorological data are accurate and representative, although urban microclimates may introduce localized anomalies. Future research could enhance the robustness of this study by integrating multiple data sources and conducting comprehensive techno-economic evaluations, as suggested by [12].
Despite these constraints, this research provides added value by integrating unsupervised learning, Weibull distribution modeling, and AHP into a comprehensive framework for urban wind assessment. This adaptable and scalable methodological approach offers a decision-support tool for policymakers and planners aiming to explore small-scale wind energy as part of broader urban sustainability strategies. Furthermore, the methodology supports the transition toward data-driven energy planning, which is particularly relevant in emerging economies, as emphasized by [23].
4. CONCLUSIONS
Data preprocessing, particularly data normalization, is a key stage in mitigating numerical discrepancies in normalization. This transformation avoids bias in the clustering algorithm and enhances the reliability of the results. The integration of a correlation, trend, and clustering analysis using the elbow method allows the extraction of wind resource patterns from historical data. The wind turbine starting speeds by Weibull and clustering analysis differ. This difference is because the Weibull approach provides a probabilistic approximation, while the clustering analysis offers a more realistic representation in situ. This last method offers an accurate energy system sizing.
Performance metrics, which correspond to capacity factor (CF), yield ratio (Yr), and performance ratio (PR), were used to evaluate the technical feasibility of the implementation of a wind energy solution. The evaluation of metrics in the selected turbine, which corresponds to 300 X-300, indicates that the wind energy resource is insufficient to supply daily energy needs in Bogotá, but this analysis provides important insights for future energy autonomous designs.
The Analytic Hierarchy Process (AHP) is a suitable decision-making tool for energy systems sizing because it establishes a structured comparison based on multiple technical criteria. Likewise, the PR analysis shows that small-scale urban wind systems are limited because they depend on local conditions, such as wind speed, direction, and the type of terrain, among other environmental factors.
Acknowledgments
This research work was supported by Universidad de La Salle, Bogotá, Colombia, and founded by Universidad Santo Tomás, under institutional codes FODEIN BOG2023IDT012, and ETI2025-107.
REFERENCES
[1] D. Icaza, D. Borge-Diez, and S. Pulla Galindo, “Proposal of 100% renewable energy production for the City of Cuenca-Ecuador by 2050,” Renewable Energy, vol. 170, pp. 1324-1341, Jun. 2021. https://doi.org/10.1016/j.renene.2021.02.067
[2] A. Murtaza Ershad, R. J. Brecha, and K. Hallinan, “Analysis of solar photovoltaic and wind power potential in Afghanistan,” Renewable Energy, vol. 85, pp. 445-453, Jan. 2016. https://doi.org/10.1016/j.renene.2015.06.067
[3] M. Khalid Farooq, and S. Kumar, “An assessment of renewable energy potential for electricity generation in Pakistan,” Renewable and Sustainable Energy Reviews, vol. 20, pp. 240-254, Apr. 2013. https://doi.org/10.1016/j.rser.2012.09.042
[4] F. Salazar-Caceres, H. Ramirez-Murillo, C. A. Torres-Pinzón, and M. P. Camargo-Martínez, “Performance estimation technique for solar-wind hybrid systems: A machine learning approach,” Alexandria Engineering Journal, vol. 87, pp. 175-185, Jan. 2024. https://doi.org/10.1016/j.aej.2023.12.029
[5] K. Sunderland, T. Woolmington, J. Blackledge, and M. Conlon, “Small wind turbines in turbulent (urban) environments: A consideration of normal and Weibull distributions for power prediction,” Journal of Wind Engineering and Industrial Aerodynamics, vol. 121, pp. 70-81, Oct. 2013. https://doi.org/10.1016/j.jweia.2013.08.001
[6] J. A. Guarienti, A. Kaufmann Almeida, A. Menegati Neto, A. R. de Oliveira Ferreira, J. P. Ottonelli, and I. Kaufmann de Almeida, “Performance analysis of numerical methods for determining Weibull distribution parameters applied to wind speed in Mato Grosso do Sul, Brazil,” Sustainable Energy Technologies and Assessments, vol. 42, p. 100854, Dec. 2020. https://doi.org/10.1016/j.seta.2020.100854
[7] A. Adnan Shoukat et al., “Blades optimization for maximum power output of vertical axis wind turbine,” International Journal of Renewable Energy Development, vol. 10, no. 3, pp. 585-595, Aug. 2021. https://doi.org/10.14710/ijred.2021.35530
[8] K. Mrigua, A. Toumi, M. Zemamou, B. Ouhmmou, Y. Lahlou, and M. Aggour, “CFD Investigation of a new elliptical-bladed multistage Savonius rotors,” International Journal of Renewable Energy Development, vol. 9, no. 3, pp. 383-392, Oct. 2020. https://doi.org/10.14710/ijred.2020.30286
[9] A. Eltayesh, F. Castellani, F. Natili, M. Burlando, and A. Khedr, “Aerodynamic upgrades of a Darrieus vertical axis small wind turbine,” Energy for Sustainable Development, vol. 73, pp. 126-143, Apr. 2023. https://doi.org/10.1016/j.esd.2023.01.018
[10] H. A. Porto, C. A. Fortulan, and A. J. V. Porto, “Power performance of starting-improved and multibladed horizontal-axis small wind turbines,” Sustainable Energy Technologies and Assessments, vol. 53, no. Part A, p. 102341, Oct. 2022. https://doi.org/10.1016/j.seta.2022.102341
[11] H. Ramirez-Murillo, F. Salazar-Caceres, M. P. Camargo-Martinez, A. A. Patiño-Forero, and F. J. Mendez-Casallas, “Energy performance clustering and data visualization for solar-wind hybrid energy systems,” in Applied Computer Sciences in Engineering, J. C. Figueroa-García, C. Franco, Y. Gutierrez, and G. Hernández-Pérez, Eds., Cham: Springer Nature Switzerland, 2022, pp. 77-89. https://doi.org/10.1007/978-3-031-20611-5_7
[12] K. F. Sotiropoulou, A. P. Vavatsikos, and P. N. Botsaris, “A hybrid AHP-PROMETHEE II onshore wind farms multicriteria suitability analysis using kNN and SVM regression models in northeastern Greece,” Renewable Energy, vol. 221, p. 119795, Feb. 2024. https://doi.org/10.1016/j.renene.2023.119795
[13] D. Singh, and B. Singh, “Investigating the impact of data normalization on classification performance,” Applied Soft Computing, vol. 97, no. Part B, p. 105524, Dec. 2020. https://doi.org/10.1016/j.asoc.2019.105524
[14] J. C. Aririguzo, and E. B. Ekwe, “Weibull distribution analysis of wind energy prospect for Umudike, Nigeria for power generation,” Robotics and Computer-Integrated Manufacturing, vol. 55, no. Part B, pp. 160-163, Feb. 2019. https://doi.org/10.1016/j.rcim.2018.01.001
[15] A. M. Ikotun, A. E. Ezugwu, L. Abualigah, B. Abuhaija, and J. Heming, “K-means clustering algorithms: A comprehensive review, variants analysis, and advances in the era of big data,” Information Sciences, vol. 622, pp. 178-210, Apr. 2023. https://doi.org/10.1016/j.ins.2022.11.139
[16] A. Karna, and K. Gibert, “Automatic identification of the number of clusters in hierarchical clustering,” Neural Computing and Applications, vol. 34, no. 1, pp. 119-134, Jan. 2022. https://doi.org/10.1007/s00521-021-05873-3
[17] A. Et-taleby, M. Boussetta, and M. Benslimane, “Faults detection for photovoltaic field based on k-means, elbow, and average silhouette techniques through the segmentation of a thermal image,” International Journal of Photoenergy, vol. 2020, pp. 1-7, Dec. 2020. https://doi.org/10.1155/2020/6617597
[18] S. Farhan Khahro, K. Tabbassum, A. Mahmood Soomro, L. Dong, and X. Liao, “Evaluation of wind power production prospective and Weibull parameter estimation methods for Babaurband, Sindh Pakistan,” Energy Conversion and Management, vol. 78, pp. 956-967, Feb. 2014. https://doi.org/10.1016/j.enconman.2013.06.062
[19] S. Marih, L. Ghomri, and B. Bekkouche, “Evaluation of the wind potential and optimal design of a wind farm in the Arzew Industrial Zone in Western Algeria,” International Journal of Renewable Energy Development, vol. 9, no. 2, pp. 177-187, Jul. 2020. https://doi.org/10.14710/ijred.9.2.177-187
[20] M. P. Burgos Gutiérrez, S. Aldana Ávila, and D. J. Rodríguez Patarroyo, “Análisis del recurso energético eólico para la ciudad de Bogotá DC para los meses de diciembre y enero, Colombia,” Avances Investigación en Ingeniería, vol. 12, no. 1, Dec. 2015. https://doi.org/10.18041/1794-4953/avances.2.278
[21] P. Kumar Chaurasiya, S. Ahmed, and V. Warudkar, “Study of different parameters estimation methods of Weibull distribution to determine wind power density using ground-based Doppler SODAR instrument,” Alexandria Engineering Journal, vol. 57, no. 4, pp. 2299-2311, Dec. 2018. https://doi.org/10.1016/j.aej.2017.08.008
[22] B. Hasan Khan, and M. Mushir Riaz, “Techno-economic analysis and planning for the development of large-scale offshore wind farm in India,” International Journal of Renewable Energy Development, vol. 10, no. 2, pp. 257-268, May. 2021. https://doi.org/10.14710/ijred.2021.34029
[23] J. M. El Hacen, R. Ihaddadene, N. Ihaddadene, C. E. B. Elhadji Sidi, M. EL Bah, and P. -O. Logerais, “Performance analysis of micro-amorphe silicon PV array under actual climatic conditions in Nouakchott, Mauritania,” in 2019 10th International Renewable Energy Congress (IREC), Sousse, Tunisia, 2019, pp. 1-6. https://doi.org/10.1109/IREC.2019.8754599
[24] J. -Y. Wang, Z. Qian, H. Zareipour, and D. Wood, “Performance assessment of photovoltaic modules based on daily energy generation estimation,” Energy, vol. 165, no. Part B, pp. 1160–1172, Dec. 2018. https://doi.org/10.1016/j.energy.2018.10.047
[25] M. R. Islam, R. Saidur, and N. A. Rahim, “Assessment of wind energy potentiality at Kudat and Labuan, Malaysia using Weibull distribution function,” Energy, vol. 36, no. 2, pp. 985-992, Feb. 2011. https://doi.org/10.1016/j.energy.2010.12.011
[26] S. H. Pishgar-Komleh, A. Keyhani, and P. Sefeedpari, “Wind speed and power density analysis based on Weibull and Rayleigh distributions: A case study in Firouzkooh county of Iran,” Renewable and Sustainable Energy Reviews, vol. 42, pp. 313-322, Feb. 2015. https://doi.org/10.1016/j.rser.2014.10.028
[27] A. Akim Salami, S. Ouedraogo, K. Mawugno Kodjoa, and A. S. Akoda Ajavon, “Influence of the random data sampling in estimation of wind speed resource: Case study,” Int. J. Renew. Energy Dev., vol. 11, no. 1, pp. 133-143, Feb. 2022. https://doi.org/10.14710/ijred.2022.38511
[28] P. Das et al., “Assessment of Barriers to Wind Energy Development Using Analytic Hierarchy Process,” Sustainability, vol. 15, no. 22, p. 15774, Nov. 2023. https://doi.org/10.3390/su152215774
[29] J. Arán Carrión, A. Espín Estrella, F. Aznar Dols, M. Zamorano Toro, M. Rodríguez, and A. Ramos Ridao, “Environmental decision-support systems for evaluating the carrying capacity of land areas: Optimal site selection for grid-connected photovoltaic power plants,” Renew. Sustain. Energy Rev., vol. 12, no. 9, pp. 2358–2380, Dec. 2008. https://doi.org/10.1016/j.rser.2007.06.011
[30] B. G. Guerrero Hoyos, F. de J. Vélez Macías, and D. E. Morales Quintero, “Energía eólica y territorio: sistemas de información geográfica y métodos de decisión multicriterio en La Guajira (Colombia),” Ambiente y Desarrollo, vol. 23, no. 44, Feb. 2019. https://revistas.javeriana.edu.co/index.php/ambienteydesarrollo/article/view/24688
[31] S. Carreno-Madinabeitia, G. Ibarra-Berastegi, J. Sáenz, and A. Ulazia, “Long-term changes in offshore wind power density and wind turbine capacity factor in the Iberian Peninsula (1900–2010),” Energy, vol. 226, p. 120364, Jul. 2021. https://doi.org/10.1016/j.energy.2021.120364
Notes
The authors declare that they have no conflict of interest.
Gianina Garrido Silva: Writing, Review and editing, Project administration and Validation.
Harrynson Ramírez-Murillo: Writing, Review and Editing, Project administration and Validation.
María Paula Cajamarca García: Conceptualization, Methodology, Formal analysis and Writing original draft.
Carlos Andrés Torres-Pinzón: Supervision, Resources, Writing, Review and editing, Project administration.
All authors have read and agreed to the published version of the manuscript.
Notas de autor
haramirez@unisalle.edu.co
Información adicional
How to cite / Cómo citar: G. Garrido-Silva, H. Ramírez-Murillo, M. P. Cajamarca-García, and C. A. Torres-Pinzón, “Urban Wind Energy Assessment Using Machine Learning and Multi-criteria Analysis,” TecnoLógicas, vol. 28, no. 63, e3262, 2025. https://doi.org/10.22430/22565337.3262
Información adicional
redalyc-journal-id: 3442
Enlace alternativo
https://revistas.itm.edu.co/index.php/tecnologicas/issue/view/148 (html)