Investigación
Influence of Energy Conservation Measures on the Load Profile of Homes in a Tropical Climate: Case Study in Bucaramanga, Colombia
Influencia de medidas de conservación de energía en el perfil de carga de viviendas en un clima tropical: estudio de caso en Bucaramanga, Colombia
 Jorge Cárdenas-Rangel jorge2148225@uis.edu.co
Julián Jaramillo-Ibarra jejarami@uis.edu.co
Jorge Cárdenas-Rangel jorge2148225@uis.edu.co
Julián Jaramillo-Ibarra jejarami@uis.edu.co
Influence of Energy Conservation Measures on the Load Profile of Homes in a Tropical Climate: Case Study in Bucaramanga, Colombia
TecnoLógicas, vol. 28, núm. 63, pp. 1-17, 2025
Instituto Tecnológico Metropolitano

Esta obra está bajo una Licencia Creative Commons Atribución-NoComercial-CompartirIgual 4.0 Internacional.
Recepción: 16 Enero 2025
Aprobación: 02 Julio 2025
Publicación: 19 Agosto 2025
Abstract: The residential sector represents a significant part of energy consumption in tropical countries, where the climate directly influences the demand for ventilation and air conditioning. In cities like Bucaramanga (Colombia), the growth of building stock and the increased use of electrical appliances highlight the need for energy efficiency strategies. Although Colombia has made regulatory progress—such as Resolution 0549 of 2015—its application in residential buildings, especially in warm climates, remains underexplored. This study analyzes the impact of energy-saving measures on the demand profile of a middle-income residential building located in a tropical warm climate. The implementation of strategies recommended by Resolution 0549-2015 was evaluated through energy simulations using DesignBuilder V6. The methodology considered five scenarios: an existing building, one representing typical features of the current building stock, and three others that incorporate horizontal shading, natural ventilation, and variations in the window-to-wall ratio. The results showed a 20% reduction in energy consumption in the existing building compared to the reference model, mainly due to improvements in lighting and elevator efficiency. It is concluded that the proposed energy-saving measures are effective only when air conditioning systems are present and that their implementation can help reduce transformer loads. This study offers a valuable local contribution, being one of the first in Colombia to examine residential building design from an energy efficiency perspective, based on national regulations and simulation tools.
Keywords: Building energy simulation, energy conservation, energy demand, energy efficiency, residential buildings.
Resumen: El sector residencial representa una parte importante del consumo energético en países tropicales, donde el clima influye directamente en la demanda de ventilación y climatización. En ciudades como Bucaramanga (Colombia), el crecimiento del parque inmobiliario y el mayor uso de equipos eléctricos hacen necesaria la adopción de estrategias de eficiencia energética. Aunque Colombia ha avanzado en normativa, como la Resolución 0549 de 2015, su aplicación en viviendas, especialmente en climas cálidos, ha sido poco estudiada. Este trabajo analiza el impacto de medidas de ahorro energético sobre el perfil de demanda de una edificación residencial de ingresos medios ubicada en clima tropical cálido. Se evaluó la implementación de estrategias sugeridas por la Resolución 0549-2015 mediante simulaciones energéticas en DesignBuilder V6. La metodología consideró cinco escenarios: un edificio existente, uno con características del parque inmobiliario actual y tres que integran sombreado horizontal, ventilación natural y variaciones en la relación ventana-pared. Los resultados mostraron una reducción del 20 % en el consumo energético del edificio existente respecto al de referencia, principalmente por mejoras en iluminación y ascensores. Se concluye que las medidas propuestas tienen efecto sobre el consumo, solo cuando hay sistemas de aire acondicionado, y que su implementación puede reducir la carga en los transformadores. Este estudio representa una contribución local relevante al ser uno de los primeros en Colombia que examina el diseño de viviendas desde un enfoque de eficiencia energética, apoyado en normativa nacional y simulación computacional.
Palabras clave: Simulación energética de edificaciones, conservación de energía, demanda energética, eficiencia energética, edificaciones residenciales.
Highlights
-
Resolution 0549 was evaluated in warm-climate housing through energy simulation.
Passive strategies are effective only when air conditioning is used.
Energy consumption in the existing building was reduced by 20% compared to the reference model.
The proposed measures help reduce transformer load demand.
Highlights
-
Se evaluó la Resolución 0549 en viviendas de clima cálido a partir de simulación energética.
Las estrategias pasivas son efectivas solo si hay uso de aire acondicionado.
Se redujo un 20 % el consumo del edificio existente frente al modelo de referencia.
Las medidas propuestas ayudan a disminuir la cargabilidad en transformadores.
1. INTRODUCCIÓN
Buildings are one of the sectors that consume the most energy worldwide [1], [2]. In 2020, this sector finished 34% of the total end-use energy and produced 36% of the total polluting emissions related to energy processes [3], which shows the need to link this sector to the fight against climate change. For this reason, it is a priority to continue with the development of actions that allow for the reduction of emissions and improvement of the performance of buildings and their energy adaptation capacity [2]-[6].
Energy efficiency effectively reduces building energy consumption and addresses sustainable development and climate change mitigation efforts. Widespread adoption of energy-saving measures in buildings reduces overall energy use and helps countries achieve emission reduction targets [4]. Literature indicates that numerous studies investigate the effects of incorporating energy-saving measures in buildings situated in tropical regions, either by estimating the decrease in consumption [5]-[12] benefits for thermal comfort [13]-[15] or reduction of polluting emissions [16], [17].
In Colombia, recently, the Ministry of Housing, City, and Territory (Ministerio de Vivienda, Ciudad y Territorio - MVCT) established Resolution 0549 of 2015 (R0549-2015) [18], which established the minimum percentages of savings in energy and water that new constructions must satisfy throughout the country, according to the climatic situation and the type of building [19]. Researchers have carried out some prospective energy efficiency studies despite a regulatory framework. Such is the case of [20], who estimated the energy demand for 2030 and 2050, considering the massive implementation of savings measures, among other technological changes and energy regulations. According to this study, the no-integration of saving measures will cause an increase in energy demand in the residential sector of 58% and 118% for 2030 and 2050, respectively.
For their part, [21] estimate energy demand through a systems model for various sustainable construction scenarios, considering the degree of compliance with R0549-2015, the price of fossil fuels, and the favorability of the national energy transition policy. This study predicts a demand reduction of around 12% for Bogotá and Medellín towards 2025 and 2030, respectively, due to compliance with the saving percentages established in that resolution and the improvement of the energy efficiency of existing buildings.
Other studies have investigated the incorporation of energy-saving measures in buildings. In 2017 [22] researched optimizing the passive design of residential buildings in Shanghai, China. The study's primary goal was to enhance thermal comfort while reducing the energy demand of buildings. To achieve this, the researchers used a multi-objective optimization approach, including developing a representative EnergyPlus model and performing a sensitivity analysis with 370 samples. The variables analyzed encompassed passive strategies such as natural ventilation, solar shading, thermal insulation, and passive heating. The results revealed that the window opening factor significantly impacted thermal comfort, whereas airflow significantly influenced energy demand.
On the other hand, [23] analyzed in 2015 how various building parameters and occupant behavior influence heating energy consumption and the PMV thermal comfort index in residential buildings in the Netherlands. The study employed a sensitivity analysis using the Monte Carlo method with EnergyPlus software and a reference building. Results revealed that factors related to occupant behavior, particularly thermostat usage and ventilation, had a significantly more significant impact on heating energy consumption than the physical parameters of the building. Another finding was that metabolic rate and clothing primarily influenced the PMV index.
In 2024, [12] analyzed the impact of thermal insulation strategies and the integration of photovoltaic cells on energy consumption reduction. The study presented a case involving a residential community in Florida, USA, based on a simulation of a complex of 90 buildings to optimize energy use by implementing shading systems and solar energy. DesignBuilder and PV-Syst were the software used to build the energy models. The study concluded that installing shading devices on south-facing windows, insulating walls and roofs, and replacing traditional lighting with LED lamps are effective strategies to reduce energy consumption in buildings.
In Colombia, case studies on energy efficiency strategies applied to specific buildings are scarce. Most identified research has focused on the analysis of public policies and literature reviews. However, recent progress has been reported with an energy characterization study conducted on 20 residential and office buildings in Bucaramanga [24]. In this work, the researchers analyzed the main causes of energy consumption and investigated the effects of implementing passive energy-saving measures recommended by local regulations. The results demonstrated improvements in the energy performance of buildings after integrating strategies that mitigate the direct effects of solar radiation.
Moreover, one of the most relevant national studies examines sustainable construction scenarios and the adoption of energy efficiency standards in the cities of Bogotá, Medellín, Cali, and Barranquilla. Using a dynamic model with monthly resolution for the period 2015–2035, a high level of compliance was identified in Bogotá (around 70%), while in Cali and Barranquilla many companies remain unaware of current regulations [21].
Additionally, another study addresses the conditions facilitating the implementation of energy efficiency policies in buildings in Brazil, Chile, Colombia, and Uruguay. The authors conclude that literature on enabling frameworks in developing countries is scarce, highlighting Chile and Uruguay as having the most favorable environments. In contrast, Colombia faces significant distortions in energy pricing, which hinders progress in this field [25].
Regarding thermal comfort, a review of the state of research in the country reveals limited academic output, mostly concentrated around 2012. Residential buildings are the most studied typology, followed by schools and offices [26]. Finally, a study focused on the use of reflective coatings in houses located in warm areas of the Colombian Caribbean coast was found. The results demonstrate the effectiveness of this passive solution to reduce thermal discomfort and improve energy efficiency in such environments [24].
The literature includes several studies that analyze the behavior of the demand curve in buildings [27]-[35]. These works have examined aspects such as the identification of consumption patterns, peak loads, seasonality, system efficiency, user behavior, and energy cost analysis, among others. Based on these analyses, researchers have proposed strategic recommendations regarding building operation, appropriate system sizing and efficiency, and energy use improvements through the implementation of energy-saving measures.
Although some studies focus in detail on individual dwellings, there is a notable lack of research centered on tropical multifamily buildings with limited use of artificial air conditioning. As mentioned earlier, incorporating energy-saving measures can enhance both the energy performance and thermal comfort of buildings. Furthermore, the widespread adoption of such measures may positively impact electrical system planning by lowering energy demand, increasing system stability, and supporting the integration of renewable energy sources.
Despite this, there is still a gap in the literature regarding studies that assess how the integration of energy-saving measures affects energy demand in residential buildings. This gap limits the ability to fully understand the potential benefits of these measures in transforming both the residential sector and the operation and planning of electrical systems.
With respect to the energy-saving measures analyzed, previous studies have mainly focused on measures related to air conditioning systems and their interaction with thermal storage [32], or the integration of photovoltaic systems [28], [34]. In contrast, this study considers energy-saving measures recommended by local regulations for middle-income multifamily buildings, as these are more likely to be widely adopted.
Therefore, the objective of this work was to evaluate the impact of a set of energy-saving measures on the demand curve of a residential building. The building analyzed is a middle-income multifamily dwelling located in Bucaramanga, Colombia—a city representative of both the tropical climate and national construction practices. The analysis includes five scenarios that incorporate the energy-saving measures recommended by the prescriptive method outlined in Resolution R0549-2015 for residential buildings in hot-dry climates. This method aims to meet energy-saving targets defined by the implementation of the measures listed in Tables 16 to 19 of Annex 1 of the Resolution [19]. Investigating this topic can provide valuable insights for network operators regarding the potential future operating conditions of the electrical grid.
2. METHODOLOGY
The study starts by obtaining the energy model of the selected building (scenario 0). The actual model allowed four additional analysis scenarios to be received. The reference building or baseline (scenario 1) and three scenarios (2, 3, and 4) later consider integrating energy-saving measures. Finally, the results of the energy simulations allow a comparative analysis to determine the impact of incorporating such a strategy on the building's power demand curve. Figure 1 presents the schematic of the study methodology.

Figure 1.
Methodology applied in this study
Source: own elaboration.
2.1 Description of the building under study
This study takes place in the Metropolitan Area of Bucaramanga (Área Metropolitana de Bucaramanga – AMB), situated at 7.13° N latitude and 73.13° W longitude. The region experiences an average solar irradiation of 4.8 kWh/m² per day. Characterized by a warm tropical climate, the city is located at an elevation of 960 meters above sea level. Table 1 summarizes the main climatic characteristics of this tropical location [36].
| Parameter | Value |
| Average annual precipitation | 1279 mm |
| Average ambient temperature | 24°C (During the day) |
| 27°C (Sunlight hours) | |
| Average maximum temperature | 31°C |
| Average solar irradiation | 4.8 kWh/m2∙day |
| Wind speed | 1.0-1.5 m/s |
This building is a type of multifamily, half-income housing. It has twelve floors, each housing six three-bedroom apartments with an average area of 62 m2. Table 2 presents the building's construction characteristics.
| Characteristic | Value / Details |
| Construction system | Industrialized with a structure of plates and concrete walls |
| Approximate WWR | 19 |
| Exterior walls configuration | The wall is concrete, putty, and painted inside, and the plastic stucco is outside. Overall thickness: 13 cm |
| Exterior walls U value [W/m²·K] | 3.25 |
| Roof configuration | Solid concrete plate, stucco, and lower face paint. Mortar, asphalt layer, and reflective paint on the upper face. Overall thickness: 16 cm |
| Cover U value [W/m²·K] | 2.76 |
| Lighting power density - LPD [W/m2] | 2.22 |
| Power Density of plug-in charges [W/m2] | 31.49 |
| Average power consumption [kWh/m2] | 130 |
| Air conditioning system | The main room of some of the apartment typologies (9000 BTU) |
| Elevators | 1 x 7.5 HP |
| Apartment area [m2] | 4145.0 |
| General services area [m2] | 456.6 |
2.2 Energy modeling
DesignBuilder V6 software enabled the building's energy modeling. This program stands out for its user-friendly graphical interface, integrated simulation modules, high degree of customization through coding, support for certifications and regulations, and extensive documentation and technical support. This process comprises three phases: geometric modeling, model data mapping, and model fitting.
Geometric modeling requires information from floor plans, facade elevations, and door and window details. The model data mapping consists of four categories: building usage data, material data, load data, and HVAC data. Memories of the building's architectural and electrical design and an inspection visit were considered sources of information.
Findings from the inspection visit and historical monthly energy consumption data provided valuable insights into the characteristics and operational dynamics of the building's air conditioning systems. Each apartment's main room has a 9000 BTU split air conditioning unit. Figure 2 presents the energy model of the building under study.

Figure 2.
The representative energy model of the building
Source: own elaboration.
A parameter adjustment process improved the reliability of the building’s energy model. This process involved comparing the simulated annual energy consumption values with the measured data provided by the local energy utility company. For the habitable areas (apartments), the adjustment was based on calculating the percentage error between the measured and simulated consumption. The model was considered calibrated when the error was below 10% in at least 90% of the apartment types.
For common areas, where measured consumption data were not available, the adjustment relied on lighting and motor usage data obtained from modeling exercises of similar buildings.
Refining the usage data of some of the building systems allowed the adjustment of the models. After adjustment, the model error was only 0.06%. For this reason, the energy model is valid for the proposed analyses.
2.3 Evaluation of the impacts of measures
Five (5) simulation scenarios were considered to evaluate the impact of integrating measures. The proposed simulation scenarios consider the building's design characteristics (actual building scenario), the characteristics typical to its typology (reference building scenario), and recommended energy-saving measures for compliance with R0549-2015 that can be modeled in DesignBuilder (strategy integration scenarios).
2.3.1 Actual scenario
This scenario corresponds to the simulation of the energy model of the building under study as it is built. It allows analysis of the impacts of the building's particular design characteristics on the demand curve.
2.3.2 Reference scenario
This scenario consisted of simulating the energy model of the building configured with a group of usual characteristics of the stock. The representative characteristics of the reference scenario are part of the results of an inter-institutional project led by the Construction Cluster of the Bucaramanga Chamber of Commerce [36]. These characteristics are the product of an analysis with experts from the local construction sector. Table 3 presents the characteristics of the reference scenario.
| Characteristics | Value / Detail |
| Building use and operation data | Same as in the actual case |
| Exterior walls | Exterior walls of hollow clay brick core, covered with frieze mortar, interior stucco, and exterior plastic stucco |
| Cover | Roof with a solid concrete core, leveling mortar, asphalt layer on the outside, and plaster inside |
| Glazing | 3 mm glass, U value of 5.91, and SHGC value of 0.8 |
| WWR | The window-to-wall ratio remains the same |
| Appliance and plug-in loads | Same as in the actual case. |
| Elevators load | 18.5 kW |
| Lighting power density | 7.53 W/m2 |
2.3.3 Scenarios with savings measures
There are three in total. These scenarios are associated with three energy-saving measures recommended by R0549-2015 for medium-income residential buildings in hot and dry climates: window-to-wall ratio – WWR, horizontal shading, and natural ventilation. The savings strategy scenarios required three energy models, one for each strategy. Table 4 summarizes the considerations for the simulation scenarios.
| Scenario | Denomination | Scenario considerations | |
| 0 | Actual building | The annual hourly simulation of the energy model was generated according to the design specifications and inspection visit findings. | |
| 1 | Reference building | The annual hourly simulation of the energy model was generated according to the representative characteristics of the stock, as shown in Table 3. | |
| 2 | Actual building + horizontal shading | The annual hourly simulation of the energy model of the actual building was set with horizontal overhangs of 80 cm on the top of the windows. | |
| 3 | Actual building + Natural ventilation | The annual hourly simulation of the energy model of the actual building was configured with natural ventilation in all its spaces. | |
| 4 | Actual building + WWR 30% | The annual hourly simulation of the energy model of the actual building was configured with a WWR ratio of 30% (this percentage was analyzed by the technical document of R0549-2015) | |
3. RESULTADOS Y DISCUSIÓN
The breakdown of the characteristic demand curve allowed the study of the building's actual behavior. Comparing the demand curves permitted the analysis of the scenarios' differences in behavior. The study of the impacts of the different scenarios considered the consumption curves of the principal energy uses.
Likewise, the analyses considered the effects of using the power transformer. The study also compared the energy use intensity indicators obtained for each scenario with the indicators regulated in R0549-2015. Finally, the impact of savings measures was analyzed using the concept of virtual energy.
3.1 Energy consumption results
The analysis began with the evaluation of global energy consumption across the scenarios. Figure 3 presents the total annual energy consumption associated with each simulation scenario. According to the results, the actual scenario has a yearly energy consumption of 130.42 MWh. Appliances and other plug-in loads account for 76.1% of total consumption. Air conditioning and lighting consumption represent 12.8% and 11.1%, respectively.
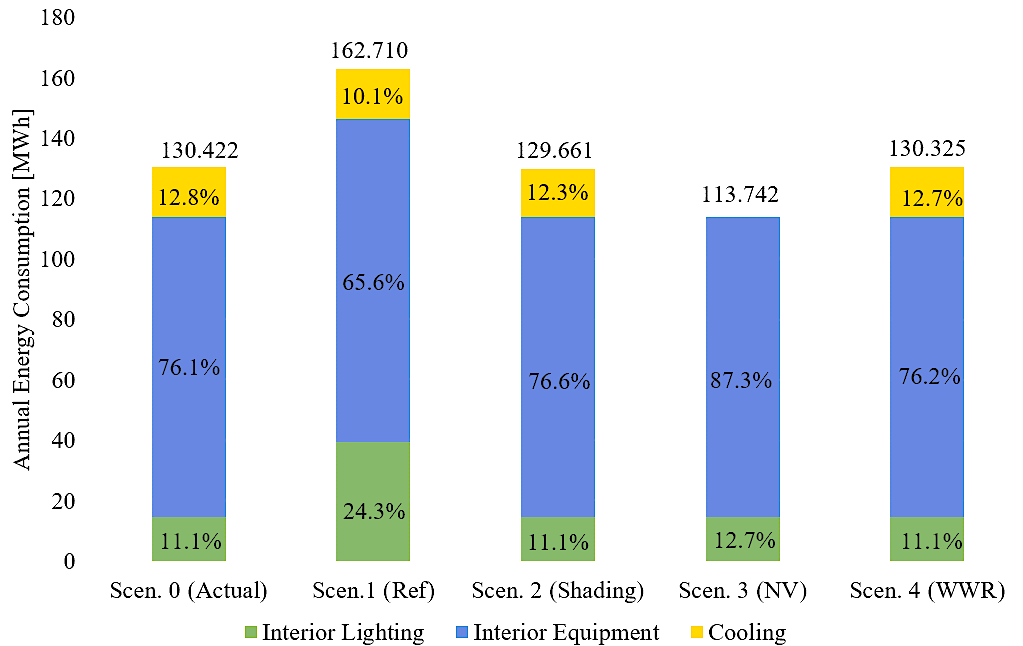
Figure 3.
Annual energy consumption of the different simulation scenarios
Source: own elaboration.
The actual building's energy performance is like that of the building configured with a WWR of 30% (scenario 4) and that of the building with horizontal shading (scenario 2). These results suggest a negligible impact of these measures on the building's energy savings, possibly due to the nocturnal and sectorized operation of the air conditioning systems.
Applying natural ventilation (scenario 3) reveals more significant energy savings than the other scenarios. The annual energy consumption of the building decreases by approximately 13% in the actual scenario. On the contrary, the Reference building scenario presents the highest annual energy consumption (162.71 MWh). This behavior occurs due to less efficient lighting systems and elevators, which are typical stock characteristics. These systems could be the subject of a technological reconversion campaign that makes it possible to improve the energy efficiency of buildings, from which savings of close to 25% in energy consumption would be achieved in the actual scenario.
Compliance with local efficiency standards (R0549-2015) was also evaluated across the study scenarios. Table 5 presents the comparison of the Energy Intensity Index- EII of each scenario with the base indicator of the regulations, taking into account the hot, dry climate (assigned by the local regulations for the AMB) and the tempered climate (determined as the climate of the AMB from of the results of [36]). The latter is included in the analysis since the results of a recent study suggest that the AMB belongs to this climatic zoning.
| Scn. | kWh/m2/year | Baseline (kWh/m2/year) | Hot-Dry [%] | Tempered [%] | |
| Hot-Dry | Tempered | ||||
| 0 | 30.50 | 36.9 | 48.3 | 17% | 37% |
| 1 | 38.06 | -3% | 21% | ||
| 2 | 30.33 | 18% | 37% | ||
| 3 | 26.60 | 28% | 45% | ||
| 4 | 30.52 | 17% | 37% | ||
According to these results, the natural ventilation scenario represents the highest percentage of savings. When considering AMB in a hot-dry climate, the natural ventilation scenario is the only one to satisfy the minimum savings percentage established by the resolution (25% in a hot-dry and temperate climate). For the other scenarios, meeting the savings goal depends on different measures to achieve an additional 8% savings.
The opposite occurs when considering Bucaramanga in a temperate climate. In this case, the real and strategy integration scenarios satisfy the minimum energy-saving requirement.
From the above, climatic zoning greatly influences the savings percentages. For this reason, studies are needed to verify the climatic zoning assigned to the AMB. By validating climatic zoning, it will be possible to evaluate whether the degree of required savings is difficult to satisfy or if the estimated design has good savings characteristics.
3.2 Results of the actual scenario
Figure 4 presents the demand curves and their respective breakdown in energy uses for the actual scenario on the average day of March, the month with the highest solar irradiation of the year according to the climate file.
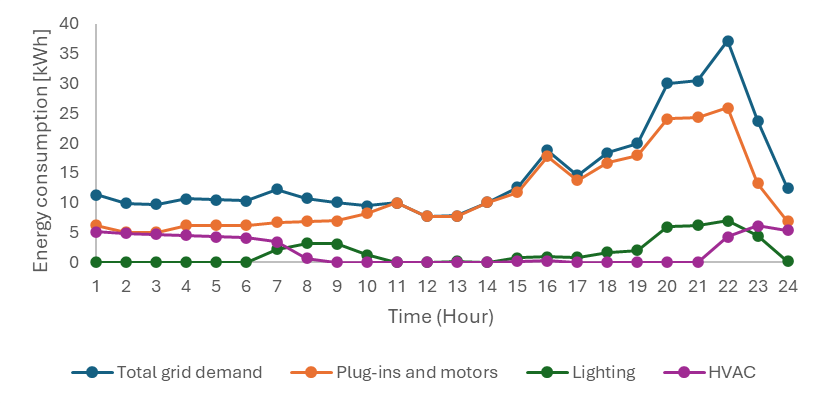
Figure 4.
The hourly curve of the energy demanded the actual scenario
Source: own elaboration.
According to these results, the highest consumption in a typical day occurs between six in the afternoon and midnight. During this period, the building's highest energy demand occurs due to the intensive use of appliances and plug-ins inside the homes. The lighting and air conditioning systems are used (after 10 p.m.).
Considering the previous results, some measures could be proposed to reduce the building's energy consumption. Firstly, an energy awareness campaign aimed at users could reduce the energy consumption of plug-in appliances and motors. Secondly, additional savings could be achieved by improving the efficiency of air conditioning systems or dispensing with them during the early morning hours, the period with the lowest outside temperatures.
Figure 5 compares the demand curves of the actual building (scenario 0) and the reference building (scenario 1). According to the comparison, the building under study has better energy performance than its reference counterpart. The building under study presents an average reduction of 17% in energy consumption compared to the reference one. The most significant savings can be seen between 9:00 a.m. and 10:00 p.m. This behavior may be related to improvements in the efficiency of elevators and the lighting system of the actual building concerning the reference building. Notably, similar occupancy data was used in both cases, so this is not an influencing factor in the comparison.
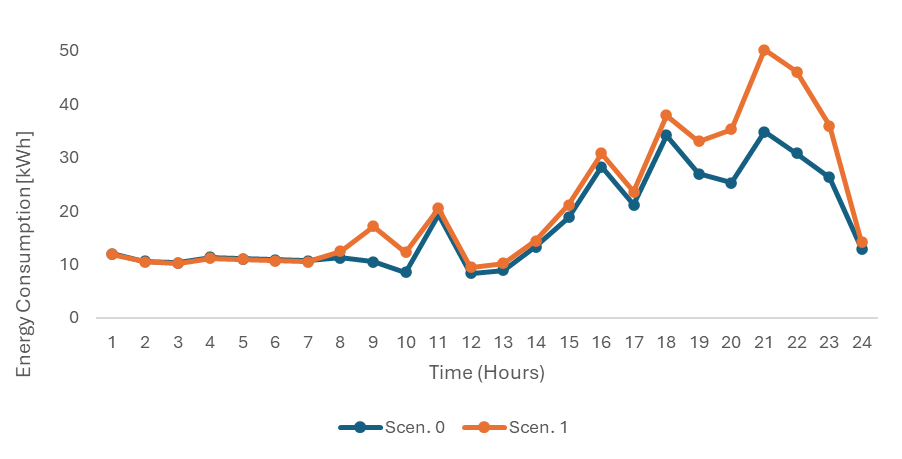
Figure 5.
Comparison of the demand curve of the actual building and the reference building
Source: own elaboration.
3.3 Comparison of the demand curve obtained for the proposed scenarios
Figure 6 compares the time curves of power consumption for the five scenarios presented in Table 4.

Figure 6.
Hourly energy consumption curves for the different simulation scenarios
Source: own elaboration.
As the annual energy consumption results show, the actual scenario (scenario 0) behaves similarly to the scenario with shading (scenario 2) and to the WWR configuration at 30% (scenario 4). This is because there are no appreciable changes in the demand for air conditioning due to the effect of the exterior overhangs since air conditioning use is primarily nocturnal.
On the other hand, increasing the glazing area to 30% (the value recommended by the local standard for medium-income residential buildings) slightly increases the thermal load and, consequently, the air conditioning consumption of air-conditioned spaces. As expected, the natural ventilation scenario does not present consumption due to the absence of artificial air conditioning equipment. Opening windows to satisfy comfort needs in mostly air-conditioned spaces offers an average saving of close to 28% relative to the actual case.
Regarding lighting consumption, the results show a significant variation in behavior in the curve of the Reference building scenario compared to the other scenarios. The hourly energy consumption for lighting in this scenario is approximately 64% higher than the average hourly consumption of the different scenarios. In this case, the lighting could be more efficient.
Equipment consumption behavior is similar in scenarios that consider the characteristics of the actual building. The reference-building scenario presents hourly consumption values that are, on average, 6% higher than those of the other scenarios. This situation occurs due to the use of efficient elevators in the actual building design.
3.4 Transformer loadability analysis
The analysis also included transformer loadability under the different scenarios. Figure 7 presents the results of an analysis of the use of the transformer.
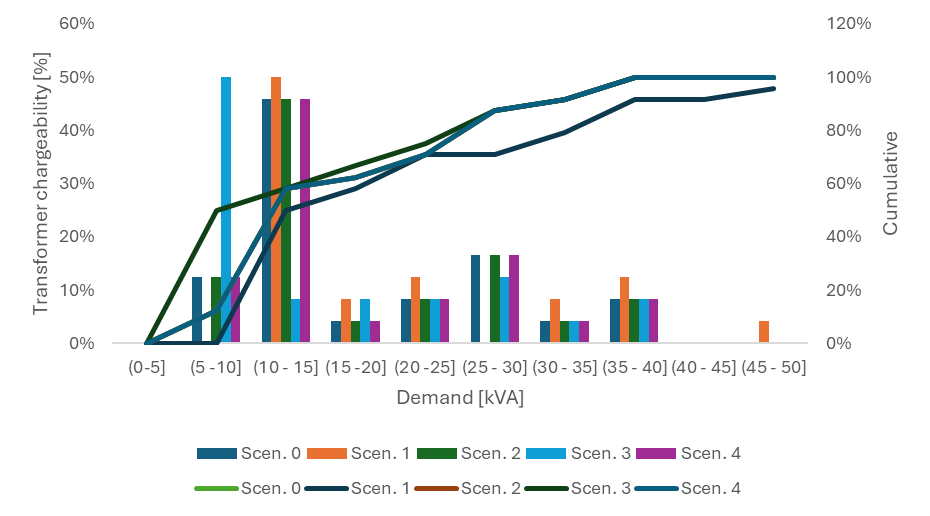
Figure 7.
Transformer chargeability analysis
Source: own elaboration.
The similarity between the demand curves of the actual building scenario, horizontal shading scenario, and WWR of 30% of the scenario causes the cumulative demand curves to overlap. The power demanded from the transformer for these scenarios in each case is between 10 kVA and 15 kVA most of the time (46%). Under these conditions, the transformer operates at a chargeability of 30%. For the case of Scenario 3 (natural ventilation), the demand was between 5 kVA and 10 kVA most of the time. In this case, the load capacity of the transformer can be reduced by an additional 5%.
3.5 Virtual energy assessment
Previous results do not show the impact of measures such as: horizontal shading on windows and increasing the window-to-wall ratio on the building's energy savings and its respective demand curve. Consequently, the study assessed the impact of these measures and natural ventilation based on the virtual energy concept.
This indicator refers to the potential energy used in the building to guarantee comfort conditions (temperatures within the comfort range of 21 and 25 °C). To calculate virtual energy, a standard air conditioning system was defined by the recommendations of tables G3.1.1-3 and G3.1.1-4 of Appendix G of ASHRAE 90.1 of 2019.
In addition to considering shading measures, increasing WWR to 30%, and natural ventilation, the analysis using virtual energy considered three additional scenarios: a scenario that integrates all the measures considered in this study (All Measures) and the actual (Full Air-Conditioning) and reference (Reference Air-Conditioning) scenarios with integration of virtual energy. Figure 8 presents the demand curves for the scenarios considered in this study section.
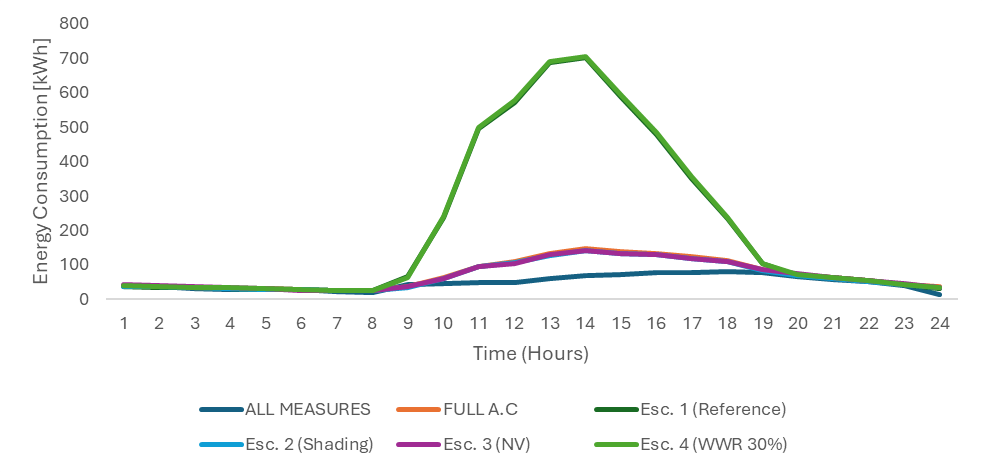
Figure 8.
The energy demand curve for different simulation scenarios considering the continuous presence of air conditioning
Source: own elaboration.
The results of the simulations that consider virtual energy show that the scenarios with a WWR of 30% considerably increase a building's energy consumption during the day. This increase occurs due to increased interior thermal gains through the building's glazing. In practice, these results infer deterioration in thermal comfort inside the homes if such WWR values are considered.
On the other hand, the shading and natural ventilation scenarios behave similarly to the actual scenario under the virtual energy configuration. Horizontal shading on windows does little to reduce the building's energy consumption. Unlike the analysis without virtual energy, the scenario with natural ventilation has a negligible impact because, under the virtual energy configuration, natural ventilation does not occur at the user's request but automatically considers the thermal comfort inside the building.
In contrast, the combined use of all measures enables an average hourly reduction of 43% compared to the actual scenario, which occurs thanks to the greater use of natural ventilation due to the increase in the opening area.
Regarding the information used for the analysis, the strategy adopted to evaluate demand curves based on dynamic simulations has been validated multiple times by other researchers using tools such as TRNSYS [24] and EnergyPlus [32]. Although some authors report on the validation of these models, this study employed DesignBuilder v6 as the simulation platform. This tool combines a user-friendly graphical interface with the EnergyPlus simulation engine, allowing for a detailed representation of building geometry, construction materials, internal loads, and operational schedules. Its high level of customization, compliance with regulatory standards, and extensive documentation make it a suitable choice for assessing the energy performance of residential buildings under different energy-saving scenarios.
Although this study identifies limitations associated with the partial use of the air conditioning system, it is important to note that the scientific literature commonly reports research that quantifies the energy-saving potential of conservation measures under continuous HVAC operation [37]. In such cases, the results tend to be more pronounced, as the impact of passive strategies—such as shading or optimizing the window-to-wall ratio—is more clearly reflected in the reduction of thermal load and overall energy consumption [38], [39]. However, these types of scenarios do not accurately represent the context analyzed in this study, where the air conditioning system operates on a restricted schedule and only in specific zones. Therefore, although the theoretical potential of passive strategies is high, their practical effect is diminished under the real operating conditions of the evaluated building.
To address this limitation, the analysis was complemented by the concept of virtual energy. This approach allowed for the evaluation of the potential contribution of passive measures in a scenario where the building would be required to maintain constant thermal comfort conditions (between 21°C and 25°C). In other words, the building’s energy performance was simulated under the assumption of continuous HVAC operation. This made it possible to more clearly identify the impact of strategies such as increasing the window-to-wall ratio or combining multiple measures, which can lead to energy consumption reductions of up to 43%. These effects would not have been evident in simulations based solely on actual usage, where the individual impact of each strategy was more limited.
Another important factor is the official climate zoning assigned to Bucaramanga. This study relied on the classification established by Resolution R0549-2015 (hot-dry climate); however, recent research suggests that the area may be more accurately characterized as temperate. This discrepancy is significant, as regulatory requirements—and the expected savings thresholds—vary by climate zone. Thus, there is a degree of uncertainty that directly affects the evaluation of compliance with the regulation and warrants further examination in future studies.
The definition of the reference building also represents a critical variable. As in other simulation-based studies, the results largely depend on the selected baseline. A poorly defined reference scenario can either exaggerate or underestimate the impact of the evaluated strategies. In this case, efforts were made to construct a representative scenario based on the existing building stock; nonetheless, a certain degree of arbitrariness is inherent in the definition of such references.
Finally, the transformer load analysis was based on average values, providing a general overview but failing to fully capture the dynamic behavior of the electrical system. Future research should consider installed nominal power and hourly load profiles to better understand how these energy-saving measures affect the building’s electrical infrastructure.
In summary, although the limitations identified do not diminish the value of the findings, they do highlight important aspects that warrant further exploration. In particular, future studies could incorporate more comprehensive economic and environmental assessments, as well as improve the resolution of the electrical analysis, to provide a more holistic view of the impact of efficient design strategies in residential buildings located in tropical climates.
4. CONCLUSIONES
The primary determinant of energy consumption in the scenarios analyzed is plug-in equipment, which represents around 75% of total consumption. The presence of efficient elevators and LED lighting in the actual configuration (scenario 0) produces an approximate saving of 20% compared to the reference scenario (scenario 1). This configuration offers a saving of 17% relative to the baseline of R0549-2015, while under temperate climate conditions, savings can reach close to 37%.
Most scenarios that include energy-saving measures (scenario 2 and scenario 4) present only minor changes in energy demand. Compliance with local regulations requires additional measures. The exception is the natural ventilation scenario (scenario 3), which provides the only significant savings under hot-dry weather conditions.
Comparing scenarios reveals the reference scenario as having the highest energy demand. During much of the daytime, hour-by-hour consumption values are similar across scenarios, but significant differences occur during periods of intensive elevator and lighting use.
The results also demonstrate that energy-saving measures can influence transformer loadability. In this study, savings were achieved through design changes—such as improved ventilation and efficient lighting—without investments in new technologies like solar or wind power. While the transformer load analysis used average consumption values, future assessments could benefit from considering the rated power established in the building’s electrical design, a common recommendation for designing distribution networks in residential buildings. Notably, integrating natural ventilation reduces energy demand and limits transformer loadability by nearly 25% of the time.
Finally, virtual energy analysis shows that the use of artificial air conditioning determines the impact of passive measures on a building’s energy consumption. Combining multiple savings measures generally offers better results than implementing individual ones.
Acknowledgments
The authors thank the Vice-Rectorate for Research and Extension (Vicerrectoría de Investigación y Extensión) from the Universidad Industrial de Santander (Project 3945).
Likewise, thanks to the Construction Cluster of the Bucaramanga Chamber of Commerce (Clúster de Construcción de la Cámara de Comercio de Bucaramanga), which is the entity that supported this research through information on the design and operation of buildings in the Metropolitan Area of Bucaramanga (Área Metropolitana de Bucaramanga).
REFERENCES
[1] REN21, “Renewables 2021 global status report 2021,” París, France, 2021. [Online]. Available: https://www.ren21.net/wp-content/uploads/2019/05/GSR2021_Full_Report.pdf
[2] World Green Building Council, “2018 Global Status Report − Towards a zero‐emission, efficient and resilient buildings and construction sector,” London, 2018. [Online]. Available: https://worldgbc.org/article/2018-global-status-report-towards-a-zero-emission-efficient-and-resilient-buildings-and-construction-sector/
[3] United Nations Environment Programme, “2020 Global Status Report for Buildings and Construction: Towards a Zero-emission, Efficient and Resilient Buildings and Construction Sector,” Nairobi, 2020. [Online]. Available: https://globalabc.org/resources/publications/2020-global-status-report-buildings-and-construction
[4] A. Vieira de Carvalho et al., Guía E: Programas de normalización y etiquetado de eficiencia energética, Washington, DC, USA: Inter-america Developement, 2015. https://doi.org/10.18235/0000225
[5] A. Abd Aziz, D. Sumiyoshi, and Y. Akashi, “Low cost humidity controlled air-conditioning system for building energy savings in tropical climate,” J. Build. Eng., vol. 11, pp. 9–16, May. 2017. https://doi.org/10.1016/j.jobe.2017.03.005
[6] A. Dutta, and A. Samanta, “Reducing cooling load of buildings in the tropical climate through window glazing: A model to model comparison,” J. Build. Eng., vol. 15, pp. 318–327, Jan. 2018. https://doi.org/10.1016/j.jobe.2017.12.005
[7] S. Pathirana, R. Halwatura, and A. Rodrigo, “Sustainable approach to energy rating system for residential buildings,” Asian J. Civ. Eng., vol. 21, no. 8, pp. 1331–1342, Jul. 2020. https://doi.org/10.1007/s42107-020-00280-w
[8] L. De León, D. Mora, C. Carpino, N. Arcuri, and M. Chen Austin, “A Reference Framework for Zero Energy Districts in Panama Based on Energy Performance Simulations and Bioclimatic Design Methodology,” Buildings, vol. 13, no. 2, p. 315, Jan. 2023. https://doi.org/10.3390/buildings13020315
[9] J. Neale, M. Haris Shamsi, E. Mangina, D. Finn, and J. O’Donnell, “Accurate identification of influential building parameters through an integration of global sensitivity and feature selection techniques,” Appl. Energy, vol. 315, p. 118956, Jun. 2022. https://doi.org/10.1016/j.apenergy.2022.118956
[10] H. Wang, and Q. Chen, “Impact of climate change heating and cooling energy use in buildings in the United States,” Energy Build., vol. 82, pp. 428–436, Oct. 2014. https://doi.org/10.1016/j.enbuild.2014.07.034
[11] F. Mohammed Bashir, Y. Aminu Dodo, M. A. Said Mohamed, N. Norwawi, N. M. Shannan, and A. Aghajani Afghan, “Effects of natural light on improving the lighting and energy efficiency of buildings: toward low energy consumption and CO2 emission,” Int. J. Low-Carbon Technol., vol. 19, pp. 296–305, Feb. 2024. https://doi.org/10.1093/ijlct/ctad130
[12] A. Shahee, M. Abdoos, A. Aslani, and R. Zahedi, “Reducing the energy consumption of buildings by implementing insulation scenarios and using renewable energies,” Energy Inform., vol. 7, no. 18, Mar. 2024. https://doi.org/10.1186/s42162-024-00311-9
[13] W. Rattanongphisat, and W. Rordprapat, “Strategy for energy efficient buildings in tropical climate,” Energy Procedia, vol. 52, pp. 10–17, 2014. https://doi.org/10.1016/j.egypro.2014.07.049
[14] K. Mihara, C. Sekhar, Y. Takemasa, B. Lasternas, and K. Wai Tham, “Thermal comfort and energy performance of a dedicated outdoor air system with ceiling fans in hot and humid climate,” Energy Build., vol. 203, p. 109448, Nov. 2019. https://doi.org/10.1016/j.enbuild.2019.109448
[15] A. Dodoo, and A. Joshua, “Effects of Climate Change for Thermal Comfort and Energy Performance of Residential Buildings in a Sub-Saharan African Climate,” Buildings, vol. 9, no. 10, p. 215, Oct. 2019. https://doi.org/10.3390/buildings9100215
[16] S. Mohamed Zaid, E. Perisamy, H. Hussein, N. Elyna Myeda, and N. Zainon, “Vertical Greenery System in urban tropical climate and its carbon sequestration potential: A review,” Ecol. Indic., vol. 91, pp. 57–70, Aug. 2018. https://doi.org/10.1016/j.ecolind.2018.03.086
[17] Z. Huang, Y. Lu, N. Hien Wong, and C. Hock Poh, “The true cost of ‘greening’ a building: Life cycle cost analysis of vertical greenery systems (VGS) in tropical climate,” J. Clean. Prod., vol. 228, pp. 437–454, Aug. 2019. https://doi.org/10.1016/j.jclepro.2019.04.275
[18] Disposiciones Resolución 0549 de 2015, 0549, Ministerio de Vivienda, Ciudad y Territorio de Colombia, Bogotá, Colombia, 2015. [Online]. Available: https://www.minvivienda.gov.co/node/48921
[19] Anexo 1 - Resolución 0549: Guía de construcción sostenible para el ahorro de agua y energía en edificaciones, 0549, Ministerio de Vivienda, Ciudad y Territorio de Colombia, Bogotá, Colombia, 2015. [Online]. Available: https://www.minvivienda.gov.co/system/files/consultasp/anexo-1-guia-de-construccion-sostenible.pdf
[20] J. A. Nieves, A. J. Aristizábal, I. Dyner, O. Báez, and D. H. Ospina, “Energy demand and greenhouse gas emissions analysis in Colombia: A LEAP model application,” Energy, vol. 169, pp. 380–397, Feb. 2019. https://doi.org/10.1016/j.energy.2018.12.051
[21] J. Arias-Gaviria, V. Valencia, Y. Olaya, and S. Arango-Aramburo, “Simulating the effect of sustainable buildings and energy efficiency standards on electricity consumption in four cities in Colombia: A system dynamics approach,” J. Clean. Prod., vol. 314, p. 128041, Sep. 2021. https://doi.org/10.1016/j.jclepro.2021.128041
[22] S. Gou, V. M. Nik, J. L. Scartezzini, Q. Zhao, and Z. Li, “Passive design optimization of newly-built residential buildings in Shanghai for improving indoor thermal comfort while reducing building energy demand,” Energy Build., vol. 169, pp. 484–506, Jun. 2018. https://doi.org/10.1016/j.enbuild.2017.09.095
[23] A. Ioannou, and L. C. M. Itard, “Energy performance and comfort in residential buildings: Sensitivity for building parameters and occupancy,” Energy Build., vol. 92, pp. 216–233, Apr. 2015. https://doi.org/10.1016/j.enbuild.2015.01.055
[24] J. Cárdenas-Rangel, G. Osma-Pinto, and J. Jaramillo-Ibarra, “Energy characterization of residential and office buildings in a tropical location,” Heliyon, vol. 9, no. 5, p. e16048, May. 2023. https://doi.org/10.1016/j.heliyon.2023.e16048
[25] M. Zabaloy, M. Y. Recalde, and C. Guzowski, “Are energy efficiency policies for household context dependent? A comparative study of Brazil, Chile, Colombia and Uruguay,” Energy Res. Soc. Sci., vol. 52, pp. 41–54, Jun. 2019. https://doi.org/10.1016/j.erss.2019.01.015
[26] J. M. Medina, C. M. Rodriguez, M. C. Coronado, and L. M. Garcia, “Scoping Review of Thermal Comfort Research in Colombia,” Buildings, vol. 11, no. 6, p. 232, May. 2021. https://doi.org/10.3390/buildings11060232
[27] A. Arteconi, N. J. Hewitt, and F. Polonara, “Domestic demand-side management (DSM): Role of heat pumps and thermal energy storage (TES) systems,” Appl. Therm. Eng., vol. 51, no. 1–2, pp. 155–165, Mar. 2013. https://doi.org/10.1016/j.applthermaleng.2012.09.023
[28] T. Lang, D. Ammann, and B. Girod, “Profitability in absence of subsidies: A techno-economic analysis of rooftop photovoltaic self-consumption in residential and commercial buildings,” Renew. Energy, vol. 87, no. Part 1, pp. 77–87, Mar. 2016. https://doi.org/10.1016/j.renene.2015.09.059
[29] P. R. S. Jota, V. R. B. Silva, and F. G. Jota, “Building load management using cluster and statistical analyses,” Int. J. Electr. Power Energy Syst., vol. 33, no. 8, pp. 1498–1505, Oct. 2011. https://doi.org/10.1016/j.ijepes.2011.06.034
[30] A. Elnakat, J. D. Gomez, and M. Wright, “A measure to manage approach to characterizing the energy impact of residential building stocks,” AIMS Energy, vol. 4, no. 4, pp. 574–588, May. 2016. https://doi.org/10.3934/energy.2016.4.574
[31] P. Morris, D. Vine, and L. Buys, “Residential consumer perspectives of effective peak electricity demand reduction interventions as an approach for low carbon communities.,” AIMS Energy, vol. 4, no. 3, pp. 536–556, May. 2016. https://doi.org/10.3934/energy.2016.3.536
[32] J. Nelson, N. G. Johnson, P. Tej Chinimilli, and W. Zhang, “Residential cooling using separated and coupled precooling and thermal energy storage strategies,” Appl. Energy, vol. 252, p. 113414, Oct. 2019. https://doi.org/10.1016/j.apenergy.2019.113414
[33] P. Saji Raveendran, and S. Joseph Sekhar, “Experimental studies on the performance improvement of household refrigerator connected to domestic water system with a water-cooled condenser in tropical regions,” Appl. Therm. Eng., vol. 179, p. 115684, Oct. 2020. https://doi.org/10.1016/j.applthermaleng.2020.115684
[34] B. Ouhammou et al., “Energy saving potential diagnosis for Moroccan university campuses,” AIMS Energy, vol. 11, no. 3, pp. 576–611, Jun. 2023. https://doi.org/10.3934/ENERGY.2023030
[35] J. Cárdenas-Rangel, G. Osma-Pinto, and J. Jaramillo-Ibarra, “Improvement proposal of bottom-up approach for the energy characterization of buildings in the tropical climate,” Buildings, vol. 11, no. 4, p. 159, Apr. 2021. https://doi.org/10.3390/buildings11040159
[36] J. Cárdenas-Rangel, J. Jaramillo-Ibarra, and G. Osma-Pinto, “Estimation of the impact of energy efficiency measures recommended by Colombian legislation on the performance of low- and middle-income housing buildings,” J. Build. Eng., vol. 52, p. 104402, Jul. 2022. https://doi.org/10.1016/j.jobe.2022.104402
[37] D. Sekartaji, Y. Ryu, and D. Novianto, “Effect of ventilation patterns on indoor thermal comfort and air-conditioning cooling and heating load using simulation,” City Built Environ., vol. 1, no. 14, pp. 1–24, Sep. 2023. https://doi.org/10.1007/s44213-023-00015-y
[38] D. B. Lu, and D. M. Warsinger, “Energy savings of retrofitting residential buildings with variable air volume systems across different climates,” J. Build. Eng., vol. 30, p. 101223, Jul. 2020. https://doi.org/10.1016/j.jobe.2020.101223
[39] U. Sachinthana Perera, A. U. Weerasuriya, X. Zhang, R. Ruparathna, M. G. I. Tharaka, and C. S. Lewangamage, “Selecting suitable passive design strategies for residential high-rise buildings in tropical climates to minimize building energy demand,” Build. Environ., vol. 267, no. Part B, p. 112177, Jan. 2025. https://doi.org/10.1016/j.buildenv.2024.112177
Notes
The authors declare that they have no conflict of interest.
Jorge Cárdenas-Rangel: conceived and designed the experiments, performed the experiments, analyzed and interpreted the data, contributed reagents, materials, analysis tools, wrote the paper.
Julián Jaramillo-Ibarra: conceived and designed the experiments, performed the experiments, analyzed and interpreted the data, contributed reagents, materials, analysis tools.
German Osma-Pinto: conceived and designed the experiments, performed the experiments, analyzed and interpreted the data, contributed reagents, materials, analysis tools
Notas de autor
gealosma@uis.edu.co
Información adicional
How to cite / Cómo citar: J. Cárdenas-Rangel, J. Jaramillo-Ibarra, and G. Osma-Pinto, “Influence of Energy Conservation Measures on the Load Profile of Homes in a Tropical Climate: Case Study in Bucaramanga, Colombia,” TecnoLógicas, vol. 28, no. 63, e3383, 2025. https://doi.org/10.22430/22565337.3383
Información adicional
redalyc-journal-id: 3442
Enlace alternativo
https://revistas.itm.edu.co/index.php/tecnologicas/article/view/3383 (html)