Artículos / Papers
Mapeamento da inundação por LSWI e caracterização dos fluxos d’água na bacia do Alto Paraguai, Pantanal norte, Brasil
Flood mapping by using land surface water index and water flow characterization in the Pantanal, Brazil
Mapeamento da inundação por LSWI e caracterização dos fluxos d’água na bacia do Alto Paraguai, Pantanal norte, Brasil
Revista Geográfica Venezolana, vol. 60, núm. 1, pp. 92-105, 2019
Universidad de los Andes
Recepción: 15 Julio 2017
Aprobación: 15 Julio 2018
Resumo: Este estudo mapeou a variação espacial e temporal da inundação e caracterizou o fluxo de água no Pantanal. Usando as imagens MODIS de resolução moderada (MODIS), o Índice de Água na Superfície Terrestre (LSWI) foi calculado com dados validados a partir do modelo de regressão logística e para contextualizar os períodos hidrológicos foi adaptada a classificação de imagem de Macalister e Mahaxay (2009). Os resultados indicaram que até 67% do território pode ser inundado com uma confiabilidade de 96%. Na análise temporal, o mês de dezembro foi caracterizado por inundações, com uma área inundada média de 106.842 hectares, que em março, no período de inundação, atingiu 502.561 hectares, em abril, no período de vazante, totalizaram 343.059 hectares e na seca, a área inundada era de 89.573 hectares, referindo-se somente a cursos de água permanentes. A relação entre precipitação e transbordamento lateral dos rios da planície de inundação foi confirmada.
Palavras-chave: área úmida, Pantanal, Índice de Água na Superfície Terrestre, MODIS, geotecnologia.
Abstract: This study mapped the spatial and temporal variation of flood and characterized the water flow in the Pantanal. By means of Moderate Resolution Imaging Spectroradiometer (MODIS) images, the Land Surface Water Index (LSWI) was calculated with use of data validated from the Logistic Regression Model with the points determined in the field, and in order to contextualize the hydrological periods, the image classification technique of Macalister and Mahaxay (2009) was adapted. LSWI results indicated that up to 67% of the territory can be flooded with a reliability of 96%. In the temporal analysis, December was characterized by flooding, with an average flooded area of 106,842 hectares, which, in March, in the flood period, reached 502,561 hectares, in April, in the ebb period, totalized 343,059 hectares and in the drought, the flooded area was 89,573 hectares, referring only to permanent water courses. The relationship between rainfall and lateral overflow of the rivers of the floodplain was confirmed.
Keywords: wetland, Pantanal, the Land Surface Water Index (LSWI), MODIS, geotechnology.
1. Introduction
Pantanal is an alluvial plain subjected to monomodal annual floods of varying amplitudes (Caovilla, 2011; Rebellato et al., 2012), and the beginning of the flood in the north of the plain coincides with the beginning of constant rainfall events in December, while in the central and southern part of the plain there may be lags of up to 3 months between the peak of rainfall events (February/ March) and the maximum of the floods. Along river courses, flooding of the lowlands is mainly guaranteed by river overflow from intermittent canals. In places far away or with little influence of the river flow, floods can also be triggered by local rainfall (Penha et al., 1999).
In this sense, the flood pulse varies in time and space in this territory, according to climatic, geomorphological and hydrological characteristics (Marcuzzo et al., 2010). Studies performed in Northern Pantanal indicate that the flood cycle is correlated with the local rainfall periods and its surroundings, and that the dry periods lead to lowering of water and the disappearance of intermittent watercourses. The floods can also be attributed to the physical factors of the regional relief (Abreu et al., 2008; Paz, 2010).
It is worth mentioning that this hydrological dynamics of floods and droughts are fundamental to the maintenance of the patterns and processes of the Pantanal ecosystems (Junk et al., 1989; Junk et al., 2011). The species distribution and diversity vary within and between the different habitats arranged along the flood gradient, from non-flooded to seasonally and permanently flooded (Silva et al., 2001; Junk et al., 2011).
Although floods are annual, this process is not well understood. According to Padovani (2010), this is mainly due to the lack of use of analysis methods and technologies to continuously characterize and monitor this environment, as well as allowing to draw scenarios and predictions of the behavior of the system as a whole.
Remote sensing is one of the possibilities for analysis and monitoring of flooding in floodplains (Hunag et al., 2014), since it favors a synoptic approach, adequate to large areas and difficult to access, where its techniques allow a continuous and non-intrusive collection of data from large areas of the earth surface (Curtarelli et al., 2013). In addition, it is possible to investigate long periods of time since they are dynamic resources that increase the capacity of mapping and analysis (Samizava, 2009; Oliveira et al., 2010).
In this way, this study aimed at performing the spatial and temporal mapping of the flood, besides characterizing the water flows in Northern Pantanal. It is known that the understanding of the floodplain dynamics can provide subsidies for the formulation of public policies related to the conservation of wetlands.
2. Material and methods
2.1 Characterization of the study area
The Upper Paraguay River Basin comprises an area of 362,376 km² in the Brazilian territory (ANA, 2004), composed of the plain and adjacent plateaus, which constitutes an area of 214,802 km². In these plateaus, with elevations of over 200 m, are the springs of the Pantanal rivers (Galdino et al., 2006; Fantin-Cruz et al., 2010); the main rivers include Paraguay, São Lourenço, Cuiabá, Taquari, Aquidauana, Negro and Miranda (Albuquerque, 2008). When these rivers reach the plain, they are invariably associated with intermittent lakes and watercourses formed by depressions in the terrain that drain the water in the flood period, being locally called Vazantes and Corixos.
The floodplain analyzed (FIGURE 1) covers frag- ments of the São Lourenço Norte, São Lourenço-Sul, Piquiri-Itiquira, Bento Gomes and Chacororé wetlands according to the Pantanal subregions established by Padovani (2010). The main courses that drain the studied quadrant are the São Lourenço, Cuiabá and Mutum rivers.
The climate of the Pantanal region (FIGURE 1) is tropical humid, with dry winters (dry season) and rainy summers (wet season). The mean temperature is 24 to 26 °C, with annual rainfall ranging from 1000-1600 mm (Alvares et al., 2014). The predominant soils are Latosol, Argisol, Planosol, Nitosol and Vertisol (Santos et al., 1997).
The use and occupation of the land present different classes, highlighting the Savannah Ecotone, Deciduous Seasonal Forest, Semideciduous Seasonal Forest, Pioneer Formations, Savannah (Cerrado), Savannah Estépica (Chaco), deforested areas (for livestock and agriculture), permanent bodies of water (MMA, 2007).
2.2 Methodological procedures
Data of rainfall and flow of the Cuiabá and São Lourenço rivers were obtained from the Hydroweb database of the National Water Agency (ANA) and similar studies (Fantin-Cruz et al., 2010; Salgado, 2011). Data from a 15-year time series (01-01-2000 to 01-12-2014) were used for the Barão de Melgaço station (01655002) and Acima do Córrego Grande station (01655001). The flow data were analyzed for the Cuiabá (66280000) and São Lourenço (66460000) rivers.
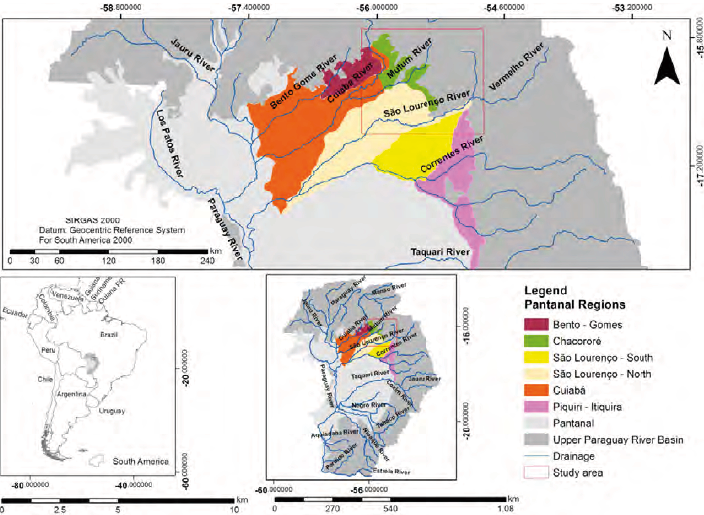
FIGURE 1
Location map of the studied quadrant with reference in South America, Upper Paraguay River basin and the Pantanal regions and source: South American boundary (IBGE, 2011); Pantanal Regions (Padovani, 2010); Drainage network (ANA, 2015). Org.: Alves, 2015
We obtained TOPODATA images referring to the altimetry of the studied quadrant from the Brazilian Geomorphometric Database (INPE, 2011). This geographic information is compatible with the mappings in the 1: 250,000 scale, kriging-interpolated in Brazil from 90 m to 30 m (Valeriano e Rossetti, 2008). The scenes (15S57_ZN, 15S555_ZN, 16S57_ZN and 16S555ZN) for the study area were imported into the ArcGIS Geographic Information System (GIS) database, based on the WGS84 System.
Initially, the contour lines with equidistance of 30 and 40 meters were extracted. Then, the Delaunay interpolation method with constraints based on triangulated irregular network (TIN) was performed. The Delaunay triangulation method is a set of irregularly distributed points in space, generating a digital terrain model (Sena et al., 2012). As a result, a lifting chart was generated by slicing the image with a scale of 30 and 40 m.
In order to perform the altimetric analyses of the study area, the values of elevation of a digital altimeter (Oregon RA-123) and the GPS coordinate data (Garmin 62) obtained in the field collections were used as reference data. This information helped to recognize potentially floodable areas, emphasizing the use of physical characteristics that evidenced flood-prone areas, due to the fact that floods are more frequent in areas of low altitudes. With spatial resolution images of up to 1 m from Google Earth Pro Software for the year 2015 and images acquired by GeoEye IKONOS in 2014, available in the form of ArcGis 10.2.2 SIG basemaps, the vectoring of the water bodies that supplied the region of the study quadrant was executed. The following geographical data were established: corixos, meanders, streams and rivers (FIGURE 2). Using the software Google Earth Pro, we performed the vectorization of the water bodies of the region, with the following data established: corixos, meanders, streams and rivers (FIGURE 2).
For higher reliability, we used the database of the Ministry of Environment (MMA, 2003) with the drainage networks of the Paraguay River basin with scale of 1: 250,000 in vector format. We also obtained the HYDROSHEDS database drainage model, available at http://hydrosheds.cr.usgs.gov/. This information was correlated with the extracted drainage basin, which were later redesigned from the high-resolution images of Google Earth in 2013.
For the elaboration of the direction of the water flow during the flood, we considered the analysis of the physical structure of the terrain and the drainage network previously extracted. In addition, interviews were conducted with 23 informants (residents) in that territory, according to the methodology used by Neves & Domingues (2007). To validate the data, we used the Digital Elevation Model (TOPODATA) and Geographic Information System (GIS) Global Mapper11 for delimitation of flows and direction of water in the analyzed quadrant.
The flood maps of the quadrant were made from the temporal series of images MOD13Q1, version 5, with a spatial resolution of 250 meters; 16-day temporal resolution and spectral resolution of four reflectance bands (blue, red, NIR and MIR). According to Padovani et al. (2011), this product is best suited for the mapping of Pantanal flood dynamics, since the MODIS sensor has a spectral resolution overlap with the Landsat, Aster and CBERS-2 satellites, meaning that the data are comparable and can be complementary, besides the elimination of clouds and the atmospheric correction.
The Land Surface Water Index (LSWI) was calculated for the years 2010 and 2011, based on the methodologies used by Gao (1996) and Silveira (2015), using the NIR, MIR and pixel reliability bands and VI quality with calculations via Geographic Information System (ArcGis 10.2). The
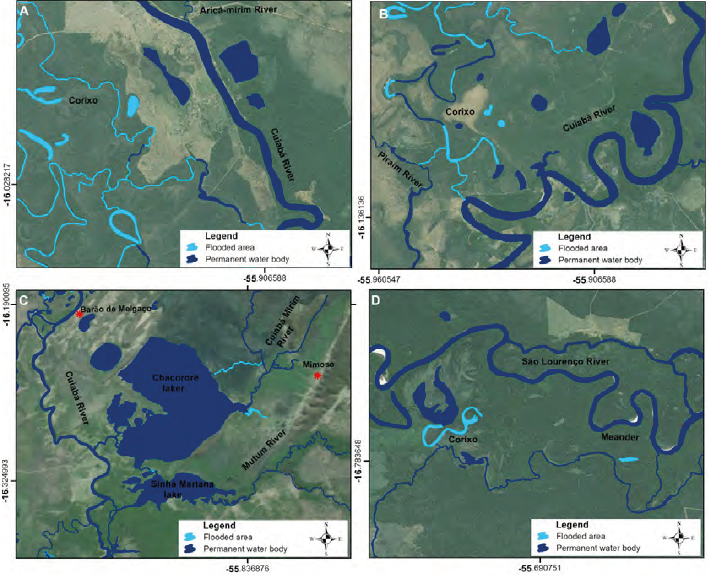
FIGURE 2
Corixo, Aricá-Mirin River, Cuiabá River (A); Corixo, Piraim River, Cuiabá River (B); Cuiabá River, Chacororé Lake, Sinhá Mariana Lake, Mutum River, Cuiabá Mirim River (C); Corixo, São Lourenço River, Meander (D) and All images were acquired from Basemap ArcGIS 10.2.2
LSWI values were calculated excluding the lower quality pixels within the studied quadrant, using the following formula:
LSWI = NIR – MIR / NIR + MIR
Where pNIR is the near infrared reflectance value (841 - 875 nm) and short wave infrared pSWIR (1628 - 1652 nm).
From the data collected in the field and the interviews with the residents, we adapted the image classification technique of Macalister and Mahaxay (2009), which allowed us to contextualize periods of flooding, high, falling and dry.
Alves et al. (2015) with the support of a Garmim GPS 62 and interviews with residents of the study area, reported that altimetric heights higher than 200m do not suffer from flood dynamics. Thereby, the geographic results obtained from the LSWI were correlated with the terrain elevation lower than 200 meters data. In addition, was performed the crossing of the data referring to the permanent water courses registered in the studied quadrant. At the end of these processes was elaborated in GIS, the flood dynamics chart.
The Logistic Regression Model was used to validate the performance of the flooded and non-flooded areas of the quadrant, using data collected in the field (129 points) and spectral values extracted by the LSWI Index for the same period. The exported data were treated with filters to perform logistic regression, using LSWI with continuous variable, and flood as a categorical variable (flooded = 1, not flooded = 0). In addition to the validation, the use of logistic regression had the advantage of eliminating arbitrariness in the definition of the LSWI classes, directly defining the probability of an area being flooded as a func- tion of the value of the LSWI, as well as allowing the calculation of the confidence interval in this estimate. Logistic regression can be defined by the following equation:

In which, g (Pi) is the linkage function, Pi is the probability of response for the ith factor (or co-va- riant), βi are coefficients, and Xi are the independent variables.
This information was imported into the ARGIS 10.2 database, where the spectral signatures of the MODIS images (LSWI) were extracted for the months and geographical locations of the field collections.
3. Results and discussions
3.1 Rainfall and river level variations
The highest monthly rainfall averages were observed in January (231.9 mm), February (245 mm) and March (215 mm), and the lowest values in July (12.2 mm) and August (17.2 mm), according to records of the Acima do Córrego Grande station. The average flow rate of the São Lourenço River followed the same temporal trend of local rainfall, thus, the highest rainfall was accompanied by the higher water volumes (368.5 m³/s); in February and March this volume increased to 442.5 m³/s and 444.5 m³/s, respectively (FIGURE 3A); in April, there was decrease (331.2 m³/s) during the water ebb. The lowest flows of the São Lourenço River were verified in September (141.8 m³/s) and August (141.8 m³/s), (FIGURE 3A).
The historical series of the second station (Barão de Melgaço) considered here showed that the highest rainfall averages similarly occurred in January (216.8 mm) and March (184.9 mm) and the lowest rainfall occurred in August (9.7 mm) and June (17 mm). The average variation of the Cuiabá River flow also followed the dynamics of rainfall variation, and in January this water course began to increase its water volume (287.3 m³/s); in February, the flow was 393.8 m³/s, and in March, reached the maximum value, 445 m³/s. In the month of April, the flow tended to decrease (397.4 m³/s), following the reduction in local rain fall (FIGURE 3B). The periods with the lowest flows occurred in September (85.2 m³/s) and August (89 m³/s) (FIGURE 3B). The Cuiabá and São Lourenço rivers presented average flow of 212 m³/s and 247 m³/s, respectively.
3.2 Influence of terrain elevation on flood dynamics
The digital elevation model produced for the quadrant area defined an area of 1,252.072 hectares and allowed to observe the occurrence of three different topographic units and to correlate them with the flood of the region. The first corresponds to flat lands with low altimetry, varying between 100 and 200 m, located in the region adjacent to the Sinhá Mariana and Chacororé bays, in the western portion of the quadrant, which was sub- jected to floods or corresponds to permanent water bodies (FIGURE 4 A AND B). This area of the studied quadrant totaled 753,328 hectares.
The second unit corresponds to the plateau (438,452 hectares), with altimetric variation greater than 500 m. It is located to the northeast and east of the studied quadrant and represent regions of springs of the main tributaries that influence the Pantanal plain, therefore these areas are not subjected to flood. In turn, the third unit (78,292 hectares) located in the central portion between the plain and plateau, has elevation between 200 and 500 m. No flooding occurred in this area (FIGURE 4C).
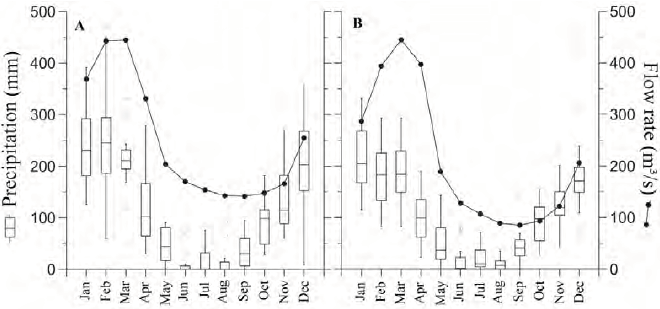
FIGURE 3
A) Monthly variation of rainfall recorded at the Acima do Córrego Grande station and flow of the São Lourenço River and (B) rainfall at the Barão de Melgaço station and flow of the Cuiabá River
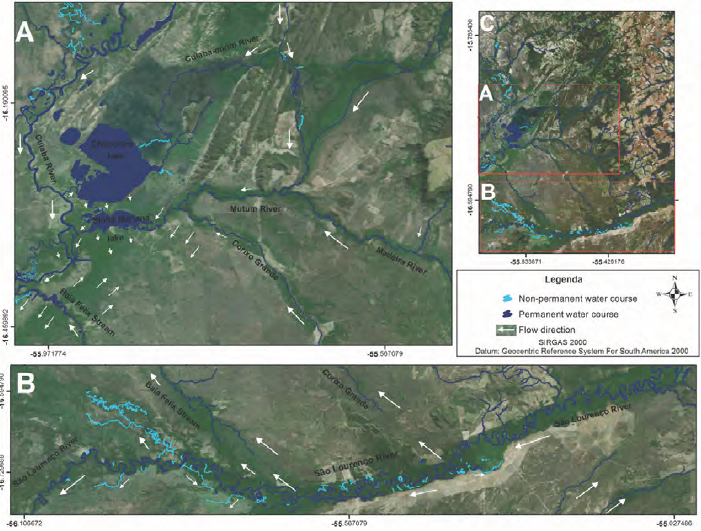
FIGURE 4
Diagram with arrows representing the flow and direction of the water during the flood process in the plain (A and B) and the location of the study quadrant plateau (C) and all images acquired from Basemap ArcGIS 10.2.2
According to Pereira et al. (2012), the Pantanal is characterized by low hypsometric values with small variations in the topographic gradient, and by large plains that are flooded in the rainy season. Similarly, some authors report that the floods that occur in the Pantanal plain are related to physical factors, such as the rock formations on its surface and the slope of the region, which, because of its small size, contributes to the high water retention on the soil surface (Abreu et al., 2008;Paz, 2010).
In this sense, analyzing the flatlands of the plain of the studied quadrant, we determined that the flood processes are due to local rainfall, and also by lateral overflow of the main water courses that drain this region, that is, the Cuiabá, São Lourenço, Mutum, Baía do Félix and Corixo Grande rivers, according to the direction of the water flows shown in FIGURE 4A AND B.
Girard et al. (2003) reported that most of the waters entering the Northern Pantanal are derived from three main water courses: Paraguay, São Lourenço and Cuiabá. In addition to flooding from rivers, there is backflooding, which delays the drainage of water accumulated by rainfall (Hamilton et al., 1996).
During the rainy season, the flow rates of the Cuiabá and São Lourenço rivers increase, causing the water flows of these water courses to flow to other smaller channels, which do not support the flow and overflow laterally (FIGURE 4A). This information coincides with the studies of Girard et al. (2003) and Paranhos Filho et al. (2014), which report that the flows of the Pantanal rivers are greater upstream than downstream. Thus, it is frequent to overflow the waters from the main channel to the smaller channel and the retention of this volume of water in the depressions of the plain.
Zeilhofer and Moura (2009) argue that floods do not start gradually, but begin when water levels of the main channel increase, with subsequent flooding of the connecting channels. Likewise, in the central part of the studied quadrant, the influence of the floods is due to the waters of the Cuiabá and São Lourenço rivers.
The São Lourenço River and its tributaries influence the flood to the south, southeast and center of the studied territory, where the waters overflow laterally the main water course and come to flood the marginal areas. In the central part, the water enters through the Baía do Felix and Corixo Grande streams. These streams have reduced flow rates but are important for the occurrence of flood in the region (FIGURE 4B). In agreement with Padovani (2010), the flooding process in this region is due to local rainfall, in addition to receiving waters from the sub-regions of the pla- teau, especially the Piquiri-Itiquira rivers which is supplied by Correntes, Piquiri and Itiquira rivers. These water courses are important tributaries for the São Lourenço River.
To the northeast of the plain there is mainly flooding due to local rainfall and lateral overflow of the Mutum River. Moreover, the floods from the Cuiabá River, in the north-south direction of the quadrant, occur through the entry of water in Chacororé Bay, passing through Sinhá Mariana Bay (FIGURE 4A). The increase in the water level in these lakes is also related to the flooding of the adjacent fields.
3.3 Use of the Land Surface Water Index (LSWI) for flood analysis
Between 2010 and 2011, up to 66.70 % of the flat area (753,328 ha) of the quadrant was subjected to flooding. The logistic regression results showed a reliability of the LSWI data of 96 % of the areas classified as flooded.
The month of December (2010) was characterized as the beginning of the flood. At that time, the region began to receive water from neighboring sub-regions (São Lourenço Norte and Cuiabá), as well as local rainfall, resulting in a flood of 106,842 hectares (14.20 %) for this period (FIGURE 5A). At maximum flooding, during the flood (March, 2011), the waters tended to overflow laterally the channel of the rivers, flooding an area of 502,561 hectares (66.7 %) (FIGURE 5B).
In accordance with Padovani (2010) and Negrelle (2013), these floods stem from the accumulation of rainwater, by the water supply from the adjacent plateau, where the headwaters of the rivers of the Upper Paraguay Basin are located; and by the slow and difficult surface runoff of the water courses, corixos and ebb flowing, and by the elevation of the water table. Interviews with residents of the region corroborate our argument that local rainfall strongly influences the process of flooding in the studied quadrant, occurring between December and April. The study carried out in the Pantanal floodplain by Muniz (2010) shows that this hydro- logical dynamic leads to the formation of bays that, during the dry season, remain connected or not to the river.
In the ebb period (April 2011), rainfall decrea- ses along with the volume of river waters, so that the waters begin to leave the sub-regions of the analyzed quadrant and eventually reduce the flooded areas. During this hydrological period, there is the flood of 45 % (343,059 hectares) of the territory (FIGURE 5C). The ebb period coincides with the dry season, from May to September with reduced rainfall volumes (Cunha et al., 2006).
During the dry period (August 2011) the LSWI analysis revealed that the fields are not flooded, and surface water remains only in permanent water courses, which totaled 89,573 hectares, corresponding up to 7 % of the total area (FIGURE 5D). During this period, there are reduced local or regional rainfall events and consequently there is no flooding. According to Goulart et al. (2015), between April and September, there is a lowering of surface waters of the Northern Pantanal and the appearance of the fields that serve as pasture for the animals.
In the territory of the quadrant, it was evident that the flood pulse has enormous social and environmental influence on the Pantanal people. The flood period is especially complicated, when the Pantanal people suffer from difficulties in managing livestock, since floods make it difficult to travel and affect the availability of food. However, drought can also be a limiting factor in cattle fattening, which makes cattle ranching an activity of great complexity although it is the main economic source in the Pantanal.
Finally, within a human ecological perspective, this hydrological dynamic influence deeply the daily life of the residents, making the traditional communities explore different habitats within the Pantanal territory in the different periods of time (Pignatti & Castro, 2010; Caovilla, 2011).
Thus, traditional communities create alternatives for survival in the floodplain areas of the Pantanal. We emphasize the importance of the annual water dynamics for the maintenance of biodiversity and ecological systems, as well as their economic roles; making it necessary to protect them in order to have a balance between economic practices and the environment.
Our findings confirm the potential of the geotechnologies as tools to aid in the storage, analysis and mapping of the flood process. Further, the combined use of LSWI assisted in the interpretation and understanding of the hydrological variation of the Pantanal and made it possible to associate them with the daily life of the Pantaneiro people.
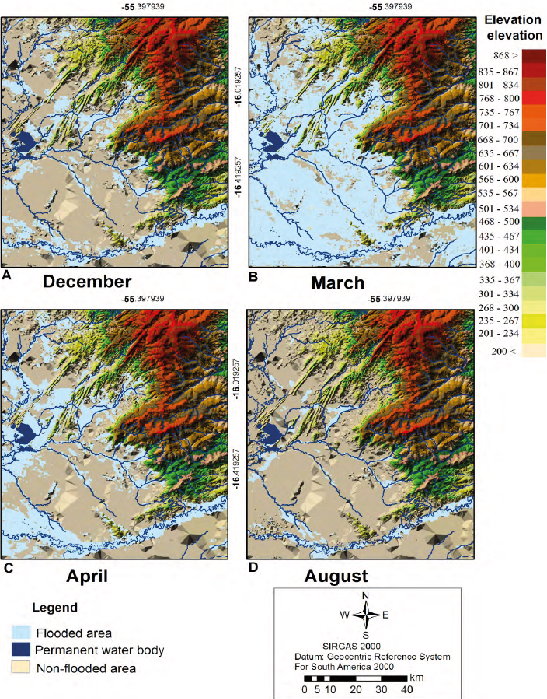
FIGURE 5
Maps with the LSWI classes for the dates of (A) December 2010 (flooding), (B) March 2011 (high), (C) April 2011 (falling) and (D) August 2011 (dry)
4. Conclusions
The flows and direction of water inflow in the Pantanal field of the studied quadrant are related to rainfall and lateral overflow of the São Lourenço, Cuiabá, Mutum rivers, and tributaries.
Data obtained from the LSWI of the MODIS images made it possible to map in the space and over time (2010-2011) the areas prone to flooding in the lowlands. Thus, the plain of the studied quadrant has about 67% of its total area subjected to flooding. The highest values of the Land Surface Water Index (LSWI) occurred in the flood period and the lowest in the dry period.
The use of TOPODATA image provided a range of valuable information in the complementary analysis of flood. DEM allowed to analyze the physical variations of the relief (topography and drainage) and to document the occurrence of three elevation levels (plateau, plain and interphase between these two), in which the flat areas are prone to suffer from the flooding of the rivers.
We have also shown that the flood pulses of the Pantanal are responsible for the variation of the landscape, forcing the Pantaneiro people to adapt to the adversities that have arisen during each hydrological phase, since most of the society in the region lives on agriculture and tourism.
In general, the research contributed to obtaining relevant information to understand the dyna- mics of the local flood, making it possible for the community and among other decision-makers to recognize the areas that are subjected to flooding. This understanding facilitates the accomplish- ment of territorial planning according to social, environmental and economic needs.
References
ABREU, U. G. P.; GOMES, E. G.; LOPES, P. S.; TORRES, R. A. e H. N. SANTOS. 2008. “Avaliação sistêmica da introdução de tecnologias na pecuária de gado de corte do Pantanal por meio de modelos de análise envoltória de dados (DEA)”. Revista Brasileira de Zootecnia, 37(11): 2.069-2.076.
ALBUQUERQUE, A. C. S. e A. G. SILVA. 2008. Agricultura tropical: quatro décadas de inovações tecnológicas, institucionais e políticas. Embrapa. Brasília, Brasil.
ALVARES, C. A.; STAPE, J. L.; SENTELHAS, P. C.; GONÇALVEZ, J. L. M. & G. SPAROVEK. 2014. “Köppen’s climate classification map for Brazil”. Meteorologische Zeitschrift, 22(6): 711-728.
ALVES, G. M.; LOVERDE-OLIVEIRA, S. M. e R. L. OLIVEIRA. 2015. Uso combinado dos índices LSWI e NDVI para análise da inundação na bacia do rio Mutum (Pantanal Norte). XXI Simpósio Brasileiro de Recursos Hídricos. pp. 1-7. Brasília, Brasil.
AGÊNCIA NACIONAL DE ÁGUAS (ANA). 2004. Implementação de práticas de gerenciamento integrado de bacia hidrógrafica para o Pantanal e bacia do alto Paraguai. Brasil.
AGÊNCIA NACIONAL DE ÁGUA (ANA). 2015. Dados Hidrológicos. Disponível em: http://www. http://hidroweb.ana.gov.br/ htm. [Consulta: maio, 2015].
CAOVILLA, F. C. 2011. Comportamento da umidade do solo em floresta de cambará e pastagem no Pantanal Mato-grossense. Universidade Federal de Mato Grosso. Cuiabá, Brasil. Dissertação de Mestrado.
CUNHA, C. N.; RAIWEL, P.; WANTZEN, K. W.; JUNK, W. J. & A. LEMES DO PRADO. 2006. “Mapping and characterization of vegetation units by means of Landsat imagery and management recommendations for the Pantanal of Mato Grosso (Brazil), north of Poconé”. Amazoniana, 19(1/2): 1-32.
CURTARELLI, M. P.; ALCÂNTARA, E. H.; ARAÚJO, C. A. S.; STECH, J. L. e J. A. LORENZZETTI. 2013.“Avaliação da dinâmica temporal da evaporação no reservatório de Itumbiara, GO, utilizando dados obtidos por sensoriamento remoto”. Revista Ambiente & Água, 8(1): 1-18.
FANTIN-CRUZ, I.; GIRARD, P.; ZEILHOFER, P.; COLLISCHONN, W. e C. N. CUNHA. 2010. “Unidades fitofisionômicas em mesoescala no Pantanal Norte e suas relações com a geomorfologia”. Biota Neotropical, 10(2): 31-38.
GALDINO, S.; VIEIRA, L. M. e L. A. PELLEGRIN. 2006. Impactos ambientais e socioeconômicos na bacia do rio Taquari - Pantanal. Embrapa Pantanal. Brasil.
GAO, B. C. 1996. “NDWI - A Normalized Difference Water Index for remote sensing of vegetation liquid water from Space”. Remote Sensing of Environment, 58: 257-266.
GIRARD, P.; SILVA, C. & M. ABDO. 2003. “River-groundwater interactions in the Brazilian Pantanal. The case of the Cuiabá River”. Journal of Hydrology, 283: 57-66.
GOULART, M. A.; SANCHES, L.; VILANI, M. T. e O. B. P. JÚNIOR. 2015. “Análise da evapotranspiração por wavelet de Morlet em área de Vochysia divergens Pohl no Pantanal”. Revista Brasileira de Engenharia Agrícola e Ambiental, 19(2): 93-98.
HAMILTON, S. K.; SIPPEL, S. J. & J. M. MELACK. 1996. “Inundation patterns in the Pantanal wetland of South America determined from passive microwave remote sensing”. Archiv für Hydrobiologie, 137(1): 1-23.
HUNAG, C.; CHEN, Y. & J. WU. 2014. “DEM-based modification of pixel-swapping algorithm for enhancing floodplain inundation mapping”. International Journal of Remote Sensing, 35(1): 365-381.
INSTITUTO BRASILEIRO DE GEOGRAFIA E ESTATÍSTICA (IBGE). 2011. Downloads Geociências. Disponível em: http://downloads.ibge.gov.br/downloads. [Consulta: abril, 2014].
INSTITUTO NACIONAL DE PESQUISAS ESPACIAIS (INPE). 2011. TOPODATA: Banco de Dados Geomorfométricos do Brasil. Disponível em: http://www.dsr.inpe.br/topodata/index.php. [Consulta: setembro, 2014].
JUNK, W. J.; BAYLEY, P. B. & R. G. SPARKS. 1989. “The flood pulse concept in river floodplain system”. Canadian Special Publication of Fisheries and Aquatic Sciences, 106: 110-127.
JUNK, W. J.; DA SILVA, C. J.; NUNES DA CUNHA, C. & K. M. WANTZEN. 2011. The Pantanal: Ecology, biodiversity and sustainable management of a large neotropical seasonal wetland. Pensoft Publishers. Sofia, Moscow.
MACALISTER, C. & M. MAHAXAY. 2009. “Mapping wetlands in the Lower Mekong Basin for wetland resource and conservation management using Landsat ETM images and field survey data”. Journal of Environmental Management, 90(7): 2.130-2.137.
MARCUZZO, F. F. N.; CARDOSO, M. R. D.; COSTA, H. C. e D. C. R. MELO. 2010. Anomalias na precipitação pluviométrica no bioma do Pantanal Sul-Mato-Grossense. 3º Simpósio de Geotecnologias no Pantanal. pp.1-12. Cáceres, Brasil.
MISTÉRIO DO MEIO AMBIENTE (MMA). 2003. Dados Geográficos. Disponível em: http://mapas.mma.gov.br/i3geo/datadownload.htm. [Consulta: agosto, 2016].
MISTÉRIO DO MEIO AMBIENTE (MMA). 2007. Vegetação da bacia do Alto Paraguai. Brasil. Disponível em: http://mapas.mma.gov.br/geonetwork/srv/br/main.home. [Consulta: agosto, 2016].
MUNIZ, C. C. 2010. Avaliação do papel do pulso de inundação sobre a riqueza e biodiversidade de peixes em am- biente inundável, no Sistema de Baías Caiçara, porção Norte do Pantanal Mato-Grossense, Alto Paraguai. Universidade Federal de São Carlos. São Paulo, Brasil. Tese de Doutorado.
NEGRELLE, R. R. B. 2013. “Composição e estrutura do componente arbóreo de remanescente de floresta estacional semidecidual aluvial no Pantanal Mato-grossense”. Revista Árvore, 37(6): 989-999.
NEVES E. B. e C. A. DOMINGUES. 2007. Manual de metodologia da pesquisa científica EB/CEP. Rio de Janeiro, Brasil.
OLIVEIRA, G. G.; SALDANHA, D. L. e L. A. GUASSELLI. 2010. “Espacialização e análise das inundações na bacia hidrográfica do rio Caí/RS”. Geociências, 29(3): 413-427.
PADOVANI, C. R. 2010. Dinâmica espaço-temporal das inundações do Pantanal. Escola Superior de Agricultura ‘Luiz de Queiroz’. Centro de Energia Nuclear na Agricultura. Piracicaba. Brasil. Tese Doutorado.
PADOVANI, C. R.; JÚNIOR, L. C.; BONAFE, P.; VETTORAZZI, C. A.; DIAS, R. A. P.; DIAS, C. T. S.; SHIMA-BUKURO, Y. E. e P. GIRARD. 2011. Sistema de monitoramento e alerta de inundações e secas no Pantanal. Anais XV Simpósio Brasileiro de Sensoriamento Remoto (SBSR, INPE). pp 1-8. São Paulo, Brasil.
PARANHOS FILHO, A. C.; MOREIRA, E. S.; OLIVEIRA, A. K. M.; PAGOTTO, T. C. S. e C. L. MIOTO. 2014. “Análise da variação da cobertura do solo no Pantanal de 2003 a 2010 através de sensoriamento remoto”. Engenharia Sanitária e Ambiental, 19: 69-76.
PAZ, A. R. 2010. Simulação hidrológica de rios de rios grandes planícies de inundação. Instituto de Pesquisas Hidráulicas. Universidade Federal do Rio Grande do Sul. Porto Alegre, Brasil. Tese Doutorado.
PENHA, J. M.; DA SILVA, C. J. & I. BIANCHINI. 1999. “Productivity of the aquatic macrophytes Pontederia lanceolata Nutt. (Pontederiaceae) on the floodplains of the Pantanal Mato-grossense, Brazil”. Wetlands Ecology and Management, 7(3): 155-163.
PEREIRA, G.; CHÁVEZ, E. S. e M. E. S. O. SILVA. 2012. “Estudo das unidades de paisagem do bioma Pantanal”. Ambi-Água, 7(1): 89-103.
PIGNATTI, M. G. e S. P. A. CASTRO. 2010. “Fragilidade/resistência da vida humana em comunidades rurais do Pantanal Mato-Grossense (MT, Brasil)”. Ciência Saúde Coletiva, 15(1.2): 3.221-3.232.
REBELLATO, L.; CUNHA, C. N. e J. E. C. FIGUEIRA. 2012. “Respostas da comunidade herbácea ao pulso de inundação no Pantanal de Poconé, Mato Grosso”. Oecologia Australis, 16(4):797-818.
SALGADO, M. I. H. 2011. Determinación de la variabilidad espacio temporal de tres lagos someros sometidos al pulso de inundación en el pantanal de Mato Grosso, Brasil. Universidad de Cantabria. Espanha. Tese de Mestrado.
SAMIZAVA, T. M. 2009. SIG e sensoriamento remoto aplicado ao estudo dos processos de inundação e mapea- mento da cobertura vegetal na planície fluvial do alto Rio Paraná. Universidade Estadual Paulista, Presidente Prudente. Dissertação de Mestrado.
SANTOS, R. D.; CARVALHO FILHO, A.; NAIME, U. J. e H. OLIVEIRA. 1997. “Pedologia”. In: Plano de Conservação da bacia do Alto Paraguai (Pantanal) - PCBAP. Diagnóstico dos meios físicos e bióticos: Meio físico. Brasília, Brasil.
SENA, F. T. N. S.; NETO, B. V. J. S. e A. C. S. LEITE. 2012. Uso do geoprocessamento como subsídio à análise ambiental: Imagem SRTM na geração dos mapas hipsómetrico e de declividade das bacias difusas da barragem Boa Esperança no estado do Piauí. IV Simpósio Brasileiro de Ciências Geodésicas e Tecnologias da Geoinformação. pp. 001- 005. Recife, Brasil.
SILVA, C. J.; WATZEN, K. M.; NUNES DA CUNHA, C. & F. A. MACHADO. 2001. “Biodiversity in the Pantanal wetland, Brasil”. In: B. GOPAL; W. J. JUNK & J. A. DAVIS (eds.). Biodiversity in wetlands: assessment, function and conservation. 2: 187-215.
SILVEIRA, S. W. G. 2015. Análise de desempenho de produtos MODIS para modelagem da dinâmica de inundação do Pantanal Mato-Grossense. Universidade Federal de Mato Grosso. Tese de Doutorado.
VALERIANO, M. M. e D. F. ROSSETTI. 2008. TOPODATA: seleção de coeficientes geoestatísticos para o refinamento unificado de dados SRTM. INPE. São José dos Campos, Brasil.
ZEILHOFER, P. & R. M. MOURA. 2009. “Hydrological changes in the northern Pantanal caused by the Manso dam: Impact analysis and suggestions for mitigation”. Ecological Engineering, 35: 105-117.