The twitch boom: The rise of the plataform due to the impact of the Covid-19 pandemic
The twitch boom: The rise of the plataform due to the impact of the Covid-19 pandemic
Revista Científica "Visión de Futuro", vol. 28, núm. 2, pp. 59-77, 2024
Universidad Nacional de Misiones

Esta obra está bajo una Licencia Creative Commons Atribución-NoComercial-CompartirIgual 2.5 Argentina.
Recepción: Septiembre , 14, 2023
Aprobación: Octubre , 02, 2023
Abstract: The COVID-19 pandemic led various countries worldwide to implement social distancing measures and strict confinements, resulting in changes in people’s daily consumption habits. The prolonged lockdown fostered new forms of activities at home, driving various types of online entertainment and interaction. The main objective of this study was to measure and analyze the impact of pandemic preventive actions on content consumption on an online live streaming platform, Twitch. The research method involved the use of data related to the average total views on the platform, aiming to determine the initial and lasting effects of the pandemic on the behavior and evolution of the content consumed on the platform. The statistical techniques applied were Regression Discontinuity and Difference in Differences. The results suggest that the lockdown caused an increase in the number of concurrently connected users by 30% to 40%. Furthermore, it is evidenced that this change in the platform’s viewership level persists over time, and, in the new post-pandemic context, the growth trend observed before the pandemic is maintained.
Keywords: Live streaming, Twitch, Impact valuation, COVID-19.
INTRODUCTION
In late 2019, the Municipal Health Commission of Wuhan, China, informed the detection of a cluster of pneumonia, which was then determined to be caused by a novel coronavirus. On March 11, 2020, with cases reported in 114 countries and growing concern about the alarming spread and severity of the disease, the Director-General of the World Health Organization (WHO) declared the disease caused by the new coronavirus (COVID-19) a pandemic (WHO, 2020). From that point onward, to contain the virus, most countries on every continent implemented mobility restriction and lockdown measures, including stay-at-home orders, as well as physical and social distancing actions (Scerbakov et al., 2022).
The pandemic context has produced changes in society in different ways, affecting how people work and socialize and even altering consumption habits, including leisure time. Efforts to reduce the spread of the virus caused people to stay home more, thus driving the exploration of new forms of entertainment and promoting the use of digital platforms. Consequently, this led individuals to spend more time online (Pineiro-Chousa et al., 2023; Gómez-Carmona et al., 2022). From their homes, with an internet connection and devices such as computers, gaming consoles, and smartphones, people can access a wide array of entertainment services, among which multimedia content platforms and video games stand out (Laming, 2020; Aguilar Del Castillo, 2021). In this regard, in recent years several studies have emerged that investigate the impact of COVID-19 on various sectors of the economy and businesses.
The digital entertainment industry observed the effects of lockdown, both in an increased demand due to the need for fun and in the search for greater social interaction in light of the isolation circumstances (Aguilar Del Castillo, 2021). Hence, the rise of new synchronous social networks was witnessed, distinguishing themselves from traditional ones by lacking an inherent temporal separation between content creation and consumption. On these live streaming platforms, viewers can interact with each other or with the creator, turning content consumption into a social experience of collective co-creation (Giertz et al., 2022). Online video games and live gaming sessions can provide a means to socialize and create a sense of community and well-being, much needed in the face of the emotional uncertainty caused by the pandemic (Scerbakov et al., 2022; Woo Chae and Hyun Lee, 2022).
At the onset of the pandemic, the platform Twitch was the global leader in live streamings primarily centered on video game content (Scerbakov et al., 2022). For this reason, it is worth studying the impact that the surge in online entertainment demand, prompted by social distancing measures to mitigate the spread of the virus, had on the platform. Below are the research questions of special interest:
Q1: Has the COVID-19 pandemic and mitigation measures involving strict social distancing affected the consumption of streams on the Twitch platform (average view number)?
Q2: Is the effect of the COVID-19 pandemic on Twitch persistent over time? In other words, did the impact last, or was it limited to a threshold near the pandemic period?
THEORETICAL FRAMEWORK
Platform economy
In recent years, the proliferation of personal computers, the Internet, mobile devices, and cloud services has led to the formation and exponential growth of digital platforms. These online platforms offer services that facilitate interaction in cyberspace among diverse yet interdependent groups of users. The digital revolution has driven new organizational structures that enable creating and capturing value in the digital economy. In this respect, these platforms allow exchanges or transactions and promote innovation, resulting in drastic cost reduction for rapid global scaling. Some examples of these online platforms include online marketplaces, app stores, search engines, social networks, and those designed for the collaborative economy (Gawer, 2021; Brynjolfsson et al., 2018).
Considering the above, Cusumano et al. (2021) proposed a typology of platforms based on how they generate value, distinguishing three main types: transactional, innovation, and hybrid platforms. Transactional ones make possible interactions among many individuals and organizations that would otherwise struggle to connect or transact with each other, thereby reducing search and transaction costs. Innovation platforms provide a technological foundation for innovators to develop complementary products or services. Lastly, hybrid ones combine features of both previous types.
On the other hand, content streaming platforms, such as Twitch, hold a prominent place in the context of platform economies. According to the typology proposed by Cusumano et al. (2021), these would be primarily classified as transactional platforms, as they offer real-time interaction among multiple users, enabling the live streaming of content. In addition, they create innovative spaces where individuals and organizations can connect with minimal friction and without the need to develop their own technical solutions or own all the assets they offer to users (Gawer, 2021). Platform services are capable of providing significant benefits to consumers and, although they are generally offered free of charge, research consistently shows that users are willing to attribute financial value to various online services. In most cases, this situation is not yet reflected in gross domestic product (GDP) measures (Brynjolfsson et al., 2018, 2019).
Despite having no cost, digital platforms enable content creators and businesses to generate revenue through advertising and subscriptions derived from live content streaming and active audience participation, creating an online community of followers and content creators (Aguilar Del Castillo, 2021). In this regard, Twitch and similar platforms are an outstanding example of how the transactional types can transform the dynamics of the digital economy by connecting millions of users and creating new business opportunities in the live content streaming environment.
New forms of communication
The advent of new information technologies has had a significant impact on the traditional media industry. This phenomenon is not recent; in fact, in 2003, Henry Jenkins wrote about the emergence of alternative communication formats and the crucial role played by the audience in them. In this context, the active participation of users in social networks and global follower communities stands out, fostering the creation of prosumers who actively contribute to content generation (Ferrarelli, 2016).
According to various digital media analysts, there is no longer a fixed age for the consumption of content platforms. This is primarily because Baby Boomers, due to the lockdowns imposed by the COVID-19 pandemic, gained experience in using digital media to replace most of their outdoor activities. On the other hand, younger generations are beginning to turn to and consume digital platforms such as Twitch, while commenting and sharing content on social networks as part of their group membership (Aguilar Del Castillo, 2021).
This current framework has led to the proliferation of new digital content platforms focused on offering Video On Demand (VOD), which, unlike television and other traditional media, provides content that is available for consumption whenever the user desires. Netflix is one of the pioneering platforms in VOD distribution, and, with an ever-evolving content supply, YouTube is another example. This shift in content distribution has prompted major film and television producers and distributors to create their own digital platforms, giving rise to what Elena Neira, a graduate in Law and Audiovisual Communication specialized in new models of digital video content distribution, called the ‘war of platforms’ or ‘Streaming Wars’ (Matei, 2022).
Services traditionally offered by social networks (e.g., Facebook), content sharing platforms (e.g., YouTube), and microblogging platforms (e.g., Instagram) are characterized by an inherent temporal separation between content creation and consumption (VOD). In other words, they are asynchronous: the content is not consumed immediately, and the creator does not receive live feedback. On the other hand, this time lag does not apply to new emerging synchronous social media services or live content streaming platforms. Real-time interactions facilitated by technology are not a new phenomenon, but synchronous social media is unique because it focuses on publicly available content that is consumed and collectively created. In live streaming, viewers can interact with each other or with the creator through various communication tools provided by the platform (such as live chats, and donation alerts, among others). Hence, content creators receive instantaneous feedback, allowing them to react to user interactions and comments, turning content consumption into a distinctive instance and a collective co-creation experience (Giertz et al., 2022). In this regard, social motivations, such as meeting new people, social interaction, and a sense of community, are crucial for these viewers. This suggests that live streaming viewers are attracted to channels where they feel noticed, important, and influential (Hilvert-Bruce et al., 2018).
Twitch Platform
Founded in 2011, Twitch is the world’s most popular live video streaming platform. While not new and notably evolving since its inception, it experienced a significant increase in popularity from 2020 onwards due to the COVID-19 pandemic lockdowns (Padilla Molina and Navarro, 2022; Zhao et al., 2020). Originally conceived for live video game streaming, Twitch has diversified its scope to encompass a wide range of content, including live music, artistic creation, and real-time discussions on diverse topics (Sjöblom and Hamari, 2016). Its importance has grown so rapidly that, over the last five years, it has become a reference point in the gaming industry and increasingly within the broader global media ecosystem as a whole (Johnson and Woodcock, 2018).
The proliferation of live streaming platforms, led by Twitch, has played a transformative role in the evolution of communication and interaction in the digital era. Such platforms allow content creators to establish immediate connections with global audiences through shared experiences and ongoing engagement. Based on their active involvement, creators can shape feedback into more personalized social interactions, fostering a sense of community on the channel and redefining traditional communication experiences (Hilvert-Bruce et al., 2018; Giertz et al., 2022; Hamilton et al., 2014).
METHODOLOGY
The Twitch platform, through an application programming interface (API), provides both content creators and developers with statistics related to their streams. Additionally, developers can access a set of global statistics for Twitch, such as the number of viewers on the platform, active streaming channels, live streams, and total hours watched, among others. Currently, this Twitch-related information is gathered and made available online, thus users can access monthly and daily data about the platform.
Within the entertainment sector, and closely related to some streaming platforms, is the video game industry. One of the primary gaming platforms, Steam, publishes data concerning logged-in users, those actively playing a game launched from the platform, and the most popular games. As with Twitch, there are several developers who collect, analyze, and publish this data on their websites.
The initial work involved exploring the information provided by various developers with access to the Twitch API to collect data. Subsequently, categories and data associated with the platform were reduced and standardized to select the appropriate variables for analyzing the evolution of content supply and demand on Twitch. Finally, two impact assessment techniques were applied to verify and estimate the effect of the pandemic (treatment) on the number of views on the live streaming platform.
Data sources
Table 1 displays the information sources of the consulted developers recognized by Twitch.
Data of interest related to platform metrics was manually extracted from these sources, and the process was not automated.
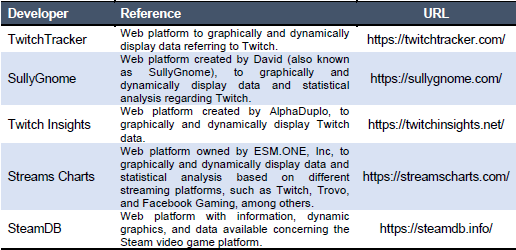
Note. Own elaboration. Collected data.
Among the data available in the different developer platforms considered, certain variables were selected, which can be seen in Table 2, as they were of interest for the analysis of the evolution of Twitch.
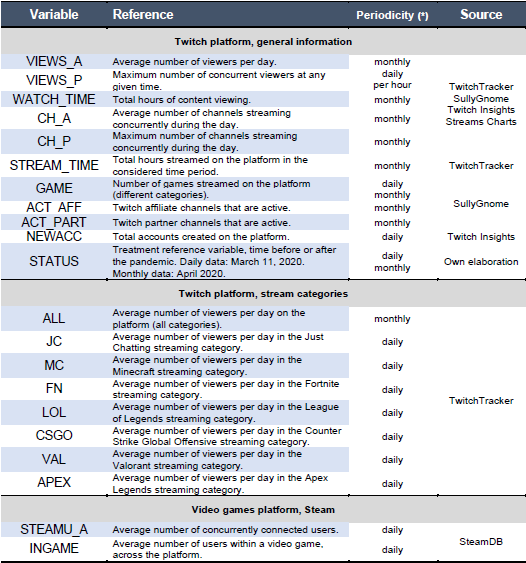
Note. Own elaboration.(*) The different types of periodicity are not available for all time periods. In almost all cases, there exists monthly periodicity data for the entire historical record of the platform.
Model definition
The impact of the pandemic on streaming platforms primarily occurred through increased availability of free time for individuals, who, in turn, had digital devices as one of the few entertainment sources at their disposal within their homes. In other words, as observed in Figure 1, the pandemic (a), through its containment measures, affected people’s free time (b).
This, in turn (via greater screen time), had a positive impact on the number of individuals consuming online entertainment digital platforms, including gaming (c) and online video streaming (d).
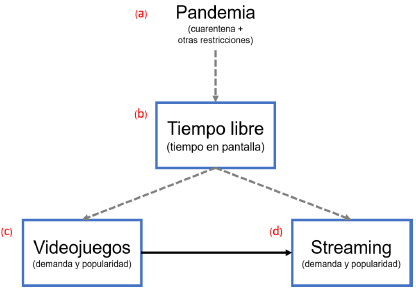
Figure 1
Relationship of variables, ways of impact of the pandemic on the number of views on the Twitch streaming platform.
Note. Own elaboration.
The amount of available time for entertainment (b), particularly that spent in front of a screen, affects our dependent variable (d) as an open "backdoor" (not observed with the available data). By incorporating a variable (c) that affects the dependent one, but is also influenced by the identified backdoor, we could consider it. In this way, the number of users connected to the gaming platform (c), due to its close relationship with the content (video games) streamed on Twitch, served as a variable to explain the popularity of the streaming platform (d). Moreover, it captures the effect of the amount of screen time available (b) to users (which affects the independent variable considered). Although it would be of interest to isolate the causal effect of the explanatory variable and the backdoor in subsequent research, in this study, we did not do so, as we aimed to analyze the overall impact of our treatment (a) on the dependent variable (d).
The variable STEAMU_A, which refers to the number of users connected to the Steam platform (c), was used as a proxy for screen time availability (b). In other words, these are individuals with the application open and "logged in", but, unlike the variable PLAYERS, they are not within a specific game. For this reason, STEAMU_A has a behavior directly proportional to the users’ available screen time. The more the free time of individuals, the more likely they are to log in to the gaming platform. That is, they probably connect to the platform to explore the catalog of games available in their personal library and/or in the store.
In summary, due to the significant interaction between Twitch and Steam audiences, if a person with the profile of an average Steam user has more time to log in/play video games, it is reasonable to assume that this is also the case for individuals with the profile of Twitch users.
Statistical analysis
To pursue the study's objectives, data was manually collected, entered into spreadsheets, and then analyzed using R Studio program. In some cases, the data was transferred to other software such as Tableau for better visualization.
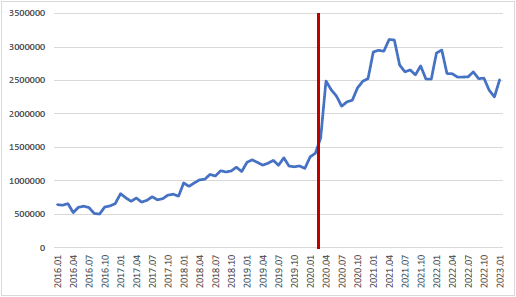
Figure 2
The average daily concurrent viewership on the Twitch platform, monthly data, for the period January 2016 to January 2023. Vertical reference: March 2020.
Note. Own elaboration
As can be observed in Figure 2, the Twitch platform’s viewership data shows a significant peak around the reference period of the pandemic.
In other words, the average daily views increased in the periods after the declaration of the global pandemic by the WHO (March 2020).
To assess the impact of the restrictions imposed in the pandemic context on the variables considered, the following steps are proposed:
-To descriptively and visually analyze the variables, aiming to understand the relationship between the variables and the potential impact of pandemic restrictions on them.
-To specify the model and verify compliance with the linear regression conditions and its significance.
-To calculate and evaluate linear regression between the variables.
-To estimate the regression discontinuity (RD).
-To determine the difference-in-differences discontinuity (DnD).
-To conduct robustness exercises.
RESULTS
Firstly, we used a linear model to analyze the impact of the pandemic on our variable of interest (VIEWS_A). The variable STEAMU_A, serving as a proxy for individuals’ free and/or screen time, appeared to be a suitable choice to explain the overall dynamics of the Twitch platform. As seen in Figure 3, the correlation between both variables is 0.973, allowing us to proceed with constructing the linear model.
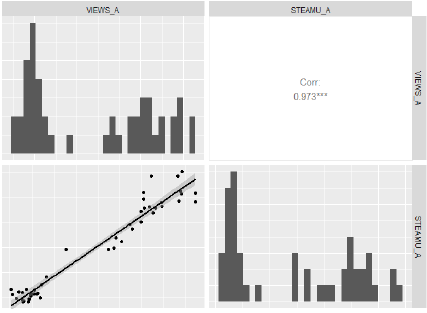
Figure 3
Correlation matrix, scatter plot and histogram of the variable of interest (VIEWS_A) and the independent variable (STEAMU_A).
Note. Own elaboration. Model estimation.
In our model, STEAMU_A captures the effect of the pandemic’s impact on the amount of time available to individuals. As a preliminary analysis, it was necessary to determine if this variable, assumed to be related to our explanatory one, has predictive power over VIEWS_A. Both variables have 48 monthly data points, covering the period from April 2018 to March 2022.
To verify this, a linear regression model was estimated with VIEWS_A as the dependent variable explained by STEAMU_A. The results are presented below:
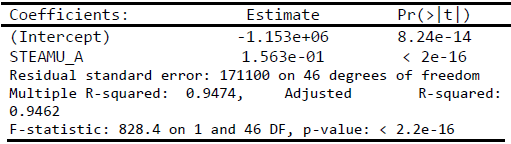
As can be observed, the model has a high capacity to account for the variability of VIEWS_A (average daily views on the Twitch platform). The simple linear regression VIEWS ~ STEAMU_A yielded R2 = 0.9474. As the correlation level suggested, the model’s value with STEAMU_A to explain VIEWS_A is quite high. However, we only used it as a control variable to estimate the impact of confinement on Twitch views.
Checks were conducted on the conditions necessary to accept a linear model. The linear relationship between the variables was confirmed both graphically and with a correlation coefficient of 0.973. The model’s residuals are independent of the explanatory variable (covariance = 0.0004960273). They are normally distributed (mean = -1.038281e-11; Jarque Bera Test = 0.2716). Their variance was graphically examined and found to be approximately constant along the x-axis.
Estimation of regression discontinuity
The discontinuity of the independent variable, that is, the number of views on the Twitch platform, was tested. For RD analysis, monthly data from April 2018 to March 2022 (48 observations) were considered; the underlying idea was that there are two pre-treatment (pre-pandemic) and two post-treatment periods.
As seen in Figure 4, there is a clear discontinuity, indicating that the pandemic preventive actions (March 2020) had an impact on the number of views on the platform.
The next step was to determine the size of this discontinuity, which was estimated parametrically and non-parametrically.
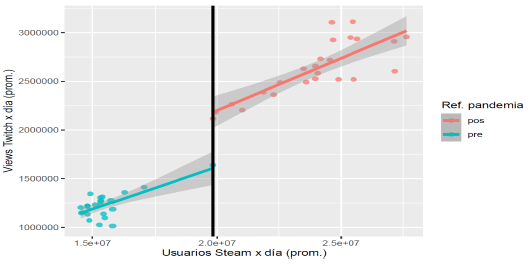
Figure 4
Visual testing of discontinuity of the variable VIEWS_A. Values are colored according to whether they correspond to a period before or after the pandemic.
Note. Own elaboration.
To perform the parametric estimation of the discontinuity, the model was defined as follows:
VIEWS_A = a + b STEAMU_A + c STATUS + E
The variable STEAMU_A was centered to analyze the effect around the threshold, determined by STATUS (it assumed pre- and post-values in reference to the pandemic).
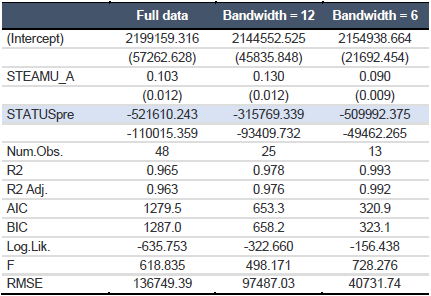
Note. Own elaboration.
As shown in Table 4, the discontinuity values for different bandwidths do not vary much, except for the 12-month intermediate bandwidth around the date of the pandemic.
This discrepancy is likely due to the data dispersion, estimating a smaller negative/positive effect of the pandemic.
This can be interpreted as follows: using all data with a bandwidth of six months before and after the pandemic, (a) the mean value of views at the threshold is 2,199,159 (all data) and 2,154,938 (6-month range), representing the value over the treatment. In the case of considering an immediate period before the treatment date (c), the impact of the treatment is 521,610 (all data) and 509,992 (6-month range).
This situation may imply that, in March 2020, the average views were 1,677,549 (all data), and the following month (post-pandemic), this figure increased by 521,610 (31%). These results align with the complete data analysis, the 6-month bandwidth, and the graphical representation of the discontinuity (using all data). At the 6-month threshold, a similar situation is observed. In the case of the 12-month bandwidth, this effect is reduced to 17.3%.
Furthermore, in the vicinity of the threshold, the higher the number of users connected to the Steam platform (b), the greater the amount of views on Twitch. The value of this increase is 0.103 (all data), 0.130 (12 months), and 0.090 (6 months) for each additional user connected to the gaming platform.
Difference-in-differences calculation
DnD models allow an analysis controlling for the variable time (with respect to the variable). In other words, it helps determine the impact of the treatment by subtracting the inherent dynamics of our variable of interest observed before implementing the treatment.
A previous study by Scerbakov et al. (2022) assessed the impact of COVID-19 on a sample of streamers already established on the platform before the pandemic. To estimate this treatment effect, they calculated the difference in means (impact) between diverse time periods covering the same months (reducing temporal bias, e.g., seasonal fluctuations in streaming behavior) before and after the pandemic.
To apply the DnD technique, a similar period to the one being evaluated was used as a control group but referring to the previous year. Thus, two periods were considered:
-Control Period: January 2017 - December 2018 (24 months).
-Treatment Period: January 2019 – December 2020 (24 months).
The main difference with the periods chosen for RD is the fewer post-treatment observations (9 months, April 2020 – December 2020). This reduced data selection served to satisfy the assumption of parallel trends, enabling the application of DnD for the analysis.
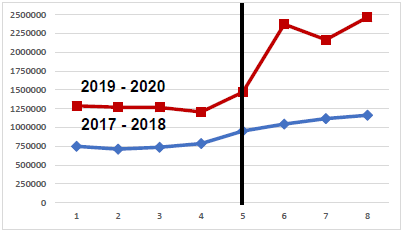
Figure 5
Assumption of parallel trends, number of views, quarterly data for the periods 2019 – 2020 (treatment) and 2017 – 2018 (control). Vertical ref.: March 2020.
Note. Own elaboration
Based on Figure 5, which is quarterly scaled for smoothing despite working with monthly data, it seems that the parallel trends assumption holds.
The number of views in both periods behaves similarly (parallel evolution), until the post-treatment period when this figure diverges significantly.
Firstly, a regression was run considering only the treatment period with respect to the treatment variable.
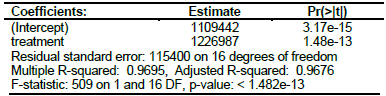
As can be observed, there is a difference in the mean of observations affected by the treatment and those previously found.
To perform DnD, we first calculated the difference in means between the treatment and the control groups, considering the period after the treatment (April 2020 - December 2020 and April 2018 - December 2018). That is, one is affected by the treatment, and the other is not.
Post-treatment difference: DFpos = 1,226,987
Next, we computed the difference in means between the treatment and the control groups, based on the period before the treatment (January 2017 - March 2018 and January 2019 - March 2020). In this case, neither of the two is affected by the treatment.
Pre-treatment difference: DFpre = 512,334
Finally, we determined the difference in the calculated differences.
Difference in differences: DnD = 714,652
Considering the values around the cutoff threshold (1,639,798 and 2,492,780), the DnD figure (714,652) shows an increase of 40.2% and 43.6%, respectively. The result, significantly higher than that obtained with RD (+10%), may be mainly due to the fewer observations used after the pandemic (24 observations in RD, 9 observations in DnD). In other words, this is because of greatly weighing the assessment of values close to the threshold.
When performing a DnD regression analysis, we obtained the same result as the previously calculated difference in means and with statistical significance.
Robustness exercises
Following the work of Scerbakov et al. (2022), paired and unpaired difference-in-means tests were conducted with two pre-pandemic periods (pre 1: April 2018 – March 2019 and pre 0: April 2019 – March 2020) and two post-pandemic ones (post 1: April 2020 – March 2021 and post 2: April 2021 – March 2022). Through the difference-in-means test of paired samples, each value/month was compared with the same value/month of the subsequent or preceding year, thus checking for the existence of difference in means in the particular periods considered, eliminating any potential seasonal variation. There is a difference in all periods, with the greatest one observed in that immediately after and before the pandemic (1,183,450 average views), and the smallest one, between the two pre-pandemic periods (148,921.9), followed by the two post-pandemic ones (267,559.8). All differences are statistically significant. In other words, the pandemic led to an increase in the difference in means between the immediately before and after periods.
Some robustness exercises could include (1) using the same series analyzed but in other periods of equal length and composition to see if the same discontinuity exists or (2) carrying out the same evaluation but with other related series, such as studying the behavior of content categories or another platform instead of the total platform. In the second case, the different categories of video games, having their own dynamics, are not expected to behave similarly to the total platform and may not be affected by the treatment. These exercises are left for future work in which the evolution of specific categories is compared with the overall evolution of the platform. Next, robustness exercises were performed based on various periods of the original series analyzed.
For the robustness exercise of the DnD technique, in the same way as the original exercise, two periods of equal length and similar behavior (parallel trends) were considered before the treatment:
-Control Period: January 2015 - December 2016 (24 months).
-Treatment Period: January 2017 – December 2018 (24 months).
The treatment affects the last eight months of the treatment period, that is, from month 17 to 24. However, in this exercise, the entire period (24 months) cannot be applied, because there is an atypical drop in the seventh month of the first period (control). Although there is no treatment in this robustness exercise, this atypical value is not in the same direction as the change caused by the treatment. Therefore, the first six quarters of each period were taken into account, five within the untreated period and one quarter afterward.
Firstly, the difference in means between the treatment and control groups was calculated:
Post-treatment difference: DFpos = 405405
Next, the difference in means between the treatment and control groups was determined, in relation to the period before the treatment:
Pre-treatment difference: DFpre = 227519.1
Finally, we computed the difference in the calculated differences.
Difference in differences: DnD = 177885.9
The resulting value is substantially lower than that obtained in the original exercise. When performing a DnD regression analysis, we got the same result as the previously calculated difference in means, with statistical significance at the 95% confidence level. However, there is no statistical significance for the effects in the post-treatment period.
In attempting robustness exercises with the DnD technique, the use of various time periods was explored. Still, in most cases, these periods were heterogeneous, making it challenging to compare with the period considered in the original analysis. Nevertheless, in all cases, the treatment effect was reduced and statistically insignificant when limited to the post-treatment period.
METHODOLOGICAL DISCUSSION
The results obtained in the overall analysis of the Twitch platform show an immediate positive reaction, in terms of the number of people connected concurrently, to the effects of the COVID-19 pandemic. This situation contrasts with the findings of Scerbakov et al. (2022) for streamers established on the platform before the pandemic. The methodology of these authors was used as a reference to study different periods of the pandemic (before, immediately after, and after) and make a comparison of means. Subsequently, the methodological criterion of pairing observations with periods referring to other years was adopted for a control group, applicable in the DnD technique.
The relationships between different variables related to the Twitch platform (VIEWS_A, VIEWS_P, WATCH_TIME, CH_A, CH_P, STREAM_TIME, GAME, ACT_AFF, ACT_PART, NEWACC) were analyzed, primarily focusing on the number of people creating content and the number of people viewing it. As expected, the level of correlation between these variables is very high, and, despite the theoretical difficulty of establishing a single direction of causality, linear model definitions with these variables did not yield correct results. On the other hand, data on average views of historically significant content categories on the platform (ALL, JC, MC, FN, LOL, CSGO, VAL, APEX) were evaluated. Except for Just Chatting (live chat) and League of Legends (strategy game), the growth and evolution of different content categories and the overall platform are minimally related.
The link between the variable STEAMU_A, concerning video games (the number of people connected to the Steam platform), and the variable of interest VIEWS_A (the number of concurrent viewers on the Twitch platform) is very strong: VIEWS ~ STEAMU_A yielded R2 = 0.9474. A linear model was established, and its residuals were examined in detail, accepting their independence, mean equal to zero, homoscedasticity, and normality. However, it cannot be assumed that the residuals are not autocorrelated, which may be related to the use of time series. Yet, no linear pattern was observed graphically. Therefore, a direct relationship exists between the video game industry and the online streaming platform Twitch, which has been closely tied to this industry since its inception.
When analyzing the established model, a clear discontinuity was evidenced in the variable concerning the treatment date (March 11, 2020). Subsequently, RD was estimated with different bandwidths (24 months, 12 months, and 6 months). The values are very similar, especially for 24 and 6 months. The average impact found due to the pandemic around the threshold was 30%.
Next, a DnD analysis was conducted, with the control group established in a period, of equal length, preceding the one considered. Using a previous period as a control limits the treatment duration for our treatment group (24 months, as in RD, but only 9 months in treatment). This may explain why the results of DnD are significantly higher than those of RD, showing an impact of 40%. The immediate effect is very important, but based on a longer period (as in RD), it diminishes, but remains persistent for the rest of the period considered.
This study is a first approximation of the impact of the pandemic on the Twitch platform, and further research is needed to have more certainty about its magnitude in the near and short term. Although our results allowed observing that the number of views on the platform was indeed positively affected, the most interesting finding is that there is a change in level and trend that persists to date. This investigation, with global data from Twitch and another online entertainment platform such as Steam, achieved similar results to those of Scerbakov et al. (2022) with data from established streamers. These reveal that the initial effects of the pandemic were much quicker (deeper increase) than the prolonged ones (shallower but persistent growth).
CONCLUSIONS
The effects of the COVID-19 pandemic, through the mobility restrictions implemented by various countries worldwide, had an impact on online entertainment consumption behavior. The case of the online live streaming platform, Twitch, experienced a level change caused by an initial positive increase in the number of concurrently connected people of between 30% and 40%, which later stabilized in a trend similar to the periods before the pandemic. In this regard, the persistence of this Twitch "boom" that occurred in lockdown is noteworthy, indicating that a significant portion of people who joined during the pandemic has remained as we temporally distanced ourselves from that event. This persistent level change, even as the trend stabilizes at growth similar to periods before the treatment, suggests a shift in online entertainment consumption behavior that has become an integral part of entertainment culture. Unlike other consumption patterns that replaced others during confinement, Twitch has managed to create and maintain a solid user base. However, it is essential to highlight the limitations of this study in explaining and predicting the platform’s dynamics in periods increasingly distant from the pandemic, especially in more recent times.
The characteristics of the global data behavior on Twitch and the observed growth due to the treatment show a strong positive correlation with the development of the Just Chatting content category. On the other hand, those content categories related to video games, which are more traditional on the platform, while influenced to some extent by its behavior, have their dynamics more associated with the popularity of the specific video game. This situation indicates that studying the evolution of each category independently, especially Just Chatting and In Real Life (IRL), could be fruitful for future research. Specifically, it might be worth delving into the reasons for their sustained growth, which is highly correlated with that of the platform. Additionally, given the nature of the content in Just Chatting, it is of interest to explore the role that interaction between the streamer and audience members, and even among themselves, plays in its success, giving rise to the formation of communities.
This study examined the behavior of the Twitch platform through content demand (audience), but there is a particular interest in analyzing the dynamics of content creators (streamers). The variable related to the number of active streamers on the platform is highly correlated with the amount of views, so a more in-depth investigation into this relationship could shed light on the importance of attracting and retaining content creators. Understanding how the platform can foster an attractive environment for streamers could be crucial to maintaining its continuous growth.
Finally, it should be highlighted the limitations of this article in explaining and predicting the platform’s behavior in periods increasingly distant from the treatment, especially in more recent times. In this sense, the results obtained provide insights into understanding the impact of the pandemic, both at its level and in the immediate post-treatment trend. However, it is essential to consider that the dynamics of Twitch may continue to evolve as the pandemic is overcome, and additional research may be required to fully understand these changes.
REFERENCES
Please refer to the articles in Spanish Bibliography.
BIBLIOGRAPHICAL ABSTRACT
Please refer to articles Spanish Biographical abstract.