Basic Research
Correlations between water absorption, electrical resistivity and compressive strength of concrete with different contents of pozzolan
Correlations between water absorption, electrical resistivity and compressive strength of concrete with different contents of pozzolan
Revista de la Asociación Latinoamericana de Control de Calidad, Patología y Recuperación de la Construcción, vol. 9, no. 2, pp. 152-166, 2019
Asociación Latinoamericana de Control de Calidad, Patología y Recuperación de la Construcción, A. C.

This work is licensed under Creative Commons Attribution-NonCommercial-NoDerivs 4.0 International.
Received: 16 July 2018
Accepted: 27 February 2019
Published: 30 April 2019
Abstract: This research confronts the following concrete properties: water absorptions (by immersion and capillarity), electrical resistivity and compressive strength. Concrete mixtures with two types of cement were tested. Results showed that concretes with higher content of pozzolan had higher resistivity and greater absorption by capillarity, for water/cement ratios lower than 0,60. This behavior is attributed to reduced pore diameters and microstructure densification. However, for water/cement ratio of 0,60, concrete with lower content of pozzolan presented higher absorption by capillarity. It was observed that the compressive strength and the electrical resistivity behaved inversely proportional to the water/cement ratio, and the absorption by immersion and capillarity are directly proportional to the water/cement ratio. Correlations with high determination coefficients were found between tests.
Keywords: durability, concrete, absorption, resistivity, compressive strength.
Resumo: Essa pesquisa confronta as seguintes propriedades do concreto: absorção de água (por imersão e capilaridade), resistividade elétrica e resistência à compressão. Concretos com dois tipos de cimento foram ensaiados. Os resultados mostraram que os concretos com maior teor de pozolana apresentam maior resistividade e absorção por capilaridade, para relação água/cimento menor que 0,60. Esse comportamento é atribuído à redução no diâmetro dos poros. No entanto, para relação água/cimento de 0,60, concretos com menor teor de pozolana apresentaram maior absorção por capilaridade. Ademais, a resistência à compressão e a resistividade elétrica são inversamente proporcionais a relação água-cimento, enquanto que a absorção por imersão e capilaridade são diretamente proporcionais a relação água/cimento. Correlações com elevados coeficientes de determinação foram encontradas entre os ensaios.
Palavras-chave: durabilidade, concreto, absorção, resistividade, resistência à compressão.
Resumen: Esta investigación correlaciona las siguientes propiedades: absorción de agua (por inmersión y capilaridad), resistividad eléctrica y resistencia a compresión. Se ensayaron dos tipos de hormigones con cementos diferentes. Los resultados mostraron que los hormigones con mayor contenido de puzolanas y relación agua-cemento menor que 0,60, presentaron mayor resistividad y absorción por capilaridad. Ese comportamiento se atribuye a la reducción del diámetro de los poros. Por otro lado, en los hormigones con relación agua/cemento de 0,60, pero con menor contenido de puzolanas, también se observó un aumento de la absorción por capilaridad. Como esperado, la resistencia a compresión y la resistividad eléctrica fueron inversamente proporcionales a la relación agua/cemento, en cuanto que la absorción por inmersión y capilaridad se mostraron directamente proporcionales a la relación agua/cemento. Las correlaciones encontradas entre los ensayos tuvieron altos coeficientes de determinación.
Palabras clave: durabilidad, hormigón, absorción, resistividad, resistencia a la compresión.
INTRODUCTION
Durability of concrete structures have a direct impact in the economy of civil construction industry. Therefore, it is essential to understand the mechanisms that cause the degradation of concrete structures. Some of the main variables that control the degradation processes in the concretes are electrical resistivity, water absorption and concrete porosity. Electrical resistivity can be correlated with the corrosion rate and its deterioration level, while water absorptions (by immersion and capillarity) can be directly related to the diffusivity of aggressive ions into the concrete microstructure. Moreover, the porosity (pore size, connectivity and tortuosity) is, also, an important aspect that may influence all these properties, including the compressive strength (Hornbostel et al., 2013; Ye et al., 2017).
Ramezanianpour et al. (2011) studied the relation between concrete resistivity, water absorption, chloride penetration and compressive strength, in order to offer a better comprehension over these properties. The authors concluded that the resistivity, the water absorption and the chloride penetration could be correlated. However, contrary to the expected, the compressive strength could not express a clear correlation with the electrical resistivity, once both parameters held variables (such as the cement type) that were not accounted in their study. Therefore, this article tries to fill this gap with the study of cements with different levels of pozzolans.
Still in this perspective, Andrade and D’Andrea (2011), Silva et al. (2011), Ait-Mokhtar et al. (2013) and Sengul (2014) also studied extensively these correlations. According with their research, due to the existing relation between porosity, permeability, saturation level, mechanical strength, chloride penetration and diffusivity, the electrical resistivity can be very helpful to service life predictions of concrete elements.
The influence of different cement types and mineral admixtures in the physical-electrical properties of the concrete was investigated by several studies (López and Castro, 2010; Yildirim et al., 2011; Lubeck et al., 2012; Hoppe Filho et al., 2013; Medeiros-Junior and Lima, 2016). Some of them tested partial replacements of cement by blast furnace slag, silica fume and fly ash. In general, the authors concluded that higher electrical resistivity coefficients and lower water absorptions were found in concrete with partial replacements by mineral admixtures, due to the pore refinement that reduced its connectivity. However, the effects are not yet fully understood. For example, concrete curing can play an important role in these relations. Presuel-Moreno et al. (2013) and Sabbag and Uyanik (2018) concluded that the curing process influences the permeability of the concrete. This reflected in higher water absorption rates and electrical resistivity and lower compressive strengths. According to these authors, better results were found when specimens were cured immersed in water or, at least, stored in a moist chamber.
The aim of this research is to investigate the possible correlations between concrete water absorption (by immersion and capillarity), electrical resistivity and compressive strength, comparing two different cements with different fly ash contents (12.5% and 27.0%). Therefore, this study attempts to understand the intensity of the correlations between these variables through coefficients of determination and how these relations are affected by the different content of pozzolan.
Finally, the results obtained with this research are useful to better understand the relation between parameters related with the durability of concrete structures and its compressive strength, which is the main variable regarding quality control in building design and construction.
EXPERIMENTAL PROGRAM
Materials
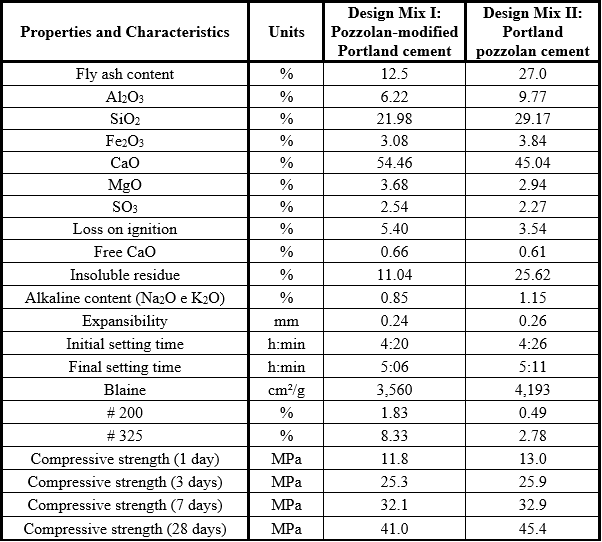
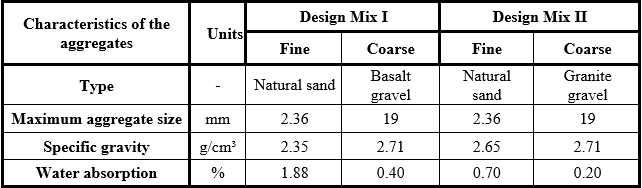
In this study, two mixtures with different pozzolan contents were selected. Design Mix I is composed by IP pozzolan-modified Portland cement (12.5% of fly ash) and Design Mix II is composed by IP (MS) Portland-pozzolan cement (27.0% of fly ash). The chemical composition and physical properties of both cements are listed in Table 1. In addition, the main characteristics of the fine and coarse aggregates are shown in Table 2. Natural sand was used as fine aggregate from the Iguazu River, in Porto Amazonas.
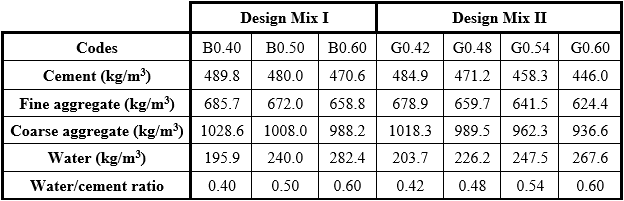
According to Bem et al. (2018), chemical admixtures might affect the electrical properties of the concrete. Therefore, no chemical admixtures were used. The proportioning in weight of the concrete mixtures was set as 1:1.4:2.1 (cement:fine aggregate:coarse aggregate). The content (kg/m³) of the ingredients used in each Design Mix is shown in Table 3.
The concrete specimens consisted in cylindrical samples, measuring Ø100 mm x 200 mm of height. This geometry was chosen, due to the tabulated data of the form correction factor, which is necessary to determine the electrical resistivity. According with UNE 83988-2 (2014), for this geometry, the factor is 0.377.
Concretes were cast following the recommendations of the Brazilian standard NBR 5738 (2015). Thus, 24 hours after molding, the samples were demolded and cured in a moist chamber (relative humidity ≥ 95%, and temperature of 23ºC ± 2ºC) for, at least, 28 days. Finally, as three specimens were used for each test performed, the results discussed in this study are the mean of three replicates.
Methods
Electrical Resistivity
The non-destructive electrical resistivity test was performed according with the European code UNE 83988-2 (2014), which establishes the experiment setup for the four-point probe technique (Wenner’s method). In this approach, four electrodes are placed over the specimen’s surface. Then, the concrete is subjected to an electric current applied between the two external electrodes. This way, the resulting difference on the electric potential can be measured by the two internal electrodes. Nonetheless, for each test specimen, three measurements were required to be taken, with a 120º-angle-distance apart. The specimens were in a saturated-dry surface condition during the experiment.
Compressive Strength
The compressive strength test was performed in the same specimens used, firstly, to execute the electrical resistivity experiment. Moreover, the test procedures were followed as described in the Brazilian standard NBR 5739 (2018). In this context, samples were placed on a hydraulic machine, where they were compressive-loaded until failure. During this experiment, it was used an equipment with a loading-capacity of 1000 kN, with a loading rate of 0.45 ± 0.15 MPa/s.
Water absorption by immersion
The water absorption test by immersion, performed only for the Design Mix II specimens, complied with the prescriptions of the Brazilian code NBR 9778 (2009). The experiment started by having the samples dried in an oven (T = 105ºC), until mass variation was lower than 0.10 g. Then, the oven-dried mass of the concrete was registered. Thereon, the cylindrical specimens were immersed in water for 72 hours. The immersion was performed according to Brazilian standard: 1/3 of the samples’ height immersed in the first 4 hours, 2/3 in the subsequent 4 hours, and finally, the total concrete sample immersion, in the 64 hours remaining. Thus, the water absorption rate by immersion, in percentage, represents the difference between the mass of the specimen after immersion (72h) and its oven-dry mass.
Water absorption by capillarity
The aim of this procedure is to monitor the mass increase of the samples, due to the water absorption by capillarity. This way, the test is started by drying the samples in an oven (T=105ºC), until mass variation is lower than 0.10 g, according to NBR 9779 (2012). After that, specimens are placed in a (5±1) mm water layer, with exposed bottoms, and their weights are measured after 3, 6, 24, 48 and 72 hours of exposure. These measurements were also used to determine the sorptivity (S), according with Eq.1.
Where, Vwater represents the volume of water absorbed by capillarity, in mm³; A represents the area of the specimen in contact with the water, in mm²; and t is the exposure period, in hours.
RESULTS AND DISCUSSION
Electrical resistivity and compressive strength
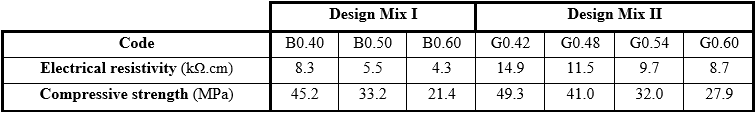
Table 4 shows the electrical resistivity and the compressive strength for each mixture and water/cement ratio at 28 days. According to Table 4, the greater the water/cement ratio, the lower is the electrical resistivity and the compressive strength. As the water/cement ratio increases, the internal porosity of the concrete microstructure and its connectivity increase as well. Therefore, the greater the permeability of the concrete, the lower is the mechanical strength, as well as the resistance against the electric current flow. This is not new and has already been reported by several studies (Mehta and Monteiro, 2006; Ait-Mokhtar et al., 2013; Olsson et al., 2013).
Medeiros-Junior and Lima (2016) and Yu et al. (2017) also related the increase of the water/cement ratio with the increase of the porosity of the specimens. This way, the resistance to the electric current flow decreases when more water is present inside the concrete pores. To ensure this, it was performed the Mercury Intrusion Porosimetry (MIP) test, in the G0.42 and G0.54 samples. The results showed that the porosity was 23.6% and 36.3%, respectively. In addition, the mean pore diameters were 43.9 nm e 48.8 nm, for each concrete tested.
Design Mix II had the greatest resistivity and compressive strength values among the mixtures tested (Table 4). The greater amount of pozzolan in Design Mix II contributed with the pore refinement, restraining its connectivity. This effect directly contributed to the reduction in the permeability and increased the resistance against the electric current flow. Similar results were found by López and Castro (2010), Yildirim et al. (2011) and Medeiros-Junior et al. (2014). Also, the partial replacement of cement by pozzolan resulted in the consumption of the calcium hydroxide – Ca(OH)2, in a chemical combination called Pozzolanic Reaction. This process hydrates the mixtures gradually and slowly, contributing to the increase of mechanical strength over time, as proven by Medeiros-Junior and Lima (2016).
Finally, in order to confirm the differences seen in the results obtained for each type of cement adopted, the values from Table 4 were submitted to a statistical treatment. The Analysis of Variance (ANOVA) with a single-factor and 5% significance proved that the electrical resistivity and the compressive strength were statistically different for each Design group.
That said, a graph with curves for each Design Mix was created, correlating the electrical resistivity versus the compressive strength (Figure 1). In addition, to describe the behavior of these variables, a logarithmical approach was chosen. This was the better data adjustment and it was also used by other studies (Andrade and D’Andrea, 2011; Wei and Xao, 2014; Medeiros-Junior et al., 2014).
In Figure 1, both parameters are directly proportional, i.e., the greater the compressive strength, the greater the electrical resistivity. This behavior was also noted by Dinakar et al. (2007) and Lubeck et al. (2012), and it is related with the clear influence that the porosity has over both properties. Moreover, the good graphical correlation shown in Figure 1 (both R-Squared over 0.98) reaffirms this relation.
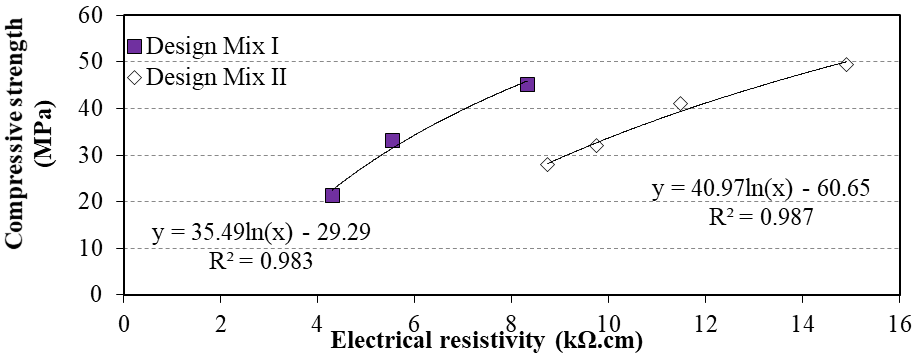
Figure 1
Correlation between electrical resistivity and compressive strength.
Furthermore, when both mixes are compared with the same range of compressive strength, it can also be observed that the correlation curve for Design Mix II has a smoother slope. This is due to the greater pozzolan content in Design Mix II, which created a denser microstructure with greater electrical resistivity.
Water absorption by immersion
Water absorptions by immersion were 3.67%, 4.32%, 5.69% and 6.36% for test specimens G0.42, G0.48, G0.54 and G0.60, respectively. Therefore, the water/cement ratio increased, and so did the absorption coefficients. This had already been observed by Zhang and Zong (2014), Castro and Ferreira (2016), Gans (2017) and Pinto et al. (2018), and it is mainly due to the porosity in the concrete microstructure and its permeability, given that both are parameters significantly influenced by the water/cement ratio.
In addition, according with the Comité Euro-International du Béton (CEB 192, 1989), the concrete may be qualitatively classified as good, average or poor, according to its absorption by immersion level. Figure 2 correlates the results obtained through the experiments with these levels. In Figure 2, while the higher water/cement ratios (0.60 and 0.54) are associated with poor quality concrete, the lower values of this parameter (0.42 and 0.48) classified the concrete with an average quality.
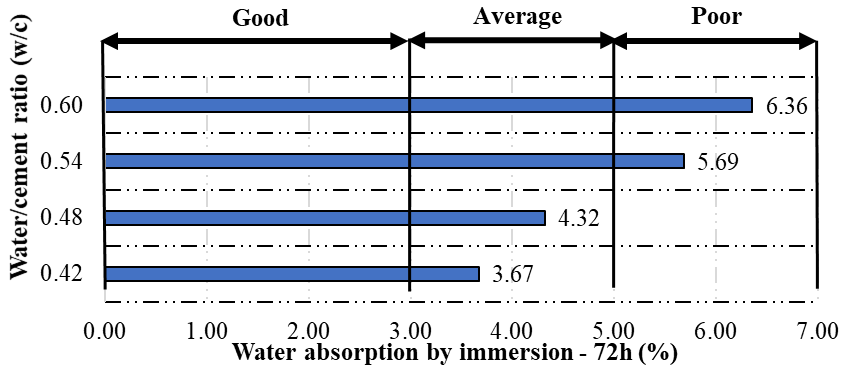
Figure 2
Water absorption by immersion and the concrete quality according with the criteria proposed by the CEB192 (1989).
Figure 3 shows the correlation between the water absorption by immersion and the electrical resistivity. Similarly to Figure 1, a logarithmical approach better described the behavior of both quantities.
The good correlation obtained in Figure 3 portrays the inversely behavior between the water absorption by immersion and the electrical resistivity. Thus, the water absorbed into the concrete microstructure enhances its electrical conductivity and, consequently, reduces its electrical resistivity. Figure 4 correlates the water absorption by immersion and the compressive strength, using a logarithmical approach.
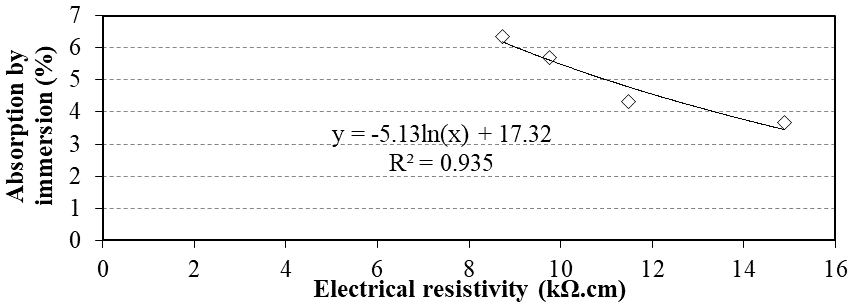
Figure 3
Correlation between electrical resistivity and absorption by immersion.
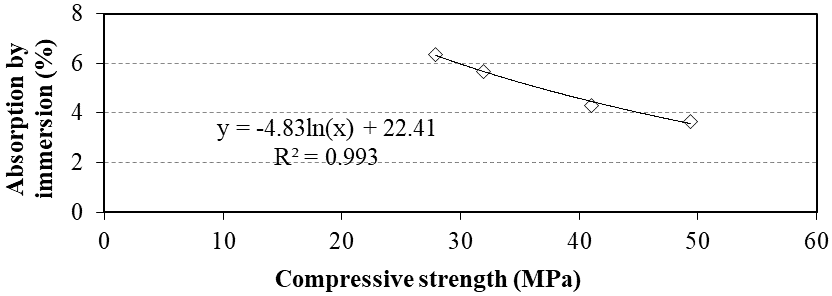
Figure 4
Correlation between compressive strength and absorption by immersion.
According to Figure 4, as the water absorption by immersion increases, the compressive strength decreases. The curves from Figure 3 and Figure 4 have the same behavior since the parameters that influence these tests are similar. Therefore, the greater the water/cement ratio, the greater is the porosity and its connectivity. This implies in reduced compressive strengths and electrical resistivity, while the water absorption by immersion is increased.
In summary, comparing the R-squared values from both graphs (Figures 3 and 4), it can be noted that the water absorption by immersion is better correlated with the compressive strength than with the electrical resistivity. This might be related with the dependence that the electrical resistivity has with the chemical composition of the solution present within the concrete pores (Ramezanianpour et al., 2011; Presuel-Moreno et al., 2013; Sabbag and Uyanik, 2018). Also, this behavior explains the low dispersion obtained in the regression curve shown in Figure 3, even though a high R-squared coefficient was found (R² = 0.935).
Water absorption by capillarity
Figures 5 and 6 show the variation of the water absorbed by capillarity over time for Design Mixes I and II, respectively. Water absorption by capillarity increased over the 72-hour exposure, in both mixtures. However, as the specimen approached its maximum absorption capacity, a stabilization tendency was identified. This behavior could be observed by different slopes in the curves over time. Usually, the increase in the absorption level was greater during the first 12 hours of the experiment.
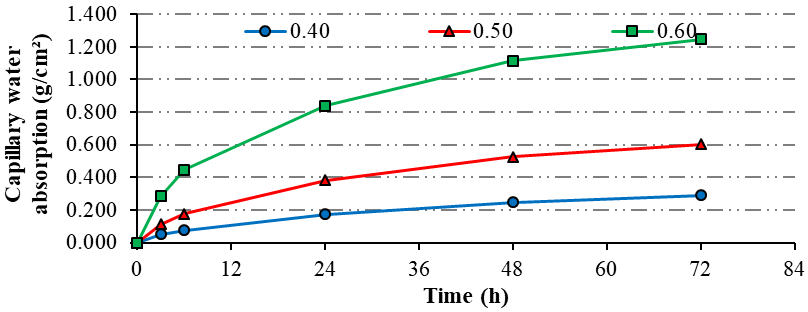
Figure 5
Absorption by capillarity over time - Design Mix I.
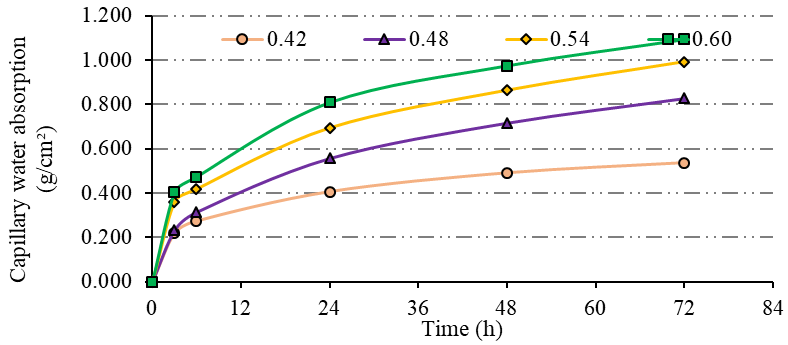
Figure 6
Absorption by capillarity over time - Design Mix II.
In addition, the water absorption by capillarity increased with the water/cement ratio. This way, as proven previously through the MIP test, a more porous concrete contributes directly to the water absorption and percolation.
Furthermore, in order to determine the sorptivity of the concrete, the results obtained with the absorption by capillarity experiment was used in Eq. (1). The sorptivity of the specimens ranged from 0.034 to 0.147 g/(cm².min1/2). Figure 7 illustrates the correlation and the variation of this parameter according with the water/cement ratio.
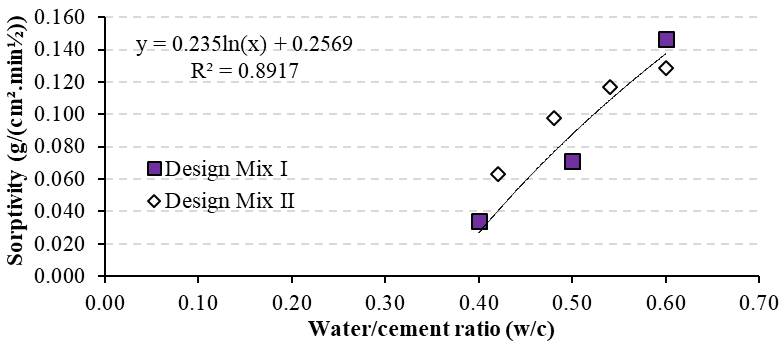
Figure 7
Sorptivity variation with different water/cement ratios.
As shown in Figure 7, greater water/cement ratios had greater sorptivity values. This was mainly due to the porosity increase. However, comparing both Design Mixes, it can be noted that Design Mix II (with larger amounts of pozzolan) had absorption by capillarity coefficients greater than in the first mix. This is observed visually at points above the trend line shown in Figure 7.
The main reason for greater coefficients in Design Mix II was the pore refinement and the reduction of its diameters. Consequently, in association with the surface tension of water, stronger capillary forces were experienced, and more water was absorbed (Mehta and Monteiro, 2006; Yildirim et.al., 2011; Medeiros et.al., 2017).
Similarly, Pinto et al. (2018) observed the same behavior, while analyzing the influence of carbonation in the absorption by capillarity. According to López and Castro (2010), Chen et al. (2014) and Leung et al. (2016), the greater the replacement of cement by pozzolan, the better the microstructure is rearranged, and therefore, less porous.
In contrast, comparing the results for the water/cement ratio equal to 0.60, it is observed that the sorptivity behavior was the opposite, with Design Mix I (with lower pozzolan content) developing greater coefficients. This was also seen by Olsson et al. (2013) and might be related to the pore tortuosity. In this case, larger amounts of pozzolan replacements have more tortuous pores, as observed by Medeiros-Junior and Lima (2016). Thus, even though its capillary forces are stronger, its absorption by capillarity coefficients are lower.
In summary, the effect of the reduced diameters of capillary pores linked to the surface tension of water was the main reason responsible for the growth of capillary absorption in lower water/cement ratios (sorptivity of Design Mix II > Design Mix I). On the other hand, for greater water/cement ratios, the tortuosity of the pores was the major factor that led to lower absorption coefficients in Design Mix II.
In addition, the water absorption by capillarity was correlated with other properties of the concrete. Figure 8 shows the capillary absorption after 72 hours and the electrical resistivity correlation. Figure 9 presents the behavior of the capillary absorption versus the compressive strength.
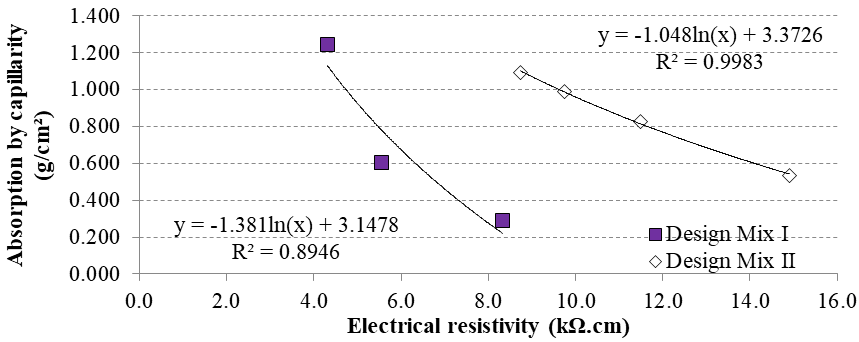
Figure 8
Correlation between electrical resistivity and water absorption by capillarity
According to Figure 8, the water absorption by capillarity decreases as the electrical resistivity increases, for both design mixes. Similarly, according to Figure 9, the water absorption by capillarity and the compressive strength are inversely-related parameters. Also, good R-squared coefficients were found, which assures the dependence between both variables.
Furthermore, Figure 10 shows the correlation between the water absorption by immersion versus capillarity. Both absorption measurements are directly-related and according to Figure 10, a high dependence can be identified among them, consolidating the influence of both properties in the water absorption and percolation in the concrete microstructure.
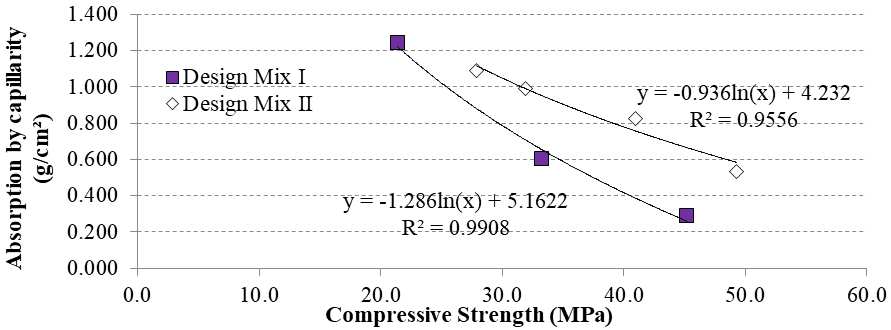
Figure 9
Correlation between the compressive strength and the water absorption by capillarity.
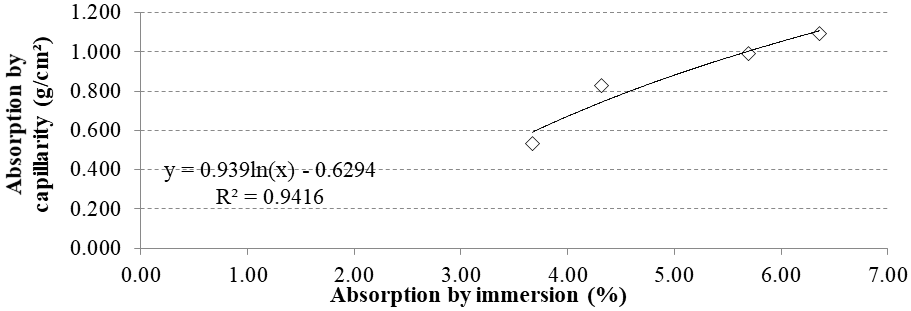
Figure 10
Correlation between water absorptions by immersion and by capillarity.
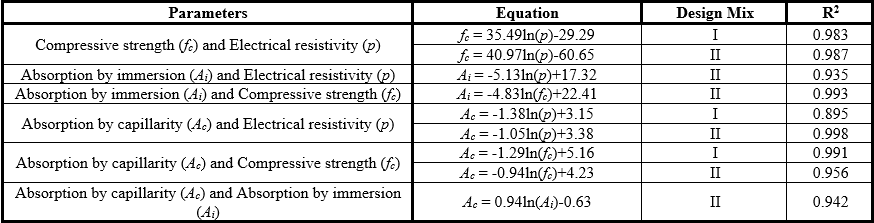
Finally, Table 5 summarizes all the logarithmical tendency equations obtained with the correlations. According to Table 5, most of the R-squared coefficients found were greater than 0.900. This is a consequence of the dependence between all the parameters studied (electrical resistivity, compressive strength, water absorption by immersion and water absorption by capillary) and the porosity of the material, although this correlation was not exclusive. However, equations in Table 5 must be extrapolated cautiously, as they are solely valid for the materials and considerations adopted in this research. Nonetheless, the study of the validation of these equations, as well as other materials, is highly encouraged.
CONCLUSIONS
-
There is a dependence relation between the compressive strength and the electrical resistivity, which was proved by the R-squared coefficient over 0.98, in both design mixes. Thus, the electrical resistivity and compressive strength of concrete tend to grow together, at least until the age investigated in this article.
-
The water absorption by immersion was inversely proportional to the compressive strength and the electrical resistivity of the concrete. Moreover, the absorption by immersion was directly proportional to the water/cement ratio.
-
The same behavior can be observed in the water absorption by capillarity. Correlation coefficients higher than 0.89 were observed in this case.
-
Concretes with higher pozzolan content had higher resistivity and absorption by capillarity, for water/cement ratios lower than 0.60. This behavior is attributed to reduced pore diameters and microstructure densification. However, concrete with lower pozzolan content presented higher absorption by capillarity for water/cement ratio of 0.60 due to smaller tortuosity of the pores.
-
It was proved that the correlation between the parameters should be used separately for each type of cement with different pozzolan contents, since the correlation curves were displaced for the two types of cement used in this article. The only exception was the correlation between the sorptivity and the water/cement ratio, which an adjustment between both mixes as a single group was possible (R-squared = 0.89).
Supplementary material
Acknowledgements
The authors thank the Postgraduate Program in Civil Construction (PPGECC) of the Federal University of Parana (UFPR) for its infrastructure support for the development of this research.
REFERENCES
Ait-Mokhtar, A., Belarbi, R., Benboudjema, F., Burlion, N., Capra, B., Carcasses, M., Colliat, J. B., Cussigh, F., Deby, F., Jacquemot, F., Larrard, T., Lataste, J. F., Bescop, P. L., Pierre, M., Poyet, S., Rougeau, P., Rougelot, T., Sellier, A., Yanez-Godoy, H. (2013), Experimental investigation of the variability of concrete durability properties. Cement and Concrete Research. 45:21-36. https://doi.org/10.1016/j.cemconres.2012.11.002
Andrade, C., D’andrea, R. (2011), La resistividad eléctrica como parámetro de control del hormigón y de su durabilidad, Revista ALCONPAT, 1(2), 93-101. DOI: http://dx.doi.org/10.21041/ra.v1i2.8
Asociación Española de Normalización (2014). UNE 83988-2: Durabilidad del hormigón. Métodos de ensayo. Determinación de la resistividad eléctrica. Parte 2: Método de las cuatro puntas o de Wenner. Madrid.
Associação Brasileira de Normas Técnicas (2015). NBR 5738: Concreto - Procedimento para moldagem e cura de corpos de prova. Rio de Janeiro.
Associação Brasileira de Normas Técnicas (2018). NBR 5739: Concreto - Ensaios de compressão de corpos-de-prova cilíndricos. Rio de Janeiro, 2018.
Associação Brasileira de Normas Técnicas (2009). NBR 9778: Argamassa/concreto endurecidos - Determinação da absorção de água, índice de vazios e massa específica. Rio de Janeiro.
Associação Brasileira de Normas Técnicas (2012). NBR 9779: Argamassa e concreto endurecidos — Determinação da absorção de água por capilaridade. Rio de Janeiro.
Bem, D. H., Lima, D. P. B., Medeiros-Junior, R. A. (2018), Effect of chemical admixtures on concrete’s electrical resistivity. International Journal of Building Pathology and Adaptation. 36(2):174-187. https://doi.org/10.1108/IJBPA-11-2017-0058
Castro, A., Ferreira, F. (2016), Effect of particle packing in the durability of high performance concretes. Ingeniería de Construcción. 31(2):91-104. http://dx.doi.org/10.4067/S0718-50732016000200003
Chen, C. T., Chang, J. J., Yeih, W. C. (2014), The effects of specimen parameters on the resistivity of concrete. Construction and Building Materials. 71:35-43. https://doi.org/10.1016/j.conbuildmat.2014.08.009
Comité Euro-International du Béton. (1989). CEB Bull 192: Diagnosis and assessment of concrete structures — state of the art report. Lausanne.
Dinakar, P., Babu, K. G., Santhanam, M. (2007), Corrosion behaviour of blended cements in low and medium strength concretes. Cement and Concrete Composites. 29(2):136-145. https://doi.org/10.1016/j.cemconcomp.2006.10.005
Gans, P. S. (2017), “Correlação entre a resistividade elétrica e a resistência à Compressão do concreto exposto a ciclos de molhagem e Secagem com cloretos e sulfatos”, Dissertação de Mestrado em Engenharia de Construção Civil, Universidade Federal do Paraná, Curitiba.
Hoppe Filho, J., Medeiros, M. H. F., Pereira, E., Helene, P., Isaia, G. C. (2013), High-Volume Fly Ash Concrete with and without Hydrated Lime: Chloride Diffusion Coefficient from Accelerated Test. Journal of Materials in Civil Engineering, 25(3):411-418. https://doi.org/10.1061/(ASCE)MT.1943-5533.0000596
Hornbostel, K., Larsen, C. K., Geiker, M. R. (2013), Relationship between concrete resistivity and corrosion rate – A literature review. Cement and Concrete Composites. 39:60-72. https://doi.org/10.1016/j.cemconcomp.2013.03.019
Leung, H. Y., Kim, J., Nadeem, A., Jaganathan, J., Anwar, M. P. (2016), Sorptivity of self-compacting concrete containing fly ash and silica fume. Construction and Building Materials. 113:369-375. https://doi.org/10.1016/j.conbuildmat.2016.03.071
López, M., Castro, J. T. (2010), Efecto de las puzolanas naturales en la porosidad y conectividad de poros del hormigón con el tiempo. Ingeniería de Construcción, 25(3):419-431. http://dx.doi.org/10.4067/S0718-50732010000300006
Lubeck, A., Gastaldini, A. L. G., Barin, D. S., Siqueira, H. C. (2012), Compressive strength and electrical properties of concrete with white Portland cement and blast-furnace slag. Cement and Concrete Composites. 34(3):392-399. https://doi.org/10.1016/j.cemconcomp.2011.11.017
Medeiros, M. H. F., Raisdorfer, J. W., Hoppe Filho, J., Medeiros-Junior, R. A. (2017), Partial replacement and addition of fly ash in Portland cement: influences on carbonation and alkaline reserve. Journal of Building Pathology and Rehabilitation. 2(4):1-9. https://doi.org/10.1007/s41024-017-0023-z
Medeiros-Junior, R. A., Lima, M. G. (2016), Electrical resistivity of unsaturated concrete using different types of cement. Construction and Building Materials. 107:11-16. https://doi.org/10.1016/j.conbuildmat.2015.12.168
Medeiros-Junior, R. A. Lima, M. G., Medeiros, M. H. F., Real, L. V. (2014), Investigação da resistência à compressão e da resistividade elétrica de concretos com diferentes tipos de cimento. Revista ALCONPAT, 4(2), 113-128. DOI: http://dx.doi.org/10.21041/ra.v4i2.21
Mehta, P. K., Monteiro, P. J. M. (2006), “Concrete – Microstructure, Properties and Materials”. McGraw Hill, New York City, United States, cap. 5, pp. 121-198.
Olsson, N., Baroghel-Bouny, V., Nilsson, L. O., Thiery, M. (2013), Non-saturated ion diffusion in concrete – A new approach to evaluate conductivity measurements. Cement and Concrete Composites. 40:40-47. https://doi.org/10.1016/j.cemconcomp.2013.04.001
Pinto, S. R., Macedo, A. L. A., Medeiros-Junior, R. A. (2018), Effect of preconditioning temperature on the water absorption of concrete. Journal of Building Pathology and Rehabilitation. 3(3):1-10. https://doi.org/10.1007/s41024-018-0032-6
Presuel-Moreno, F., Wu, Y. Y., Liu, Y. (2013), Effect of curing regime on concrete resistivity and aging factor over time. Construction and Building Materials. 48:874-882. https://doi.org/10.1016/j.conbuildmat.2013.07.094
Ramezanianpour, A. A., Pilvar, A., Mahdikhani, M., Moodi, F. (2011), Practical evaluation of relationship between concrete resistivity, water penetration, rapid chloride penetration and compressive strength. Construction and Building Materials. 25(5):2472-2479. https://doi.org/10.1016/j.conbuildmat.2010.11.069
Sabbag, N., Uyanik, O. (2018), Determination of the reinforced concrete strength by electrical resistivity depending on the curing conditions. Journal of Applied Geophysics. 155:13-25. https://doi.org/10.1016/j.jappgeo.2018.03.007
Sengul, O. (2014), Use of electrical resistivity as an indicator for durability. Construction and Building Materials. 73:434-441. https://doi.org/10.1016/j.conbuildmat.2014.09.077
Silva, P. C., Ferreira, R. M., Figueiras, H. (2011). “Electrical Resistivity as a Means of Quality Control of Concrete – Influence of Test Procedure” in: Freitas, V. P., Corvacho, H., Lacasse, M. (Eds.), XII International Conference on Durability of Building Materials and Components, FEUP Edições, Porto: Distrito de Porto (PT), 8 p.
Wei, X., Xao, L. (2014), Kinetics parameters of cement hydration by electrical resistivity measurement and calorimetry. Advances in Cement Research. 26(4):187-193. https://doi.org/10.1680/adcr.13.00034
Ye, H., Jin, N., Jin, X. (2017), An Experimental Study on Relationship among Water Sorptivity, Pore Characteristics, and Salt Concentration in Concrete. Periodica Polytechnica Civil Engineering. 61:530-540. https://doi.org/10.3311/PPci.9621
Yildirim, H., Ilica, T., Sengul, O. (2011), Effect of cement type on the resistance of concrete against chloride penetration. Construction and Building Materials. 25(3):1282-1288. https://doi.org/10.1016/j.conbuildmat.2010.09.023
Yu, B., Liu, J., Chen, Z. (2017), Probabilistic evaluation method for corrosion risk of steel reinforcement based on concrete resistivity. Construction and Building Materials. 138:101-113. https://doi.org/10.1016/j.conbuildmat.2017.01.100
Zhang, S. P., Zong, L. (2014), Evaluation of Relationship between Water Absorption and Durability of Concrete Materials. Advances in Materials Science and Engineering. 2014:1-8. http://dx.doi.org/10.1155/2014/650373
Additional information
Cite as: Medeiros-Junior,
R. A., Munhoz, G. S., Medeiros, M. H. F. (2019), “Correlations
between water absorption, electrical resistivity and compressive strength of
concrete with different contents of pozzolan”, Revista
ALCONPAT, 9 (2), pp. 152 – 166, DOI: http://dx.doi.org/10.21041/ra.v9i2.335
Legal Information: Revista ALCONPAT is a quarterly publication by the Asociación Latinoamericana de Control de Calidad,
Patología y Recuperación de la Construcción, Internacional, A.C., Km. 6 antigua
carretera a Progreso, Mérida, Yucatán, 97310, Tel.5219997385893, alconpat.int@gmail.com, Website:
www.alconpat.org
Responsible editor: Pedro
Castro Borges, Ph.D. Reservation of rights for exclusive use
No.04-2013-011717330300-203, and ISSN 2007-6835, both granted by the Instituto
Nacional de Derecho de Autor. Responsible for the last update of this issue,
Informatics Unit ALCONPAT, Elizabeth Sabido Maldonado, Km. 6, antigua carretera a Progreso, Mérida, Yucatán, C.P. 97310.
The views of the authors do not
necessarily reflect the position of the editor.
The total or partial
reproduction of the contents and images of the publication is strictly
prohibited without the previous authorization of ALCONPAT Internacional
A.C.
Any dispute, including the
replies of the authors, will be published in the (irst
issue of 2020 provided that the information is received before the closing of
the third issue of 2019.