Service life prediction for concrete structures based on carbonation front depth models
Predicción de la vida útil de estructuras de hormigón a partir de modelos que estiman el avance del frente de carbonatación
Previsão da vida útil de estruturas de concreto com base em modelos para avanço da frente de carbonatação
 R. Costa rayarapintocosta@gmail.com
A. Franchetto
A. Gouveia
F, Ziegler
K. Pessoa
M. Garcez
R. Costa rayarapintocosta@gmail.com
A. Franchetto
A. Gouveia
F, Ziegler
K. Pessoa
M. Garcez
Service life prediction for concrete structures based on carbonation front depth models
Revista de la Asociación Latinoamericana de Control de Calidad, Patología y Recuperación de la Construcción, vol. 12, núm. 1, 47-60, 2022
Asociación Latinoamericana de Control de Calidad, Patología y Recuperación de la Construcción, A. C.
Recepción: 14 Septiembre 2021
Aprobación: 02 Diciembre 2021
Publicación: 01 Enero 2022
Abstract: This paper seeks to evaluate the variability in predicting the service life of concrete structures through four models that estimate the natural advance of the carbonation front. The results show that there is variability in the estimated carbonation front. The models by Possan (2010) and Ekolu (2018) show estimated values close to measured ones, while Ho and Lewis (1987) and Bob and Affana (1993) tend to underestimate and overestimate the natural carbonation front, respectively. Only concretes without added supplementary cementitious materials were considered, due to model limitations. Compressive strength, CO2 concentration and relative humidity have significant influence on the results and the variability depends on which parameters are considered in the models.
Keywords: carbonatation, service life prediction, carbonatation depth, concrete durability.
Resumen: Este artículo evalúa la variabilidad en la previsión de la vida útil de estructuras de hormigón a través de cuatro modelos que estiman el avance natural del frente de carbonatación. Los resultados muestran que hay variabilidad en el frente de carbonatación estimado. Los modelos Possan (2010) y Ekolu (2018) presentan valores estimados cercanos a los medidos, mientras que Ho y Lewis (1987) y Bob y Affana (1993) subestiman y sobreestiman el frente de carbonatación natural. Sólo se consideraron los hormigones sin adición de materiales cementantes suplementarios, debido a las limitaciones del modelo. La resistencia a compresión, concentración de CO2 y humedad relativa tienen influencia significativa en los resultados y la variabilidad depende de los parámetros que se consideren en los modelos.
Palabras clave: carbonatación, predicción de vida útil, profundidad de carbonatación, durabilidad del hormigón.
Resumo: Este artigo busca avaliar a variabilidade na previsão da vida útil de estruturas de concreto através de quatro modelos que estimam o avanço natural da frente de carbonatação. Os resultados mostram que há variabilidade na frente de carbonatação estimada. Os modelos de Possan (2010) e Ekolu (2018) apresentam valores estimados próximos aos medidos, enquanto Ho e Lewis (1987) e Bob e Affana (1993) tendem, respectivamente, a subestimar e superestimar a frente natural de carbonatação. Somente concretos sem adição de materiais cimentícios suplementares foram considerados, por limitações dos modelos. A resistência à compressão, concentração de CO2 e umidade relativa do ar têm influência significativa nos resultados e a variabilidade depende de quais parâmetros são considerados nos modelos.
Palavras-chave: carbonatação, previsão de vida útil, frente de carbonatação, durabilidade do concreto.
1. INTRODUCTION
Carbonation is a phenomenon generated by the interaction between the concrete and the environment through the reaction of carbon dioxide (CO2) from the air with calcium hydroxide (Ca(OH)2), a cement hydration product. The reaction provides high alkalinity in the concrete interstitial solution, forming calcium carbonate (CaCO3). The hydrated Portland cement of concrete has an alkaline pH (12-13), mainly due to Ca(OH)2. However, the formation of CaCO3 leads to a pH reduction that can reach 9.4 and the consequent CaCO3 precipitation to the concrete surface. The cement matrix acidification causes steel reinforcement depassivation, making it susceptible to corrosion, the primary pathological manifestation in reinforced concrete structures (PETER et. al., 2008; CHEN, 2019).
The main factors that affect carbonation are temperature, relative humidity (RH), CO2 concentration, surface coating, water/cement ratio, cement type, cement and water content, curing conditions, cement matrix degree of hydration, concrete permeability, and pore network (Ribeiro et. al., 2018; Li et. al., 2018; Song; Kwon, 2007; Houst; Wittmann, 2002). The carbonation occurrence is low at early ages (up to 28 days, generally). However, with more prolonged CO2-saturated environment exposure, the carbonation process becomes more evident in the concrete structure (RIBEIRO et. al., 2018).
According to NBR 15575-1: Edificações habitacionais – Desempenho Parte 1 (translation: NBR 15575-1: Residential Buildings — Performance Part 1) (ABNT, 2013), Service Life (SL) is the period in which a building and/or its systems provide the activities for which they were designed and built, meeting the performance levels established in this standard. Determining the service life of a carbonated concrete structure encompasses carbonation depth measurements and the use of mathematical models to determine the carbonation front speed affecting the structure (Possan, 2010).
The models to estimate the carbonation depth assume that the concrete is homogeneous, which does not occur in real structures since concrete consistency depends on the compaction and curing time and the relative humidity (RH) conditions of the environment. However, this assumption ensures that the properties determining the carbonation rate are similar at all concrete depths, simplifying model assumptions (Köliö et. al., 2014).
Due to the various factors discussed in the previous paragraphs, no model faithfully represents concrete carbonation. Therefore, choosing which model better represents a specific concrete structure depends on its characteristics and the variables considered in the model.
Thus, this paper analyzes the variability in SL predictions through four models that estimate the concrete carbonation depth based on a database of tests performed under natural aging and exposure conditions found in the literature. A sensibility analysis was performed to identify the parameters that most influence the variations found between the values estimated by the models and those obtained experimentally.
The primary purpose of this study is to contribute to the technical-scientific community on the subject of pathological manifestations, especially in the definition of models that can better estimate the carbonation front, helping in decision-making processes related to durability and SL of reinforced concrete structures in the design stage.
2. METHOD
The method comprehends i) Selecting mathematical models for predicting concrete carbonation depth; ii) Creating a concrete carbonation database; iii) Comparing the concrete carbonation models; iv) Sensitivity analysis to understand carbonation depth predictions, according to the variables considered by each concrete carbonation model.
2.1 Carbonation depth models
2.1.1 Possan (2010) Model
The model proposed by Possan (2010) considers several factors that influence carbonation with manageable data input, as shown in Equation (1), where “y” (mm) is the carbonation Depth; kc is the variable factor according to the type of cement (Table 1); fc is the average compressive strength (MPa); kfc is the variable factor for the axial compressive strength of concrete (Table 1); t is the age (years); ad is the pozzolanic addition content (% relative to the mass of cement); kad is a variable factor referring to the pozzolanic additions of the concrete (Table 1); CO2 is the CO2 content of the atmosphere (%); kCO2 is a variable factor referring to the CO2 content of the environment (Table 1); RH is the average relative humidity (%*0.01); kur is the variable factor referring to the RH (Table 1); and kce is the variable factor referring to the exposure to rain (Table 2).
 (1)
(1)
| Cement type | Concrete characteristics | Environmental conditions | |||
| Cement | fc | Pozzolanic addition | CO2 | RH | |
| (kc) | (kfc) | (kad) | (kCO2) | (krh) | |
| CP I | 19.80 | 1.70 | 0.24 | 18.00 | 1300 |
| CP II E | 22.48 | 1.50 | 0.32 | 15.50 | 1300 |
| CP II F | 21.68 | 1.50 | 0.24 | 18.00 | 1100 |
| CP II Z | 23.66 | 1.50 | 0.32 | 15.50 | 1300 |
| CP III | 30.50 | 1.70 | 0.32 | 15.50 | 1300 |
| CP IV | 33.27 | 1.70 | 0.32 | 15.50 | 1000 |
| CP V ARI | 19.80 | 1.70 | 0.24 | 18.00 | 1300 |
| Type of exposure | kce |
| Indoor environment protected from rain | 1.3 |
| Outdoor environment protected from rain | 1 |
| Outdoor environment unprotected from rain | 0.65 |
2.1.2 Ekolu (2018) Model
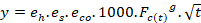
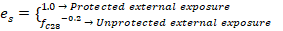
The mathematical model proposed by Ekolu (2018) considers several parameters related to carbonation, such as RH and ambient temperature, CO2 concentration, structure protection, and rainfall incidence. The model estimates the carbonation depth through Equations (2) to (6), where “y” (mm) is the carbonation depth; eh refers to the RH; es refers to the concrete compressive strength; eco refers to the CO2 concentration in the environment; Fc(t) is the concrete strength growth function; t is the concrete exposure time (years); g depends on the cement type; and RH is the average RH of the environment (%).
 (2)
(2)
 (3)
(3)
 (4)
(4)
 (5)
(5)
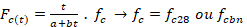 (6)
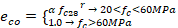
(6)The “eco” can be determined through (5) by inserting, if necessary, the concrete compressive strength at 28 days of curing (fc28) and the respective correction coefficients "α" and "r" from Table 3. Fc(t) is obtained through (6), and the coefficients "a" and "b" (Table 4) depend on the values of concrete strength (fc28, when considering concrete strength at 28 days and fcbn, when considering long-term concrete strength), as well as concrete ages. The “g” coefficient applied in (2) should be consulted in Table 5.
| Coefficient | CO2 concentration in atmosphere (ppm) | ||||
| 200 | 300 | 500 | 1000 | 2000 | |
| α | 1.40 | 1.00 | 2.50 | 4.50 | 14.00 |
| r | -0.25 | 0.00 | -0.25 | -0.40 | -0.67 |
| Compressive strength | Concrete age | a | b |
| fc28 | t < 6 anos | 0.35 | 0.6 – t0.5/50 |
| t > 6 anos | 0.15t | 0.5 – t0.5/50 | |
| fcbn | t < 15 anos | 0.35 | 1.15 – t0.6/50 |
| t > 15 anos | 0.15t | 0.95 – t0.6/50 |
| Supplementary cementitious materials (SCM) | Cement type* | Conductance factor “g” |
| 20% SCM | CEM I, CEM II/A | -1.5 |
| 30% fly ash | CEM II/B, CEM IV/A | -1.4 |
| 50% slag | CEM III/A | |
| *According to British standard BS EN 197-1 | ||
2.1.3 Ho e Lewis (1987) Model
Ho and Lewis (1987) proposed an improvement for the model proposed by Tuutti (1982) by adding a parameter for initial carbonation, as shown in Equation 8. The carbonation depth is represented by the factor ec (mm); e0 is the initial carbonation depth (mm); k is the carbonation coefficient (mm/year)0.5, and t is the time (years).
 (7)
(7)The model proposed by Ho and Lewis (1987) does not indicate how to determine the carbonation coefficient (k). Thus, different proposals have been developed for determining the coefficient, such that proposed by Helene (1997), which takes into account the cement type, the CO2 concentration, and the concrete compressive strength, as shown in Equations (8) to (10). The carbonation coefficient is represented by the factor k (mm/year)0.5; fck is the compressive strength (MPa) and; CCO2 is the CO2 concentration (%).
Concrete (Equation 9):
 (8)
(8)Concretes with pozzolanic cement (Equation 10):
 (9)
(9)Concrete with blast furnace cement (Equation 11):
 (10)
(10)2.1.4 Bob e Affana (1993) Model
Bob and Affana (1993) model is also based on the model developed by Tuutti (1982), but the authors considered that concrete carbonation depth was related to more factors, such as air RH, cement type, and concrete compressive strength. In the model, presented in Equation (11), the carbonation depth is represented by the factor “y” (mm); c is the coefficient related to cement type (Table 6); k is the coefficient dependent on the air humidity (Table 6); fc is the compressive strength of concrete (MPa); t is the time (years) and; d is the coefficient referring to the amount of CO2 (Table 6).
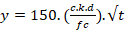 (11)
(11)
| Relative humidity | k |
| RH ≤ 60 | 1.0 |
| 70 ≤ RH ≤ 75 | 0.7 |
| 80 ≤ RH ≤ 85 | 0.5 |
| RH ≥ 90 | 0.3 |
| CO2 concentration | d |
| CO2 ≤ 0.03% | 1.0 |
| 0.03 < CO2 ≤ 0.1% | 2.0 |
| Cement type | c |
| Portland cement PC40 and PC45 | 0.8 |
| Portland cement PC50 and PC55 | 1.0 |
| Portland cement + 15% mineral addition | 1.2 |
| Portland cement + 30% mineral addition | 1.4 |
| Portland cement + 50% mineral addition | 2.0 |
2.2 Database
A literature review was conducted to create the database presented in Table 7. A total of 300 data were selected from papers that evaluated different concrete mixes under the effects of natural carbonation. Subsequently, with this group of data, a new screening was performed to select the data that could effectively be used in the carbonation models used in this paper (referred in section 3.1). A total of 24 data were used for the development of this paper, as shown in Table 7, where ET corresponds to the exposure time and ec to the carbonation depth.
| Data | ET (year) | w/c | Cement | fck 28 (MPa) | CO2(%) | RH (%) | Exposure | cd(mm) |
| Possan (2010) | 7.00 | 0.80 | PC V | 19.80 | 0.035 | 0.70 | oepr | 12.01 |
| 12.00 | 0.80 | PC V | 19.80 | 0.035 | 0.70 | oepr | 15.1 | |
| Pauletti (2009) | 2.50 | 0.40 | PC I | 38.96 | 0.071 | 0.70 | oeur | 1.31 |
| 4.83 | 0.40 | PC I | 38.96 | 0.071 | 0.70 | oeur | 2.00 | |
| Tasca (2012) | 2.00 | 0.55 | PC V | 45.90 | 0.035 | 0.65 | iepr | 0.92 |
| 4.00 | 0.55 | PC V | 45.90 | 0.035 | 0.65 | iepr | 1.41 | |
| 14.00 | 0.55 | PC V | 45.90 | 0.035 | 0.65 | iepr | 6.35 | |
| Nardino et al. (2018) | 3.33 | 0.61 | PC V | 30.00 | 0.053 | 0.70* | iepr | 6.00 |
| 6.41 | 0.61 | PC V | 30.00 | 0.053 | 0.70* | iepr | 8.10 | |
| 7.80 | 0.61 | PC V | 30.00 | 0.053 | 0.70* | iepr | 7.44 | |
| Rozière et al. (2009) | 1.00 | 0.63 | PC V* | 47.80 | 0.053 | 0.50 | oeur* | 1.20 |
| 1.00 | 0.63 | PC V* | 36.20 | 0.053 | 0.50 | oeur* | 10.90 | |
| Ribeiro et al. (2018) | 10.00 | 0.65 | PC V | 32.30 | 0.015 | 0.55 | oeur | 11.90 |
| 10.00 | 0.44 | PC II F | 54.20 | 0.015 | 0.55 | oeur | 3.00 | |
| Sanjuan et al. (2003) | 2.00 | 0.69 | PC V | 17.00 | 0.030 | 0.50 | iepr | 7.00 |
| 2.00 | 0.49 | PC V | 28.00 | 0.030 | 0.50 | iepr | 5.00 | |
| Ferreira (2013) | 3.00 | 0.55 | PC II F | 24.8 | 0.034 | 0.65 | oeur | 7.56 |
| 7.00 | 0.55 | PC II F | 24.8 | 0.034 | 0.65 | oepr | 12.86 | |
| 9.00 | 0.55 | PC II F | 24.8 | 0.034 | 0.65 | oepr | 13.89 | |
| 10.00 | 0.55 | PC II F | 24.8 | 0.034 | 0.65 | oepr | 13.57 | |
| 3.00 | 0.55 | PC II F | 24.8 | 0.034 | 0.65 | oepr | 10.00 | |
| 7.00 | 0.55 | PC II F | 24.8 | 0.034 | 0.65 | oepr | 15.36 | |
| 9.00 | 0.55 | PC II F | 24.8 | 0.034 | 0.65 | oepr | 16.80 | |
| 10.00 | 0.55 | PC II F | 24.8 | 0.034 | 0.65 | oepr | 15.96 | |
| RH - relative humidity; oepr - outdoor environment protected from rain; oeur - outdoor environment unprotected from rain; iepr - indoor environment protected from rain; ET - exposure time, cd - carbonate depth; * - estimated data. | ||||||||
2.3 Model comparison and sensitivity analysis
A comparison of the real carbonation depth (mm), in relation to the estimated carbonation depth, was performed and the error (mm and %) was quantified. In addition, the sensitivity level of the models was determined, taking into account three factors: compressive strength (MPa); CO2 concentration (%); ambient RH (%). A simulation of natural carbonation scenarios was made, where some factors varied while others remained fixed. The factors stipulated for the scenarios were defined based on the information obtained from the database. The carbonation depths were delimited for a period of 50 years. With these factors in mind, three scenarios were determined, as described in Table 8.
| Scenario A – varies compressive strength at 28 days | ||||
| Compressive strength (MPa) | 40 | 20 | ||
| Relative humidity (%) | 65 | 65 | ||
| Carbon dioxide (%) | 0.035 | 0.035 | ||
| Environment type | Indoor | Indoor | ||
| Cement type | PC V | PC V | ||
| Scenario B – varies carbon dioxide from the environment | ||||
| Compressive strength (MPa) | 40 | 40 | ||
| Relative humidity (%) | 65 | 65 | ||
| Carbon dioxide (%) | 0.03 | 0.07 | ||
| Environment type | Indoor | Indoor | ||
| Cement type | PC V | PC V | ||
| Scenario C – varies relative humidity of the environment | ||||
| Compressive strength (MPa) | 40 | 40 | 40 | 40 |
| Relative humidity (%) | 30 | 50 | 70 | 90 |
| Carbon dioxide (%) | 0.035 | 0.035 | 0.035 | 0.035 |
| Environment type | Indoor | Indoor | Indoor | Indoor |
| Cement type | PC V | PC V | PC V | PC V |
3. RESULTS AND DISCUSSION
Figure 1 (a) shows a tendency for the models to generate different results from those observed in the experiments. These observations are more explicit for Bob and Affana (1993) model, which overestimated, and Ho and Lewis (1987) model, which underestimated the carbonation depths.
Data presented in Figure 1 (b) allows a comparison of the carbonation depths estimated by each model, relative to the real carbonation depths. The dashed red line represents equivalent results for the estimated and real values, obtained experimentally: points above the dashed line represent values that were overestimated by the model, while values under the dashed line represent underestimated estimates for carbonation depth. It can be observed that the Ho and Lewis (1987) model underestimates carbonation depths, while the Bob and Affana (1993) model overestimates them. The carbonation data estimated by Possan (2010) and Ekolu (2018) models, on the other hand, are closer to the dashed line, but still underestimate the carbonation depth.
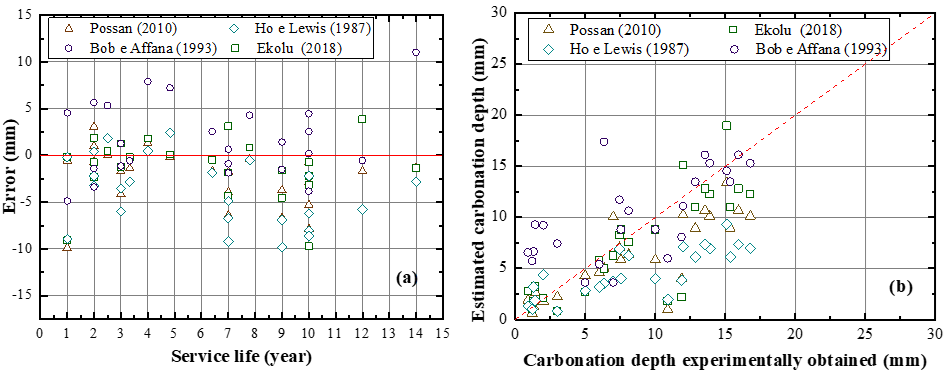
Figure 1
Errors for carbonation depths as a function of time (a) and comparison between estimated and experimentally obtained carbonation depths (b).
Figure 2 (a) shows the sensitivity analysis results for the models regarding the compressive strength, considering values between 20 and 40 MPa, in the natural carbonation process during 50 years. The figure shows carbonation depths and SL with the minimum concrete cover of 25 mm stipulated by NBR 6118 (2014) for reinforced concrete structures in urban environments (moderate aggressiveness, class II).
In all models of scenario A, the increase in concrete compressive strength results in lower carbonation depths. This behavior is consistent with that predicted in the literature since lower w/c ratios reduce the matrix porosity and carbonation depths, determining concrete strength (TUUTTI, 1982; HO and LEWIS, 1987; KULAKOWSKI, 2002).
The reduction in carbonation depth caused by increasing the compressive strength of concrete from 20 to 40 MPa, considering results for the same period, is approximately 68.55%, 70.3%, 49.97%, and 50% for the models of Possan (2010), Ekolu (2018), Ho and Lewis (1987), Bob and Affana (1993), respectively. These values are obtained by fixing the formula variables of each method and varying the compressive strength. The compressive strength factor exerts more influence on the carbonation depths estimated by the models of Ho and Lewis (1987) and Bob and Affana (1993). In addition, the Possan (2010) and Bob and Affana (1993) models predict that 20 MPa concrete would not be able to meet an SL of 50 years with a concrete cover of 25 mm under the conditions stipulated for Scenario A. For the other models, 20 MPa concrete would already meet this requirement.
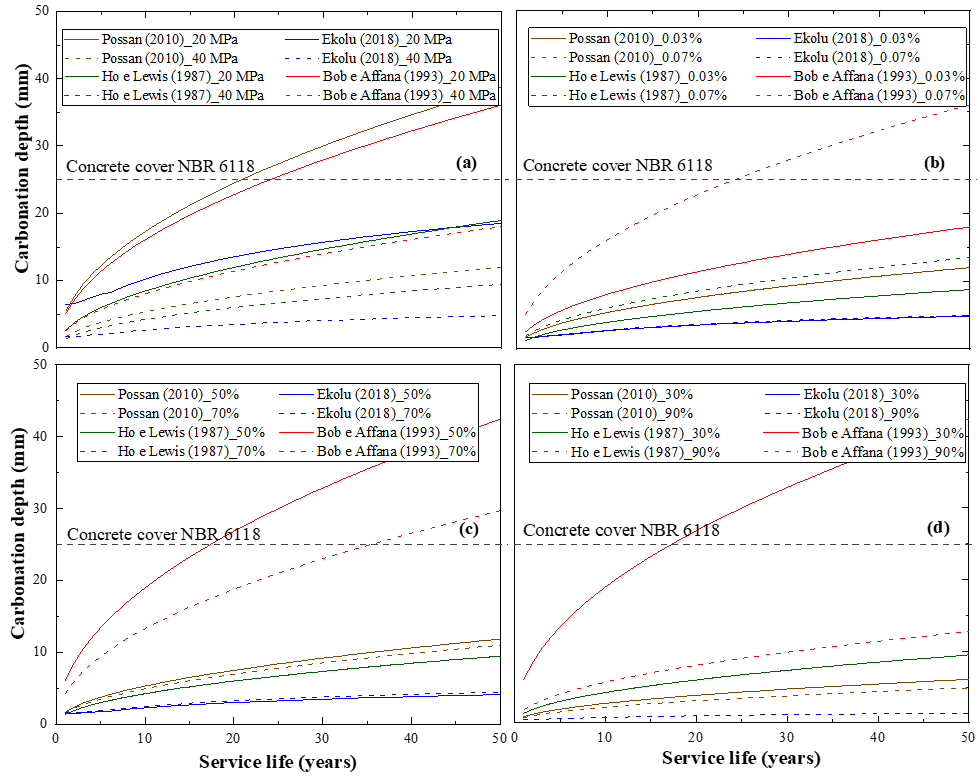
Figure 2
Service life and carbonation depth in relation to compressive strength - Scenario A - (a), carbon dioxide in the environment - Scenario B - (b), relative humidity of 50 and 70% - Scenario C - (c) and relative humidity of 30 and 90% - Scenario C - (d).
Figure 2 (b) shows the sensitivity regarding the CO2 concentration. The CO2 concentrations were delimited based on the values obtained from the database and definitions presented in the publication of Possan (2010). Concentrations of 0.03% and 0.07% were then stipulated in the natural carbonation process during the 50 years. Pires (2016) presents CO2 concentration as one of the intervening factors in the carbonation process of concrete, and Cadore (2008) suggests that the carbonation front speed is directly related to CO2 concentration, i.e., the carbonation speed increases by increasing CO2 concentration.
Note in Figure 2 (b) that although carbonation increases by increasing CO2 levels, this growth is lower in the Possan (2010) and Ho and Lewis (1987) models. The carbonation depth increase caused by the CO2 concentration growth is approximately 0.17%, 2.89%, 53.84%, and 100%, on average, for Possan (2010), Ekolu (2018), Ho and Lewis (1987), Bob and Affana (1993) models, respectively. This result indicates that the CO2 factor of the Possan (2010) and Ekolu (2018) models exert less influence on the estimated carbonation depths for Scenario B compared to the other mentioned models. The Bob and Affana (1993) model suggests that in environments with 0.07% CO2, concrete would not meet a 50-year SL with a 25 mm concrete cover under the conditions stipulated for Scenario B.
Figure 2 (c) illustrates the sensitivity to the ambient RH in the natural carbonation process for 50 years. The selected RH are extreme values found in the literature for the natural carbonation processes (Pauletti, 2009; Tasca, 2012; Rozière, 2009; Nardino, 2019).
For scenario C, the increase of ambient RH reduces the carbonation depth for Possan (2010) and Bob and Affana (1993) models. However, while Possan (2010) model presents a 7.16% decrease on average, the Bob and Affana (1993) model results in a 30% decrease, which suggests that Bob and Affana (1993) model is more sensitive to this variable. For Ekolu (2018) model the carbonation depth increases by 8.44% on average. On the other hand, for Ho and Lewis (1987) model, the carbonation depths remain unchanged with the 20% increment in RH, which can be explained by the fact that the RH is not an input data, and therefore, the model is not sensitive to this factor.
Since RH is a relevant factor for the carbonation process, it should be accounted for, directly or indirectly, in SL prediction models by natural carbonation processes. The water present in the pores is responsible for dissolving the CO2, forming carbonic acid (H2CO3) and Ca(OH)2, resulting in CaCO3 (Pauletti, 2009). The volume and composition of pore water are influenced by factors such as the w/c ratio, curing time, temperature, and even the RH of the environment (Vieira et al., 2016).
The literature also indicates that excessive or low RH environments are not conducive to the natural carbonation process. In the first situation, the concrete pores would be filled with water, hindering the penetration of CO2 for H2CO3 formation. On the other hand, in low RH conditions, the water in the concrete pores would be insufficient to generate more accelerated natural carbonation rates since water is required to generate H2CO3 (Félix et al., 2017; POSSAN et al., 2017; Elsalamawy et al., 2019; Dierfeld et al., 2020).
Considering Scenario C, results of Possan (2010) and Bob and Affana (1993) show a reduction in carbonation depths due to the RH increase from 50 to 70%, which suggests that the pore saturation is predicted in these ranges of ambient RH. In contrast, the Ekolu (2018) model results suggest that these RH contents are conducive to the carbonation process. In this regard, Chen et al. (2018) observed an increase in carbonation depth with an increase in ambient RH, with a peak of about 70%. Data obtained through the Ekolu (2018) model in Scenario C follows the one suggested by these authors.
For a better understanding, Possan (2010), Ekolu (2018), and Bob and Affana (1993) models were then tested in Scenario C, considering 30% and 90% RH. The results are shown in Figure 2 (d). For the Possan (2010) method, lower carbonation depths are obtained in 30% - 90% RH range compared to 50% - 70%. While the 50-year average carbonation depths for 50% and 70% RH are 8.01 mm and 7.43 mm, respectively, for 30% and 90% RH these values change for 4.10 and 3.28 mm, respectively. This indicates that the model is sensitive to both excess and low RH conditions.
Also, in Ekolu (2018) model, the 30% RH generates negative values, while 90% predicts significantly lower results than 50% and 70%. Thus, the model recognizes the 50% -70% RH range as the more favorable for the carbonation process. For Bob and Affana (1993) model, on the other hand, 30% RH results in carbonation depths equivalent to those estimated for 50% RH, since the model considers RH ranges instead of individual values. As the same coefficient (1.0) is used for RH equal to or below 60%, the model is not sensitive to RH below 60%. The same happens for RH values equal to or greater than 90%, where the coefficient 0.3 is adopted. However, the model considers that for RH equal to or below 60% the carbonation depth is higher than for RH equal to or greater than 90%. For 30% an average carbonation of 28.68 mm depth was obtained for 50 years, while for 90% the value was 8.6 mm. Figure 2 (c) also indicates that according to Bob and Affana model (1993), concrete in environments with 50 and 70% RH would not meet a 50-year SL with a 25 mm concrete cover in the conditions stipulated for Scenario C. Furthermore, according to Bob and Affana (1993) model, concrete in environment with 30% RH, and conditions as in Scenario C, Figure 2 (d), would not meet the 50-year SL for a 25 mm concrete cover.
4. CONCLUSION
-
The Possan (2010) and Ekolu (2018) models result in carbonation depths closer to those found experimentally;
-
The Ho and Lewis (1987) model tends to underestimate the carbonation depth;
-
The Bob and Affana (1993) model tends to overestimate the carbonation depth;
-
The Ho and Lewis (1987) and Bob and Affana (1993) models showed a more significant influence of the compressive strength on the carbonation depths;
-
The CO2 concentration factor of the Possan (2010) and Ekolu (2018) models exert the slightest influence on the estimated carbonation depths for Scenario B compared to the other models;
-
The Bob and Affana (1993) model has the highest sensitivity to the RH variable, while the Ho and Lewis (1987) model has no data input for this variable.
The Possan (2010) and Bob and Affana (1993) models with 20 MPa concrete in Scenario A, Bob and Affana (1993) model with concrete exposed to 0.07% CO2 in the environment in Scenario B, and Bob and Affana (1993) model with concrete exposed in 30%, 50% and 70% RH environment in Scenario C, would not be able to meet a SL of 50 years with a concrete cover of 25 mm under the stipulated conditions.
Thus, it can be seen that there is variability in the results of carbonation front estimated by the selected models compared to the real results of natural carbonation. This variability occurs to a greater or lesser extent depending on the parameters considered in the model equations. The sensitivity analysis performed with compressive strength, CO2 concentration, and relative humidity shows that these variables significantly influence the results issued by the models and, therefore, should be considered in the equations.
6. REFERENCE
Associação Brasileira de Normas Técnicas. (2013). NBR 15575-1: Edificações habitacionais — Desempenho Parte 1: Requisitos gerais. Rio de Janeiro.
Associação Brasileira de Normas Técnicas. (2014). NBR 6118: Projeto de estruturas de concreto – Procedimento. Rio de Janeiro.
Bob, C., Afana, E. (1993). “On-site assessment of concrete carbonation”. Proceedings of the International Conference Failure of Concrete Structures, RILEM, Bratislava: (Rep. Eslovaca), pp. 84–87.
Cadore, W.C. (2008), “Estudo da camada de cobrimento de protótipos de concreto com altos teores de adições minerais e cal hidratada”, Dissertação de Mestrado, Universidade Federal de Santa Maria, p.149.
Chen, T., Gao, X. (2019), Effect of carbonation curing regime on strength and microstructure of Portland cement paste. Journal of CO2 Utilization, 34:74-86. https://doi.org/10.1016/j.jcou.2019.05.034
Chen, Y., Liu, L., Yu, Z. (2018), Effects of Environmental Factors on Concrete Carbonation Depth and Compressive Strength. Materials, 11, 2167. https://doi.org/10.3390/ma11112167
Dierfeld, S. G. et al. (2020), Understanding the carbonation of concrete with supplementary cementitious materials: a critical review by RILEM TC 281-CCC. Materials and Structures, 53:136. https://doi.org/10.1617/s11527-020-01558-w
Elsalamawy, M., Mohamed, A. R., Kamal, E. M. (2019), The role of relative humidity and cement type on carbonation resistance of concrete. Alexandria Engineering Journal 58(4):1257–1264. https://doi.org/10.1016/j.aej.2019.10.008
Ekolu, S. O. (2018), Model for practical prediction of natural carbonation in reinforced concrete: Part 1-formulation. Cement and Concrete Composites. 86:40-56. https://doi.org/10.1016/j.cemconcomp.2017.10.006
Ferreira, M. B. (2013), “Estudo da carbonatação natural de concretos com diferentes adições minerais após 10 anos de exposição”, Dissertação de Mestrado, Universidade Federal de Goiás, p. 197.
Félix, E. E., Carrazedo, R., Possan, E. (2017), Análise paramétrica da carbonatação em estruturas de concreto armado via Redes Neurais Artificiais. Revista ALCONPAT, 7(3), pp. 302-316. https://doi.org/10.21041/ra.v7i3.245
Helene, P. (1997). “Vida útil das Estruturas de Concreto”. in: IV Congresso Iberoamericano de Patologia das Construções. Anais. Porto Alegre: RS (Brasil).
Ho, D. W. S., Lewis, R. K. (1987), Carbonation of concrete and its prediction. Cement and Concrete Research, 17(3):489-504. https://doi.org/10.1016/0008-8846(87)90012-3
Housty, Y. F., Wittmann, F. H. (2012), Depth profiles of carbonates formed during natural carbonation. Cement and Concrete Research, 32(12):1923-1930. https://doi.org/10.1016/S0008-8846(02)00908-0
Köliö, A. et al. (2014), Durability demands related to carbonation induced corrosion for Finnish concrete buildings in changing climate. Engineering structures, 62-63:42-52. https://doi.org/10.1016/j.engstruct.2014.01.032
Kulakowski, M. P. (2002), “Contribuição ao estudo de carbonatação de concretos e argamassas compostos com adição de sílica ativa”, Tese de Doutorado, Universidade Federal do Rio Grande do Sul, Porto Alegre: RS (Brasil), p. 180.
Li, D. et al. (2018), Evaluating the effect of external and internal factors on carbonation of existing concrete building structures. Construction and Building Materials, 167:73-81 https://doi.org/10.1016/j.conbuildmat.2018.01.127
Nardino, C. et al. (2019) “Previsão de vida útil de estruturas por modelos matemáticos e carbonatação natural” in: 4º Simpósio Paranaense de Patologia das Construções, Curitiba:PR (Brasil), pp. 300-311. https://doi.org/10.4322/2526-7248.052
Pauletti, C. (2009). “Estimativa da carbonatação natural de materiais cimentícios a partir de ensaios acelerados e de modelos de predição”, Tese de Doutorado, Universidade Federal do Rio Grande do Sul, Porto Alegre:RS (Brasil), p. 285.
Peter, M. A. et al. (2008), Competition of several carbonation reactions in concrete: A parametric study. Cement and concrete research, 38(12):1385-1393. https://doi.org/10.1016/j.cemconres.2008.09.003
Pires, P. F. (2016). “Estudo da carbonatação avançada em concretos contendo adições minerais”, Dissertação de Mestrado, Universidade Federal de Goiás. p. 141.
Possan, E. (2010), “Modelagem da carbonatação e previsão de vida útil de estruturas de concreto em ambiente urbano”, Tese de Doutorado, Universidade Federal do Rio Grande do Sul. p. 263.
Possan, E. et al. (2017), CO2 uptake potential due to concrete carbonation: A case study. Case Studies in Construction Materials, 6:147-161. https://doi.org/10.1016/j.cscm.2017.01.007
Ribeiro, D. V. et. al. (2018), “Corrosão e Degradação em Estruturas de Concreto: Teoria, Controle e Técnicas de Análise e Intervenção”. Elsevier, Rio de Janeiro, Brasil, p. 426.
Ribeiro, A. B., Santos, T., Gonçalves, A. (2018), Performance of concrete exposed to natural carbonation: Use of the k-value concept. Construction and Building Materials. 175:360–370. https://doi.org/10.1016/j.conbuildmat.2018.04.206
Rozière, E., Loukili, A., Cussigh, F. (2009), A performance based approach for durability of concrete exposed to carbonation. Construction and Building Materials 23(1):190–199. https://doi.org/10.1016/j.conbuildmat.2008.01.006
Sanjuán, M., Andrade, C., Cheyrezy, M. (2003), Concrete carbonation tests in natural and accelerated conditions. Advances in Cement Research, 15(4):171–180. https://doi.org/10.1680/adcr.2003.15.4.171
Song, H., Kwon, S. (2007), Permeability characteristics of carbonated concrete considering capillary pore structure. Cement and Concrete Research, 37(6):909-915. https://doi.org/10.1016/j.cemconres.2007.03.011
Tasca, M. (2012), “Estudo da carbonatação natural de concretos com pozolanas: monitoramento em longo prazo e análise da microestrutura”. Dissertação de Mestrado, Universidade Federal de Santa Maria, p. 178.
Tuutti, K. (1982), “Corrosion of Steel in Concrete”. Swedish Cement and Concrete Research Institute, Stockholm, Sweden, p.468.
Vieira, R. E. et al. (2016). “Aspectos sobre a extração e composição da água de poro de pasta de cimento hidratado com vista à durabilidade do concreto armado”. in: 7 Congresso Brasileiro de Cimento - CBCI, São Paulo: SP (Brasil), pp. 15.
Información adicional
Cite as: Costa, R., Franchetto, A., Gouveia, A., Ziegler, F., Pessoa, K., Garcez, M. (2022), "Service life prediction for concrete structures based on carbonation front depth models", Revista ALCONPAT, 12 (1), pp. 47 – 60, DOI: https://doi.org/10.21041/ra.v12i1.558
Contribution of each author: In this work, the authors A. Franchetto; A. Gouveia; F. Ziegler; R. Costa; K. Pessoa; M. Garcez contributed to the conception of the idea and methodology of the study with 16.66% each. A. Franchetto; A. Gouveia; F. Ziegler; R. Costa; K. Pessoa participated in the research and formal analysis of the results with 20% each. A. Franchetto; A. Gouveia; F. Ziegler; R. Costa; K. Pessoa; M. Garcez provided contributions to the manuscript in the discussion of the results with 16.66% each.
Creative Commons License: Copyright 2022 by the authors. This work is an Open-Access article published under the terms and conditions of an International Creative Commons Attribution 4.0 International License (CC BY 4.0).
Discussions and subsequent corrections to the publication: Any dispute, including the replies of the authors, will be published in the third issue of 2022 provided that the information is received before the closing of the second issue of 2022.
Legal Information: Revista ALCONPAT is a quarterly publication by the Asociación Latinoamericana de Control de Calidad, Patología y Recuperación de la Construcción, Internacional, A.C., Km. 6 antigua carretera a Progreso, Mérida, Yucatán, 97310, Tel.5219997385893, alconpat.int@gmail.com, Website: www.alconpat.org Reservation of rights for exclusive use No.04-2013-011717330300-203, and ISSN 2007-6835, both granted by the Instituto Nacional de Derecho de Autor. Responsible editor: Pedro Castro Borges, Ph.D. Responsible for the last update of this issue, Informatics Unit ALCONPAT, Elizabeth Sabido Maldonado. The views of the authors do not necessarily reflect the position of the editor. The total or partial reproduction of the contents and images of the publication is carried out in accordance with the COPE code and the CC BY 4.0 license of the Revista ALCONPAT.