Articles
VIS-NIR spectral reflectance for discretization of soils with high sand content[1]
Refletância espectral VIS-NIR para discretização de solos com alto teor de areia
VIS-NIR spectral reflectance for discretization of soils with high sand content[1]
Semina: Ciências Agrárias, vol. 40, no. 1, pp. 99-112, 2019
Universidade Estadual de Londrina

This work is licensed under Creative Commons Attribution-NonCommercial 4.0 International.
Received: 13 March 2018
Accepted: 28 August 2018
Abstract: The aim of this study is to evaluate the spatial distribution and relationships between the physicochemical attributes and radiometry of soils with high sand contents. One hundred surface horizon samples were collected for physicochemical and spectral analyses of the soil. The samples were selected spatially by the conditioned Latin hypercube method. The physicochemical analyses consisted of granulometry, organic carbon content, and iron oxides content, extracted using sodium dithionite-citrate-bicarbonate (DCB). The spectral response of the soils was analyzed in the 400 to 1000 nm range. The spectral curves were obtained from the samples of the surface horizons, which were categorized according to the attribute in question. The relationship between the soil physicochemical attributes and soil radiometry was evaluated through a Pearson's correlation. There was a tendency for the organic carbon content to decrease with an increase in soil depth, associated with the presence of soils with higher sand contents. For soils with iron contents lower than 80 g kg-1, there was an increase in the reflectance along the spectrum, whereas for soils with contents between 80 and 160 g kg-1, the reflectance decreased after 600 nm, with greater variation along the spectrum for soils with iron contents higher than 120 g kg-1. The diffuse reflectance spectroscopy could potentially allow for granulometric distinction between the soils evaluated.
Keywords: Digital soil mapping, Pedometrics, Radiometry.
Resumo: Este estudo objetivou avaliar a discretização espacial e relações entre atributos físico-químicos com a radiometria dos solos com altos teores de areia. Foram coletadas 100 (cem) amostras de horizontes superficiais para análises físico-químicas e espectrais do solo, selecionadas espacialmente pelo método do hipercúbico latino condicionado. As análises físico-químicas foram a granulometria, teores de carbono orgânico e de óxidos de ferro extraído por ditionito-citrato-bicarbonato de sódio (DCB). A resposta espectral dos solos foi analisada na faixa de 400 a 1000 nm. As curvas foram elaboradas a partir da média de reflectância espectral de cem amostras de horizontes superficiais categorizados de acordo com o atributo em questão. A relação entre os atributos físico-químicos do solo e a radiometria dos solos foi avaliada através da correlação de Pearson. Houve a tendência do decréscimo nos teores de carbono orgânico com a diminuição da altitude, associada a presença de solos com maiores teores de areia. Para os solos com teores de ferro inferiores 80 g kg-1 houve um aumento da refletância ao longo do espectro, enquanto que solos com teores entre 80 a 160 g kg-1 a refletância decresceu significativamente após os 600 nm, com maior variação nos solos com teores de ferro superiores a 120 g kg-1. A espectroscopia de refletância difusa mostrou-se uma ferramenta com potencial de distinção granulométrica para os solos avaliados.
Palavras-chave: Mapeamento digital de solos, Pedometria, Radiometria.
Introduction
In the municipality of Vacaria, located in the northeast of the state of Rio Grande do Sul (RS), which belongs to the physiographic region of Campos de Cima da Serra, the soils predominantly originate from volcanic rocks (basalt) (BRASIL, 1973). The soils predominant in this important agricultural region are the Latossolos, with fewer occurrences of Nitossolos, both of which have very clayey textures (STRECK et al., 2008; EMBRAPA, 2013). These soils are described and compiled in soil maps of RS, as well as in soil survey reports and data sheets (BRASIL, 1973; CPRM, 2010).
However, in the extreme west of Vacaria, RS, there is an extensive area of superficial soil horizons with high sand contents (greater than 450 g kg-1). The sandy texture of these soils on a basalt lithology is unexpected and questions its genesis, such as the extent of the influence of sand transport and deposition, or even the contribution of sandstones, facts not yet reported in the literature regarding the region (BRASIL, 1973; STRECK et al., 2008; EMBRAPA, 2013).
The recognition of this area with high sand content is of great importance to soil science, especially regarding genesis and classification of the region’s soils, since they are present and surrounded by clayey and very clayey soils, and, so far, such data has not been compiled in soil survey maps. Furthermore, the physicochemical characterization of these soils is of equal importance, as this could provide data for future studies of the local genesis. It is hypothesized that it is possible to identify and delimit the areas containing soils with high contents of sand using spectroradiometry.
Diffuse reflectance spectroscopy can be used to obtain quantitative and qualitative information on various soil properties in real-time, and approximate the composition of the soil and ecosystem contaminant residues, without the need for chemical analyzes (DUNN et al., 2002; MINASNY; MCBRATNEY, 2002; BROWN et al., 2006; NANNI; DEMATTÊ, 2006; BEN-DOR et al., 2009). One of the main limitations of this technique is the high instrument acquisition costs, although this can vary according to the operational capacity and the accessory components.
The spectral reflectance of the soil consists of a set of values obtained from the ratio of radiance and irradiance. The visible spectral region (VIS: 400 - 700 nm), near-infrared (NIR: 700 - 1000 nm) and shortwave infra-red (SWIR: 1000 - 2500) constitute almost all the information regarding the reflectance spectroscopy of soils that the sensors can provide (BEN-DOR, 2011; DEMATTÊ et al., 2015; CUDAHY, 2016). This is an inherent property is not affected by external conditions, such as radiation intensity and instrumentation (BEN-DOR, 2011).
A study conducted by Ben-Dor and Banin (1995) evaluated the arid and semi-arid soils of Israel and demonstrated that certain soil constituents, such as SiO2, Al2O3 and K2O, can be predicted from the spectral curves, because of their strong correlation with soil properties. Genú et al. (2010) analyzed the spectral response of eight soil profiles obtained in the laboratory and concluded that the texture and mineralogical characteristics, such as iron oxides and 2:1 minerals, significantly influence the absorption features and intensity of the reflectance spectra. Demattê et al. (2015) used VIS-NIR-SWIR spectroscopy to evaluate soils along a toposequence, where the soils developed from the sandstone of the Rio Claro Formation presented higher spectral reflectance when compared to the more clayey soils developed from siltites and argilites of the Irati Formation and from shales of the Estrada Nova Formation, respectively. In this sense, Ben-Dor (2011) highlighted that sophisticated methods and relatively high spectral resolution are required to determine the iron contents of a soil through the spectral reflectance. The iron content is also related to the organic matter content, types of iron oxides, particle size distribution and mineralogy; all these factors can influence the spectral response of soils (MADEIRA NETTO, 1991; FORMAGGIO et al., 1996; BEN-DOR et al., 1999; DEMATTÊ; GARCIA, 1999; DALMOLIN, 2002; DEMATTÊ et al., 2004, 2015).
With respect to the above, the present research aims to evaluate the spatial distribution of the soils with high sand contents, and the relationships between their physicochemical attributes and radiometry.
Materials and Methods
The study area covers an area of approximately 540 km² in the northwest region of the municipality of Vacaria, RS, Brazil (Figure 1). According to the Geological Map of the State of Rio Grande do Sul (CPRM, 2008), the soils of the area originate from basic extrusive magmatic rocks that belong to the Formation Serra Geral, from the Cretaceous Period, and are comprised of the Paranapanema and Esmeralda Facies. The Paranapanema characterized by the predominance of fine to medium granular, mesocratic basalts, while the Esmeralda constituted by melanocratic basalt with a microgranular aphanitic texture.
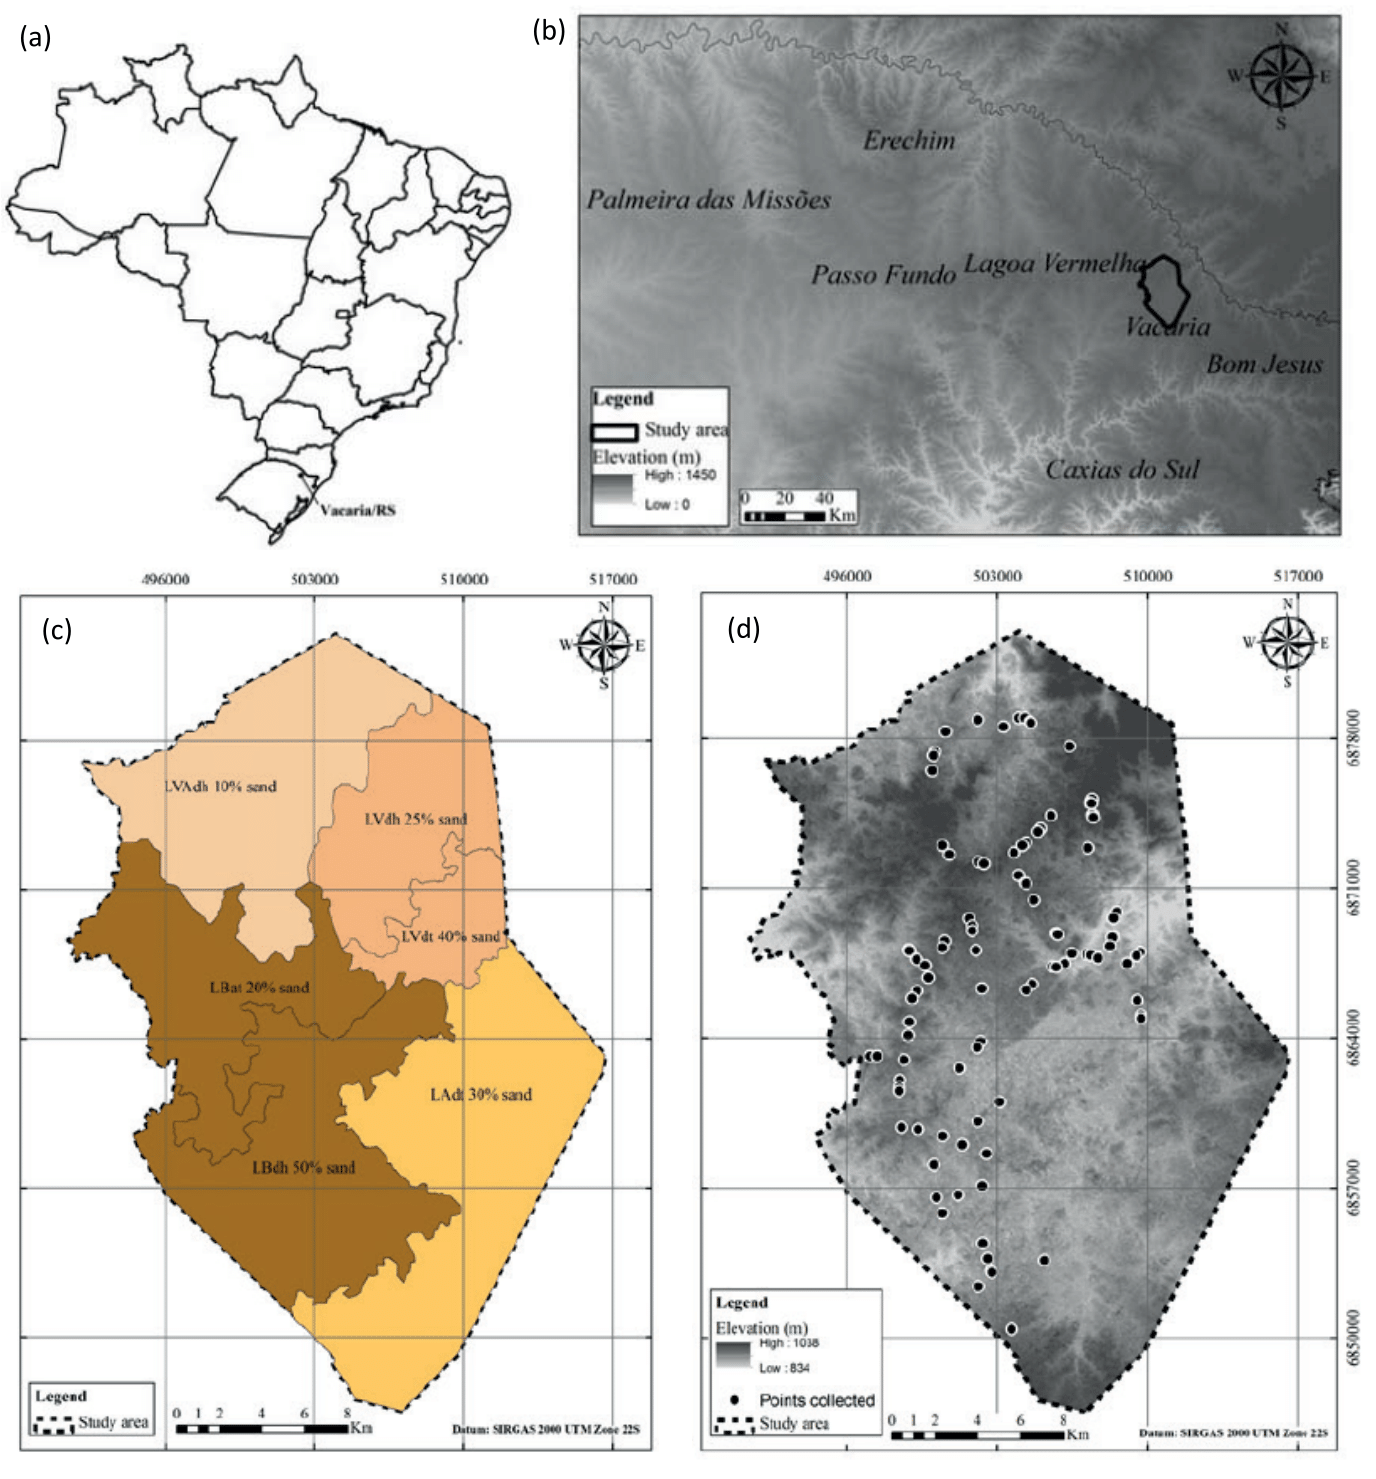
Figure 1
Location of the municipality of Vacaria, RS (a, b); Soil map of the study area (c); and location of the study area marked with the 100 soil horizon sample collection sites (d). In Figure 1c: LVAdh = Latossolo Vermelho-Amarelo distrófico húmico; LVdh = Latossolo Vermelho distrófico húmico; LVdt = Latossolo Vermelho distrófico típico; LBat = Latossolo Bruno aluminoférrico típico; LBdh = Latossolo Bruno distrófico húmico; LAdt = Latossolo Amarelo distrófico típico.
The sampled points were representative of the landscape and located close to roads, facilitating access and visualization of the soil profile with depth. One hundred (100) single samples were collected with the aid of a shovel from the soil surface horizons (0 to 0.20 m). To select the collection points, the conditioned Latin hypercube method (cLHS) was used, which has been used in soil science and environmental analysis (MINASNY; MCBRATNEY, 2006). The cLHS is a stratified random sampling method that provides an efficient method of sampling variables (derived from a digital elevation model) from their multivariate distributions (MINASNY; MCBRATNEY, 2006).
In order to reduce the economic and temporal costs of sampling due to restricted accessibility to certain areas because of dense vegetation or lack of access roads, some operational restrictions were incorporated; a spatial buffer of 5 m along available roads and access pathways, in addition to the insertion of the selected geomorphometric variables (elevation, slope and aspect) into the cLHS, was used. The altimetric data was obtained from the SRTM v.4.1 digital elevation model, with a spatial resolution of 30 m. These morphometric attributes was inserted into the cLHS model in order to represent the spatial variability of the area and avoid sampling environments with similar conditions, such as relief, slope and elevation.
Laboratory tests
For the preliminary characterization of the 100 samples selected by the cLHS method, the soil samples were air-dried, milled and sieved (2 mm), and the following soil attributes were evaluated: granulometry, iron oxide concentration extracted by sodium dithionite-citrate-bicarbonate (DCB), organic carbon and the spectral reflectance in the VIS-NIR (400 - 1000 nm) range.
The granulometric analysis of the soils was performed by the pipette method (DAY, 1965; GEE; BAUDER, 1986). The quantification of the iron oxide content was performed using the DCB method (MEHRA; JACKSON, 1958; VAN REEUWIJK, 2002). An aliquot of the extraction product was used and the reading taken using an AAnalyst 200 Atomic Absorption Spectrophotometer, with two replicates, using an air/acetylene flame. The Walkley-Black method used to determine the organic carbon (OC) content, with three replicates, by wet oxidation, as described by Tedesco et al. (1995).
The visible spectral region (VIS) corresponds to the range of wavelengths from 400 to 700 nm, while the region between 700 and 1000 nm is the near-infrared (NIR) (BEN-DOR, 2011; DEMATTÊ et al., 2015; CUDAHY, 2016). The spectral data of the surface samples were obtained using a FieldSpec HandHeld II (ASD) portable type spectroradiometer that covers the spectral range of 325 - 1075 nm. This spectroradiometer is installed in a laboratory, under controlled light conditions. The sensor configuration, in terms of the target and the radiation source, followed the configuration standardized by Jensen (2009), in which the sensor was positioned at a distance of 27 cm from the target. As a radiation source, a 50 W halogen lamp with a reflector and an uncollimated beam was used, which was connected to a stabilizing source with a regulated input and output, positioned 61 cm from the target (DEMATTÊ; GARCIA, 1999). A white, highly reflective (100%) Spectralon (barium sulfate) plate was used as the absolute reference standard. Thus, the sample reflectance was calculated in relation to the standard plate, generating the bidirectional reflectance factor (BOWKER et al., 1985; MILTON, 1987). Sensor calibration was completed at the start of the spectral readings and every 20 samples. The spectral signatures were collected from the soil samples, with four readings per sample; the mean spectral curve was used for analysis (DEMATTÊ; GARCIA, 1999; DEMATTÊ et al., 2004).
The following statistical variables were analyzed: mean, variance, extreme values, frequency histograms and scatter diagrams, using the Stanford Geostatistical Modeling Software (SGeMS) version 2.5 beta (REMY et al., 2011) program, which is freely accessible and has been widely used for the study of variables with spatial interdependence (PASTI et al., 2012; SANA et al., 2014). The spectral data and the attributes of the soil were grouped in classes of equal intervals, representative of the variability of each attribute in the data, and submitted for Pearson correlation analysis (r). For this, the software R version 3.4 was used (R CORE TEAM, 2015).
Results and Discussion
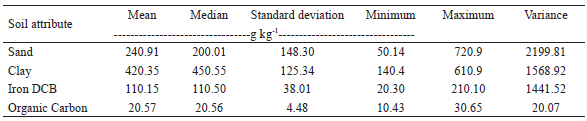
Table 1 contains the physicochemical attributes of the one hundred surface horizon samples. The sand contents varied from 50.1 to 720.9 g kg-1, while the clay contents varied less, with values between 140.4 to 610.9 g kg-1. Soils with sand contents greater than 400 g kg-1 were classified as having high sand contents. For iron contents extracted by DCB, a large proportion of the values were concentrated near the mean (110.15 g kg-1) and median (110.50 g kg-1), evidencing lower variance of this attribute in the evaluated samples, compared to other properties. The OC contents presented the same trend as above, with a preferential distribution around the mean (20.57 g kg-1) and median (20.56 g kg-1) values.
Spatial distribution of soil physical and chemical attributes
The sandy soil taxonomic class of Latossolos Brunos were easily identified in the field by the quartz grain deposits in the drainage furrows. These soils dominate in the topographically lower parts of the landscape. Latossolos Brunos with high sand contents are unusual in other parts of Brazil, but the sandiest Latossolos can be found in other municipalities of Rio Grande do Sul state over basalt bedrock. In the Cruz Alta, Passo Fundo and Palmeira das Missões municipalities, Latossolos Vermelhos with a medium clayey texture originate from sandstones of the Tupaciretã Formation. This Formation comprise alluvial, interlaced and aeolian deposits, with a probable Cretaceous or Tertiary age (MENEGOTTO et al., 1968).
In these locations, the more sandiest Latossolos Vermelhos are found at the higher altitudes, corresponding to increased interflow, and this property was utilized to separate them from the clayey Latossolos Vermelhos developed from basalt, that occur at lower altitudes. An inverse spatial distribution was observed in this work (Figures 2a and 2b), where the sandiest Latossolos Brunos occur in the lower parts of the landscape.
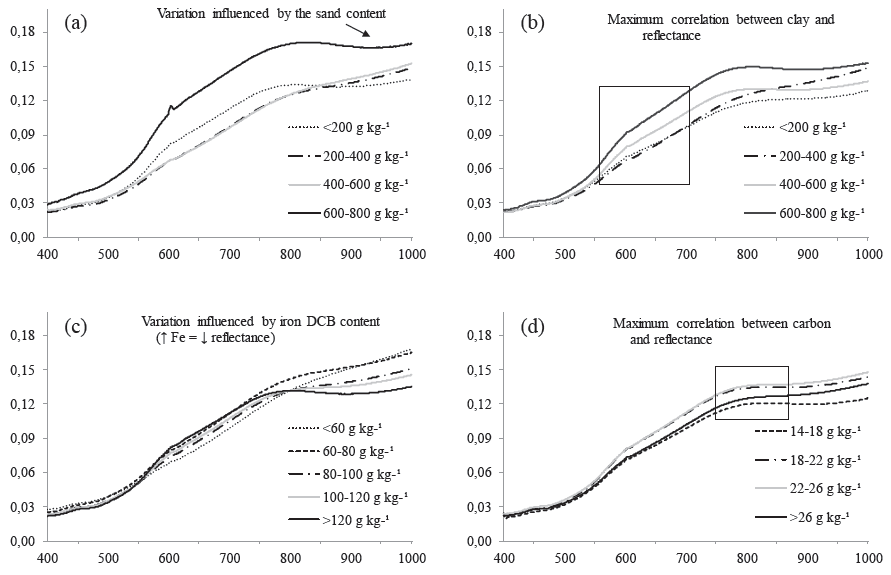
Figure 2
Relationship between the spectral reflectance of the soils and the wavelength according to the sand (a); clay (b); iron oxides extracted by DCB (c) and organic carbon (d) contents for the evaluated soils, in Vacaria, RS.
The greatest iron contents (Figure 2c) were found in clayey and very clayey soils, agreeing with the values normally found in soils developed from basalt in southern Brazil (BRASIL, 1973, 1986). In the medium-textured soils, the iron oxides contents differed from the minimum values described in the literature for the soils of the region (> 80 g kg-1), presenting characteristics similar to soils developed from sandstones, such as the ones of Passo Fundo and Cruz Alta, in RS (BRASIL, 1973). Because igneous rocks, such as basalt, are rich in iron, soils develop with a high concentration of this element (CURI; FRANZMEIER, 1987; FONTES; WEED, 1991; GERGELY, 2000). In contrast, sandstone-derived soils have lower iron contents due to the lower contents of this element in the source material (DALMOLIN, 2002; VENDRAME et al., 2011).
In the higher altitude regions, where soils with higher clay content occur, the OC values exceeded 30 g kg-1 (Figure 2d). According to the Survey of Soils of the State of Rio Grande do Sul (BRASIL, 1973), in locations where the altitude exceeds 940 m, as in Bom Jesus (RS), the organic matter decomposition is slow, resulting in the accumulation of OC in the superficial horizon. The OC contents tended to decrease with the decrease in altitude, associated an increased presence of soils with higher sand contents. In these areas, the OC values were around 20 g kg-1. The highest OC contents (> 20 g kg-1) are similar to those found in the literature for the region. Soils with a more sand-like granulometry have a smaller specific surface area, which offers less physical protection to the OC, resulting in more rapid decomposition by microbial activity, decreasing its contents in the soil (MARTIN et al, 1982; SANTOS et al., 2008).
The highest values of OC in the northern region of the study area may be associated with the clayey and very clayey soil textures. Santos et al. (2008) note that the larger the specific surface are and number of organic radicals on the clay particles surface influence the interaction with the OC of the soil. The sand fraction influences the labile organic matter of the soils, while the clay is associated with most of the soil organic carbon; clay is subject to transformation, with an amorphous structure and without recognizable vegetal material (MARQUES et al., 2015). The clay content of the soil also influences the decomposition of organic matter, increasing the absorption of organic compounds and nutrients; soils with higher clay contents have a higher capacity to immobilize organic carbon in the soil (STÜRMER et al., 2011).
In the Latossolos of clayey texture, the greater aggregate formation capacity, observed in this class of soils, the greater the physical protection of organic matter (OADES et al., 1989). On the other hand, in soils with higher sand contents in the superficial horizons, the physical protection capacity for organic matter is low, as is the chemical stability due to the lower iron oxide content in the soil (SANTOS et al., 2008).
The adsorption of the soil’s organic matter by the mineral components of the clay fraction provides protection against biological attack, resulting in a greater accumulation of organic matter in the soil (BALDOCK; SKJEMSTAD, 2000). A positive relationship between the organic matter and iron oxide contents was observed, as can be seen in Figure 2d. As highlighted by Dalmolin (2002), the differentiated behavior of the Latossolos suggests that the organic matter is less protected by the mineral fraction due to the low clay content.
Relationship between physical-chemical attributes and radiometry of the soils
The average of the spectral reflectance curves of the 100 surface horizon samples where categorized according to the analyzed attribute; the sand, clay and iron oxides contents, as well as the OC, are shown in Table 2.
The soils with higher sand contents, which contained lower contents of carbon (< 22 g kg-1) and iron oxides (< 100 g kg-1) and presented a higher average spectral reflectance, are located in the flat regions of the study area, with a maximum slope of 8% and an altitude of 830 to 900 m. The most clay-rich soils are located to the north of the study area and have the lowest average spectral reflectance. They are also associated with higher carbon (> 22 g kg-1) and iron oxides contents (>100 g kg-1), and in this case, the relief is variable, but smooth, with a maximum slope of 20% and altitudes varying between 900 and 1040 m. The spectral data of the soils with higher sand contents differs from the other soils between 400 and 550 nm; above 900 nm, this difference has a greater amplitude (Figure 2a). The sand content has a positive direct correlation with the reflectance; the maximum correlation coefficient (r = 0.42 p < 0.01) was obtained in the range of 1000 nm.
Soils with higher sand contents tend to have higher reflectance due to the high quantity of silicate minerals (FORMAGGIO et al., 1996; SOUSA JÚNIOR et al., 2008). The greatest difference between the curves is observed at intensities greater than 800 nm, which indicates that the clay fraction (clay minerals and oxides) are extremely important characteristics for the prediction of attribute by diffuse reflectance spectroradiometry (BEN-DOR; BANIN, 1995; DUNN et al., 2002, VITORELLO; GALVÃO, 2006; MINASNY; MCBRATNEY, 2002). In Figure 2c, it is possible to observe the intensification of the absorption features near 880 nm, relative to the contents of iron oxides (VISCARRA ROSSEL et al., 2009; STENBERG et al., 2010). Soils with higher clay contents presented high iron oxides contents (> 80 g kg-1), causing an increase in the absorption features associated with the iron oxides, hydroxides and oxyhydroxides.
The spectral data for sand and clay were similar (Figure 2a and 2b), but not identical. In the range between 600 and 800 nm, the clay content showed a direct positive correlation (p < 0.05) with the spectral reflectance. After 800 nm, soils with clay contents between 200 - 400 g kg-1 tend to present a higher reflectance when compared to soils with 400 - 600 g kg-1 clay, but the correlation was not significant in this spectral region.
In the study area, soils with sand contents of more than 200 g kg-1 and clay contents of less than 400 g kg-1 are found. In these soils, the low clay content made discretization difficult due to the predominance of quartz in the sand fraction, which shows high reflectance and an absence of absorption features in the VIS-NIR range (BAUMGARDNER et al., 1985; DEMATTÊ et al., 1998) while soils with higher clay contents had an increase in absorption along the entire spectrum, caused by the formation of more organo-mineral complexes, making the soils darker as the soil carbon content increases (BELLINASO et al., 2010; VICENTE; SOUZA FILHO, 2011). With a reduced clay presence, these clay mineral features become less evident, making attribute prediction more difficult (BEN-DOR; BANIN, 1995; BROWN et al., 2006; DOTTO et al., 2016). Coleman et al. (1991) evaluated the correlations between spectral properties and clay contents and chose the region between 520 and 600 nm as the most adequate to predict the clay content in the visible region. The spectral response of samples in the study region and the clay contents presented the highest correlation in the range of 618 nm, in agreement with the results described in the literature. The maximum correlation in this range may be associated with the higher iron oxide content in clayey soils, which express absorption characteristics in this range (BEN-DOR; BANIN, 1995; BROWN et al., 2006; DOTTO et al., 2016).
The possibility of determining the iron oxides contents from the spectral reflectance has already been studied by Ben-Dor et al. (1999). Madeira Netto (1991) evaluated the spectral behavior of Latossolos with different iron oxide contents. These authors highlight the need to consider the interactions between iron oxides and other soil components. In soils with DCB-extracted iron contents lower than 80 g kg-1, the reflectance increases along the entire spectrum. In soils with iron contents between 80 and 160 g kg-1, the reflectance decreased after 600 nm, with more significant reflectance decreases in soils with levels higher than 120 g kg-1. Vitorello and Galvão (1996) state that goethite exhibits a higher reflectance than hematite, since studies have already shown that the absorption of radiant energy by hematite is higher in the region between 300 and 800 nm. The maximum correlation (r = -0.48 p < 0.01) between the iron contents and the spectral response was obtained at the highest wavelength (1000 nm), with a negative direct correlation. These results are in agreement with Madeira Netto (1991), who showed that the reflectance increases across the entire spectrum in soils with low iron contents, while the reflectance is lowered in soils with higher contents (Figure 2d).
In the studied soils, the maximum correlation of organic carbon with the spectral response was in the 732 nm range (Figure 2d), represented by the region highlighted in the curve, with a correlation coefficient of -0.31 (p < 0.01). The curve is in agreement with the results of Demattê and Garcia (1999) who predicted an increase in the spectral response as the OC contents of the soil decreased. The low correlation observed for this variable agrees with several authors who emphasize the complexity of estimating OC contents through spectroradiometry, since it influences the spectral curve along the entire spectrum (DALMOLIN, 2002; DOTTO et al., 2016). Considering the correlation coefficients obtained, the region around 800 nm has the greatest potential for distinguishing the three groups of organic carbon contents.
Among the physicochemical attributes (sand, clay, iron oxides and CO) that correlated with the spectral response, the sand and iron (DCB) contents had higher correlation values. For both, the maximum correlation was obtained at the peak intensity of 1000 nm (Table 2).
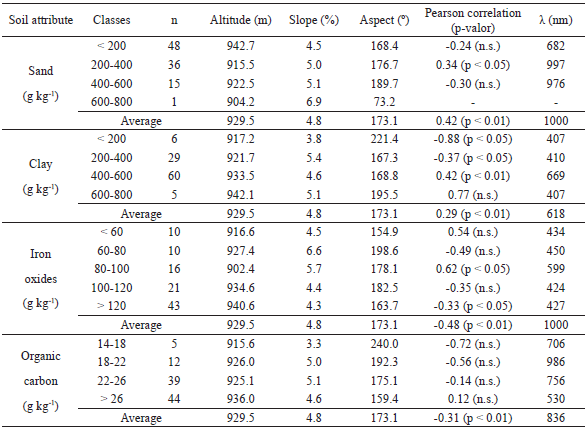
n.s.: not significant at the 5% level (p > 0.05).
The use of a spectroradiometer that operates in the range of 400 to 1000 nm (VIS-NIR) can help in the identification of soils with sand and iron contents extracted by DCB similar to those evaluated in this study. This could help reduce the operational costs of soil surveys and routine laboratory work, as well as contributing to soil mapping, management and conservation studies, and activities such as precision agriculture, soil attribute modeling and monitoring of contaminated soils (SATO, 2015).
Conclusion
Diffuse reflectance spectroscopy is a tool with the potential to distinguish evaluated soils based on their grain size distribution. The highest average spectral reflectance was found in soils with high sand contents, and low levels of organic carbon (< 22 g kg-1) and iron oxides (< 100 g kg-1), which were located in flat relief areas, with slopes around 8% and between 830 and 900 m altitude. On the other hand, the lowest average spectral reflectance was found in soils with the highest clay, organic carbon (> 22 g kg-1) and iron oxide (> 100 g kg-1) contents, situated in locations with variable relief, a maximum slope of 20% and altitudes between 900 and 1040 m.
Acknowledgements
Authors thank the Santa Catarina Research Foundation (FAPESC) for the financial support (TR 2012000094 and 2015TR644) and National Council for Scientific and Technology Development (CNPq) Universal 2016/01 (process 421368/2016-0).
References
BALDOCK, J. A.; SKJEMSTAD, J. O. Role of the soil matrix and minerals in protecting natural organic materials against biological attack. Organic Geochemistry, Oxford, v. 31, n. 7, p. 697-710, 2000.
BAUMGARDNER, M. F.; STONER, E. R.; SILVA, L. F.; BIEHL, L. L. Reflective properties of soils. In: BRADY, N. (Ed.). Advances in agronomy. New York: Academic Press, 1985. v. 38, p. 1-44.
BELLINASO, H.; DEMATTÊ, J. A. M.; ROMEIRO, S. A. Soil spectral library and its use in soil classification. Revista Brasileira de Ciência do Solo, Viçosa, MG, v. 34, n. 3, p. 861‑870, 2010.
BEN-DOR, E. Characterization of soil properties using reflectance spectroscopy. In: THENKABAIL, P. S.; LYON, J. G.; HUETE, A. (Ed.) Hyperspectral remote sensing of vegetation. Boca Raton: CRC Press, 2011. p. 513-557.
BEN-DOR, E.; BANIN, A. Near infrared analysis (NIRA) as a simultaneously method to evaluate spectral featureless constituents in soils. Soil Science, New Brunswick, v. 159, n. 4, p. 259-269, 1995.
BEN-DOR, E.; CHABRILLAT, S.; DEMATTÊ, J. A. M.; TAYLOR, G. R.; HILL, J.; WHITING, M. L.; SOMMER, S. Using imaging spectroscopy to study soil properties. Remote Sensing of Environment, Minnesota, v. 113, n. 1, p. 538-555, 2009.
BEN-DOR, E.; IRONS, J. R.; EPEMA, G. F. Soil reflectance. In: RENCZ, A. N. Remote sensing for the earth sciences. New York: J Willey & Sons, 1999. v. 3, p. 111-188.
BOWKER, D. E.; DAVIS, R. E.; MYRICK, D. L.; STACY, K.; JONES, W. T. Spectral reflectances of natural targets for use in remote sensing studies. Hampton: NASA Langley Research Center, 1985. 181 p. Available at: https://ntrs.nasa.gov/archive/nasa/casi.ntrs.nasa.gov/19850022138.pdf. Accessed at: 12 mar. 2018.
BRASIL. Levantamento de reconhecimento dos solos do Estado do Rio Grande do Sul. Recife: Ministério da Agricultura, 1973. 431 p.
BRASIL. Levantamento de recursos naturais. Folha SH 22, Porto Alegre e parte das folhas SH 21 e SI 22 Lagoa Mirim. Rio de Janeiro: Instituto Brasileiro de Geografia e Estatística, 1986. 796 p.
BROWN, D. J.; SHEPHERD, K. D.; WALSH, M. G.; DEWAYNE MAYS, M.; REINSCH, T. G. Global soil characterization with VNIR diffuse reflectance spectroscopy. Geoderma, Amsterdam, v. 132, n. 3, p. 273-290, 2006.
COLEMAN, T. L.; AGBU, P. A.; MONTGOMERY, O. L.; GAO, T.; Spectral band selection for quantifying selected properties in highly weathered soils. Soil Science, Baltimore, v. 151, n. 5, p. 355-361, 1991.
COMPANHIA DE PESQUISAS DE RECURSOS MINERAIS - CPRM. Geodiversidade do Estado do Rio Grande do Sul. Porto Alegre: Serviço Geológico do Brasil, 2010. 254 p.
COMPANHIA DE PESQUISAS DE RECURSOS MINERAIS - CPRM. Mapa Geológico do Estado do Rio Grande do Sul (Escala de 1:750.000). Porto Alegre: Serviço Geológico do Brasil, 2008. Disponível em: http://www.cprm.gov.br/publique/media/geologia_basica/cartografia_regional/mapa_rio_grande_sul.pdf. Acesso em: 12 mar. 2018.
CUDAHY, T. J. Mineral mapping for exploration: an Australian journey of evolving spectral sensing technologies and industry collaboration. Geosciences, Basel, v. 6, n. 52, p. 1-48, 2016.
CURI, N.; FRANZMEIER, D. P. Effect of parent rocks on chemical and mineralogical properties of some oxisols in Brazil. Soil Science Society America Journal, Madison, v. 51, n. 1, p. 153-158, 1987.
DALMOLIN, R. S. D. Matéria orgânica e características físicas, químicas, mineralógicas e espectrais de Latossolos de diferentes ambientes. 2002. Tese (Doutorado em Ciência do Solo) - Universidade Federal do Rio Grande do Sul, Porto Alegre, 2002.
DAY, P. R. Particle fractionation and particle-size analysis. In: BLACK, C. A. Methods of soil analysis. Madison: American Society of Agronomy, 1965. v. 1, p. 545-566.
DEMATTÊ, J. A. M.; ARAUJO, S. R.; FIORIO, P. R.; FONGARO, C. T.; NANNI, M. R. Espectroscopia VIS-NIR-SWIR na avaliação de solos ao longo de uma topossequência em Piracicaba (SP). Revista Ciência Agronômica, Fortaleza, v. 46, n. 4, p. 679-688, 2015.
DEMATTÊ, J. A. M.; CAMPOS, R. C.; ALVES, M. C.; FIORIO, P. R.; NANNI, M. R. Visible-NIR reflectance: a new approach on soil evaluation. Geoderma, Amsterdam, v. 121, n. 1, p. 95-112, 2004.
DEMATTÊ, J. A. M.; GARCIA, G. J. Avaliação de atributos de Latossolo Bruno e de terra Bruna Estruturada na região de Guarapuava, Paraná, por meio de sua energia refletida. Revista Brasileira de Ciência do Solo, Viçosa, MG, v. 23, n. 2, p. 343-355, 1999.
DEMATTÊ, J. A. M.; MAFRA, A. L.; BERNARDES, F. F. Comportamento espectral de materiais de solos e de estruturas biogênicas associadas. Revista Brasileira de Ciência do Solo, Viçosa, MG, v. 22, n. 4, p. 621‑630, 1998.
DOTTO, A. C.; DALMOLIN, R. S. D.; TEN CATEN, A.; MOURA-BUENO, J. M. Potential of spectroradiometry to classify soil clay content. Revista Brasileira de Ciência do Solo, Viçosa, MG, v. 40, n. 1, p. e0151105-e0151113, 2016.
DUNN, B. W.; BATTEN, G. D.; BEECHER, H. G.; CIAVARELLA, S. The potential of near-infrared reflectance spectroscopy analysis - a case study from the riverine plain of south-eastern Australis. Australian Journal of Experimental Agriculture, East Melbourne, v. 42, n. 5, p. 607-614, 2002.
EMBPRESA BRASILEIRA DE PESQUISA AGROPECUÁRIA - EMBRAPA. Sistema brasileiro de classificação de solos. 3. ed. Brasília: EMBRAPA, 2013. 351 p.
FONTES, M. P.; WEED, S. B. Iron oxides in selected Brazilian oxisols: mineralogy. Soil Science of America Journal, Madison, v. 55, n. 4, p. 1143-1149, 1991.
FORMAGGIO, A. R.; EPIPHANIO, J. C.; VALERIANO, M. M.; OLIVEIRA, J. B. Comportamento espectral (450-2450 nm) de solos tropicais de São Paulo. Revista Brasileira de Ciência do Solo, Viçosa, MG, v. 20, n. 1, p. 467-474, 1996.
GEE, G. W.; BAUDER, J. W. Particle-size analysis. In: KLUTE, A. Methods of soil analysis. Madison: American Society of Agronomy, 1986. v. 1, p. 383-411.
GENÚ, A. M.; DEMATTÊ, J. A. M.; FIORIO, P. R. Análise espectral de solos da Região de Mogi-Guaçú (SP). Semina: Ciências Agrárias, Londrina, v. 31, n. 1, p. 1235-1244, 2010.
GERGELY, A. J. Rochas ígneas. In: TEIXEIRA, W.; TOLEDO, M. C. Decifrando a terra. São Paulo: Oficina de Textos, 2000. p. 328-346.
JENSEN, J. R. Sensoriamento remoto do ambiente: uma perspectiva em recursos terrestres. 2. ed. São José dos Campos: Parêntese, 2009. 598 p.
MADEIRA NETTO, J. S. Etude quantitative des relations constituants mineralogiques - reflectance diffuse des latosols bresiliéns. Applicátions à l’utilisation pedologique des donnés satellitaires TM (región de Brasilia). 1991. These (Doctorat en Science du Sol) - Université Pierre et Marie Curie, Paris, 1991.
MARQUES, J. D. O.; LUIZAO, F. J.; TEIXEIRA, W. G.; SARRAZIN, M.; FERREIRA, S. J. F.; BELDINI, T. P.; MARQUES, E. M. A. Distribution of organic carbon in different soil fractions in ecosystems of central Amazonia. Revista Brasileira de Ciência do Solo, Viçosa, MG, v. 39, n. 1, p. 232-242, 2015.
MARTIN, J. P.; ZUNINI, H.; PEIRANO, P.; CAIOZI, M.; HAIDER, K. Decomposition of 14C-labelled lignins, model humic acid polymers and fungal melanins in allophonic soil. Soil Biology and Biochemistry, Oxford, v. 14, n. 1, p. 289-293, 1982.
MEHRA, O. P.; JACKSON, K. L. Iron oxide removal from soils and clays by dithionite-citrate system buffered with sodium bicarbonate. In: NATIONAL CONFERENCE ON CLAY AND CLAY MINERALS, 7., 1958, Washington. Proceedings […]. Washington: Pergamon Press, 1958. p. 317-327.
MENEGOTTO, E.; SARTORI, P. L.; MACIEL FILHO, C. L. Nova sequência sedimentar sobre a Serra Geral no Rio Grande do Sul. Santa Maria: Universidade Federal de Santa Maria, 1968. 19 p.
MILTON, E. J. Principles of field spectroscopy. International Journal of Remote Sensing, Basingstoke, v. 8, n. 12, p. 1807-1827, 1987.
MINASNY, B.; MCBRATNEY, A. B. A conditioned Latin hypercube method for sampling in the presence of ancillary information. Computers and Geosciences, Oxford, v. 32, n. 9, p. 1378-1388, 2006.
MINASNY, B.; MCBRATNEY, A. B. Uncertainty analysis for pedotransfer functions. European Journal of Soil Science, Hoboken, v. 53, n. 3, p. 417-430, 2002.
NANNI, M. R.; DEMATTÊ, J. A. M. Spectral reflectance methodology in comparison to traditional soil analysis. Soil Science Society of American Journal, Madison, v. 70, n. 2, p. 393-407, 2006.
OADES, J. M.; GILLMAN, G. P.; UEHARA, G.; HUE, N. V.; VAN NOORDWIJK, M.; ROBERTSON, G. P.; WADA, K. Interactions of soil organic matter and variable-charge clays. In: COLEMAN, D. C.; OADES, J. M.; UEHARA, G. Dynamics of soil organic matter in tropical ecosystem. Honolulu: University of Hawaii Press, 1989. p. 69-95.
PASTI, H. A.; COSTA, J. F. C. L.; BOUCHER, A. Multiple-point geostatistics for modeling lithological domains at a brazilian iron ore deposit using the single normal equations simulation algorithm. Quantitative Geology and Geostatistics, Dordrecht, v. 17, n. 1, p. 397-407, 2012.
R CORE TEAM. The R Project for Statistical Computing. Vienna: The R Foundation, 2015. Available at: https://www.r-project.org/. Accessed at: 15 jan. 2018.
REMY, N.; BOUCHER, A.; WU, J. Applied geostatistics with SGeMS: a user’s guide. Cambridge: Cambridge University Press, 2011. 264 p.
SANA, R. S.; ANGHINONI, I.; BRANDAO, Z. N.; HOLZSCHUH, M. J. Variabilidade especial de atributos físico-químicos do solo e seus efeitos na produtividade do algodoeiro. Revista Brasileira de Engenharia Agrícola e Ambiental, Campina Grande, v. 18, n. 10, p. 994-1002, 2014.
SANTOS, G. A.; SILVA, L. S.; CANELLAS, L. P.; CAMARGO, F. A. O. (Ed.). Fundamentos da matéria orgânica do solo: ecossistemas tropicais & subtropicais. Porto Alegre: Metrópole, 2008. 636 p.
SATO, M. V. Primeira aproximação da biblioteca espectral de solos do Brasil: caracterização de espectros de solos e quantificação de atributos. 2015. Dissertação (Mestrado em Solos e Nutrição de Plantas) - Escola Superior de Agricultura Luiz de Queiroz, Universidade de São Paulo, Piracicaba.
SOUSA JÚNIOR, J. G. A.; DEMATTÊ, J. A. M.; GENÚ, A. M. Comportamento espectral de solos na paisagem a partir de dados coletados por sensores terrestres e orbital. Revista Brasileira de Ciência do Solo, Viçosa, MG, v. 32, n. 2, p. 727-738, 2008.
STENBERG, B.; VISCARRA ROSSEL, R. A.; MOUAZEN, A. M.; WETTERLINDD, J. Visible and near infrared spectroscopy in soil science. Advances in Agronomy, New York, v. 107, n. 1, p. 163‑215, 2010.
STRECK, E. V.; KAMPF, N.; DALMOLIN, R. S. D.; KLAMT, E.; NASCIMENTO, P. C.; GIASSON, E.; PINTO, L. F. S. Solos do Rio Grande do Sul. Porto Alegre: EMATER/RS-ASCAR, 2008. 222 p.
STÜRMER, S. L. K.; ROSSATO, O. B.; COPETTI, A. C. C.; SANTOS, R. D.; CALEGARI, A.; BRUM, B. Variações nos teores de carbono orgânico em função do desmatamento e revegetação natural do solo. Ciência Florestal, Santa Maria, v. 21, n. 2, p. 241-250, 2011.
TEDESCO, M. J.; GIANELLO, C.; BISSANI, C. A.; BOHNEN, H.; VOLKWEISS, S. J. Análise de solo plantas e outros materiais. Porto Alegre: Universidade Federal do Rio Grande do Sul, 1995. 174 p.
VAN REEUWIJK, L. P. (Ed.). Procedures for soil analysis. 6th ed. Wageningen: International Soil Reference and Information Centre, 2002. 101 p.
VENDRAME, P. R. S.; EBERHARDT, D. N.; BRITO, O. R.; MARCHÃO, R. L.; QUANTIN, C.; BECQUER, T. Formas de ferro e alumínio e suas relações com textura, mineralogia e carbono orgânico em Latossolos do Cerrado. Semina: Ciências Agrárias, Londrina, v. 32, n. 1, p. 1657-1666, 2011.
VICENTE, L. E.; SOUZA FILHO, C. R. Identification of mineral components in tropical soils using reflectance spectroscopy and advanced spaceborne thermal emission and reflection radiometer (ASTER) data. Remote Sensing of Environment, Minnesota, v. 115, n. 8, p. 1824‑1836, 2011.
VISCARRA ROSSEL, R. A.; CATTLE, S. R.; ORTEGA, A.; FOUAD, Y. In situ measurements of soil colour mineral composition and clay content by Vis-NIR spectroscopy. Geoderma, Amsterdam, v. 150, n. 3, p. 253-266, 2009.
VITORELLO, I.; GALVÃO, L. S. Spectral properties of geologic materials in the 400 to 2500 nm range: review for applications to mineral exploration and lithologic mapping. Photo Interpretation, Paris, v. 34, n. 2, p. 77-99, 1996.
Notes
Author notes
gustavopereira5000@gmail.com