Articles
Use of measurements from thoracic radiographs to identify high mean left atrium pressure in dogs with myxomatous mitral valve disease
Uso de medidas obtidas de radiografias torácicas em cães para identificar aumento da pressão média do átrio esquerdo na doença mixomatosa da valva mitral
Use of measurements from thoracic radiographs to identify high mean left atrium pressure in dogs with myxomatous mitral valve disease
Semina: Ciências Agrárias, vol. 40, no. 1, pp. 191-202, 2019
Universidade Estadual de Londrina

This work is licensed under Creative Commons Attribution-NonCommercial 4.0 International.
Received: 01 March 2018
Accepted: 14 May 2018
Abstract: The aim of this study was to estimate echocardiographic elevated mean left atrium pressure (MLAP) based on measurements from thoracic radiographs and to determine a cut-off value for each radiographic measurement that suggests a high MLAP. A retrospective cross-sectional study was performed to include cases admitted from January 2015 to December 2016. Thoracic radiographic examinations from 93 dogs with and without a high MLAP were included. Specific measurements were made from thoracic radiographs and compared with echocardiographic variables known to indicate high MLAP. This comparison was used to generate equations that allowed the estimation of echocardiographic surrogates from the radiographic measurements. The values indicative of high MLAP were obtained using a regression curve. Formulas that indicated high MLAP were generated using a number of radiographic measurements. Positive echocardiographic findings of high MLAP were used as the gold standard. These formulas helped to predict high MLAP in myxomatous mitral valve disease (MMVD) without the need for echocardiographic examination. The best formula was left atrium (LA):aorta (Ao)echo = 0.03×(vertebral heart score,VHS) + 0.14×(LA) + 0.27×(LA:caudal vena cava (CVC)rad). Values ≥ 12.2v for VHS, ≥ 4.5cm for LA, ≥ 3.3 for LA:Aorad and ≥ 3.2 for LA:CVCrad suggested high MLAP. Thus, we propose equations, based on measurements from thoracic radiographs, to identify high MLAP. Simple radiographic thoracic measurements, such as LA:CVCrad, can be used to define overload and a high MLAP in dogs with MMVD.
Keywords: LA:Ao, Left atrium enlargement, Pulmonary venous enlargement, Thoracic radiography, VHS.
Resumo: O objetivo desse estudo foi estimar o aumento da pressão média do átrio esquerdo (PMAE) na ecocardiografia usando equações baseadas em medidas obtidas das radiografias torácicas e determinar um valor de corte para cada uma dessas variáveis radiográficas. Foi realizado um estudo retrospectivo, observacional e transversal de casos atendidos de janeiro de 2015 a dezembro de 2016. Foram selecionados 93 exames radiográficos do tórax de cães, com ou sem aumento da PMAE. As medidas especificas foram feitas de radiografias torácicas e comparadas com variáveis ecocardiográficas que podem indicar um aumento da PMAE. Foi gerado equações que estimam medidas ecocardiográficas a partir das variáveis radiográficas. Os valores que indicam aumento da PMAE foram obtidos por meio das curvas de regressão. Foram usadas como “padrão ouro” as medidas ecocardiográficas que indicam aumento da PMAE. As fórmulas ajudam a predizer o aumento da PMAE em cães com doença mixomatosa da valva mitral (DMVM) sem a necessidade do exame ecocardiográfico. A melhor fórmula obtida foi: Átrio Esquerdo (AE):Aorta (Ao)eco=0.03×(VHS)+0.14×(AE)+0.27×(AE:Veia Cava Caudal (VCC)rad). Os valores ≥ 12.2 para VHS, ≥ 4.5cm para AE; ≥ 3.3 para AE:Aorad e ≥ 3.2 para AE:VCCrad sugerem um aumento da PMAE. Essas equações, a partir de medidas radiográficas torácicas, auxilia na identificação do aumento da PMAE. Algumas medidas radiográficas simples, como a AE:VCCrad pode ser usada para definir sobrecarga e aumento da PMAE em cães com DMVM.
Palavras-chave: AE:Ao, Aumento do átrio esquerdo, Dilatação da veia pulmonar, Radiografia torácica, VHS.
Introduction
Myxomatous mitral valve disease (MMVD) is the most common heart disease in dogs (WARE, 2014). MMVD is diagnosed on the basis of clinical signs, and echocardiographic and thoracic radiographic examination, but the sensitivity and accuracy of each parameter varies (ABBOTT, 2008; MATTIN et al., 2015). Despite some limitations, thoracic radiography is considered the best screening test to identify signs of left congestive heart failure (CHF), through the demonstration of venous congestion and cardiogenic pulmonary edema (ABBOTT, 2008).
Echocardiographic examination is considered the gold standard for the diagnosis of MMVD and allows for the structural and functional evaluation of the heart, early detection of disease and classification of the stage of heart failure according to the American College of Veterinary Internal Medicine (ACVIM) Specialty of Cardiology consensus panel (ATKINS et al., 2009; OYAMA et al., 2004; SCHOBER et al., 2010). Undoubtedly, echocardiography is the most accessible diagnostic method for the detection of a high mean left atrial pressure (MLAP). The echocardiographic parameters that allow the sonographic diagnosis of high MLAP are: left atrium to aorta ratio (LA:Aoecho), wave E, the E:isovolumetric relaxation time (IVRT) ratio and the wave E:E' ratio (KIM; PARK, 2015; OYAMA et al., 2004; SCHOBER et al., 2010). However, treatment in dogs with MMVD should be commenced once they have reached stage B2 and have LA:Aoecho>1.6, a vertebral heart score (VHS) >10.9 and a normalized left ventricular internal diameter in diastole (LVIDDN) >1.7 (BOSWOOD et al., 2016).
Despite the advantages of echocardiography, it is a subjective technique, and the accuracy of the examination is highly correlated to the experience of the examiner (ABBOTT, 2008). Additionally, data analysis can be time-consuming and, in emergencies, such as pulmonary edema, this can be a limiting factor. In dyspneic patients, a thoracic radiographic examination can again be a useful screening technique. Radiographic examination is faster to perform and simpler for non-specialists to interpret (BAHR, 2013).
The measurement of the size of the cardiac silhouette on radiographic examination is also subjective. Findings indicating CHF include pulmonary edema and pleural effusion, as well as signs of venous congestion (BAHR, 2013). Pulmonary venous congestion can be identified by radiographic examination when there is an increase in the diameter of the cranial pulmonary veins compared to the corresponding pulmonary artery in the left radiographic projection, or by comparison of the caudal pulmonary vein with the diameter of the ninth rib on the right side on the dorsoventral projection (THRALL; LOSONSKY, 1976).
A less subjective way of assessing the size of the cardiac silhouette by radiographic examination is the vertebral heart score (BUCHANAN; BÜCHELER, 1995). VHS values between 9.7 and 10.7 were initially considered normal in dogs; however, later studies identified different values in certain breeds, where normal VHS can be up to 10.5v for Cavalier King Charles Spaniels and German Spitz, up to 10.2v for Beagles, up to 10.6v for Greyhounds, up to 10.7v for Pugs, up to 12.1v for Bulldogs, up to 11.0v for Whippets and up to 11.4v for Boston Terriers (BAVEGEMS et al., 2005; HANSSON et al., 2005; JEPSEN-GRANT et al., 2013; KRAETSCHMER et al., 2008; MARIN et al., 2007) . This measurement technique is relatively poor at detecting specific individual cardiac chamber enlargements, where measurement may be within normal limits, even in patients with enlarged cardiac silhouettes (BUCHANAN; BÜCHELER, 1995).
Based on the difficulties in the analysis and use of the VHS, some researchers have proposed a specific method of measuring the left atrium by radiographic examination, to be applied in patients with MMVD (SANCHEZ et al., 2013). This method combines the use of the VHS with the measurement of the left atrium with reference to the intersection point of the VHS. First, a measurement is made from the point of intersection of the short and long heart axis to the caudal edge of the short axis (SA-VHS), then, starting from the same point, a measurement is made up to the dorsal edge of the long axis (LA-VHS), and these two measurements are summed. In addition, a line is drawn from the midpoint of the intersection of the long and short axis of the VHS to the dorsal border of the left atrium (SANCHEZ et al., 2013). Using this method, it is possible to detect focal cardiac enlargement, especially in the left atrium, which often occurs in MMVD. The study authors also proposed other measurements, however, the study included only a few cases (SANCHEZ et al., 2013). The VHS and measurements of the left atrium are unable to identify high MLAP in patients with MMVD.
In this study, we hypothesized that a new method for radiographic measurement of the left atrium, specifically for use in patients with MMVD, could produce an equation for the diagnosis of high MLAP, without the need for echocardiographic examination. We aimed to correlate measurements from thoracic radiographs with echocardiographic measurements to grade the severity of disease and detect cases with a high MLAP. Therefore, the aims of this study were four-fold: 1) to propose an equation based on measurements from thoracic radiographs to estimate the presence of high MLAP, as detected by echocardiography; 2) to confirm the effectiveness of the measurements in the radiographic examination in patients with MMVD; 3) to compare the measurements from the radiographic examination with the measurements from the echocardiographic examination; and 4) to determine a limit for each radiographic measurement that suggests high MLAP.
Materials and Methods
A retrospective, observational, cross-sectional study was conducted using data from dogs admitted to a veterinary teaching hospital, in which thoracic radiographs and echocardiographic examinations had been performed between January 2015 and December 2016.
Inclusion criteria were: patients had echocardiographic and radiographic examinations, dogs were less than 15kg or were a small breed, and dogs did not receive pimobendan before the examinations.
Exclusion criteria were: no echocardiographic measurements of the LA:Aoecho, mitral E wave, IRVT or E:IRVT ratio, cases with significant additional radiographic findings, such as severe pulmonary edema and pleural effusion, or insufficient radiographic quality to allow measurements.
Echocardiographic examinations
Reports of the echocardiographic exams were obtained from the database of the Laboratory of Comparative Cardiology. All examinations were performed with either a Mylab 30 Gold Vet (ESAOTE, Italy), with 1-4 MHz and 5-10 MHz sector transducers, or a Philips Affiniti 50 (PHILIPS, USA), with 2-4MHz and 3-8MHz transducers, selected according to the size of the patient. Echocardiographic examinations were performed according to published guidelines (BOON, 2011).
Radiographic evaluations
Thoracic radiographs were obtained from the database of the Diagnostic Imaging Laboratory in DICOM format. The initial examinations were performed on a Medicor Budapest X-ray device (Neo-Diagnomax) with a power of 500 mA; later an AGFA model CR-30X (AGFA HealthCare NV, Belgium) was used.
Evaluations were made by a trained radiologist using Radiant DICOM Viewer 3.4.2®. The following measurements were made from the thoracic radiographs: VHS, LA size, vertebral left atrium score (VLAS), aorta artery width (Ao), caudal vena cava (CVC) and the size of the fourth thoracic vertebra (4TV) (Figure 1).
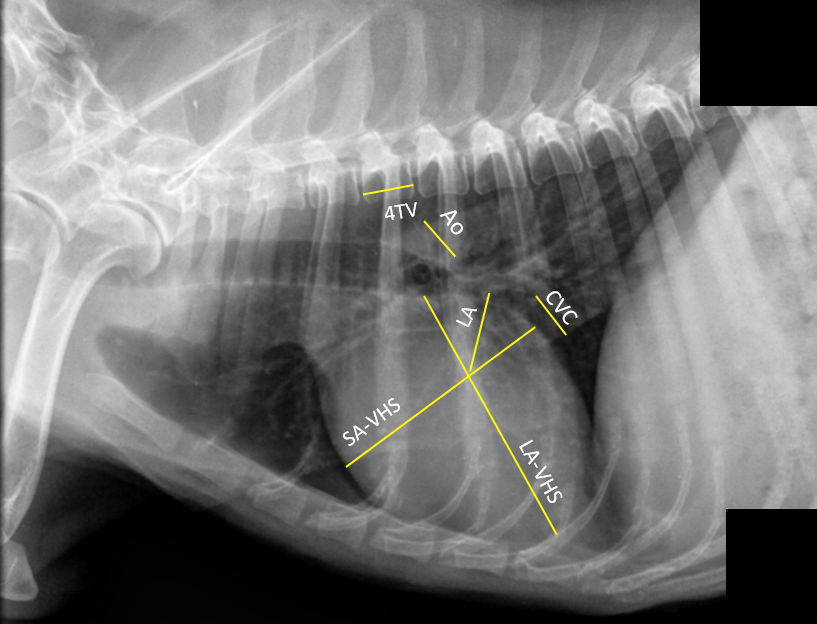
Figure 1
Right lateral thoracic radiograph showing the measurements obtained for the study
SA-VHS (short axis of the vertebral heart score), LA-VHS (long axis of the vertebral heart score), LA (left atrium), Ao (aorta), CVC (caudal vena cava), 4TV (fourth thoracic vertebra).
VHS was measured according to Buchanan and Bücheler (1995), with the changes proposed by Hansson et al. (2005) to standardize the obtained values. The long axis of VHS (LA-VHS) was measured as the distance from the ventral part of the carina to the apex of the heart. The value for the short axis of VHS (SA-VHS) was obtained using the caudal border of the heart at the midpoint of the entry of the caudal vena cava as a reference. Then, a line was drawn from the previously described point (cardiac edge versus caudal vena cava) to the cranial cardiac border, perpendicular to the LA-VHS line (HANSSON et al., 2005). The VHS was calculated according to Buchanan and Bücheler (1995), with only the SA-VHS measurement being made according to Hansson et al. (2005).
The LA size was obtained by measuring the length of a new line drawn at 45 degrees from the intersection of the LA-VHS and SA-VHS and the most dorsocaudal portion of the cardiac border. This value was compared to the length of the thoracic vertebral bodies, with the measurement starting from the fourth thoracic vertebra. This measurement was labeled the vertebral left atrial score (VLAS) (BUCHANAN; BÜCHELER, 1995).
The radiographic silhouette of the dorsal and ventral border of each vessel was used to obtain the width of the aorta and the CVC. The measurement of the aorta was made caudal to the carina, and dorsocaudal to the base of the heart. The CVC was measured where the vessel overlapped with the caudal border of the heart (Figure 1). The length of the fourth thoracic vertebra was measured between the cranial and caudal articular joint edges of the vertebra in its body portion. All measurements were made in both right and left lateral projections (Figure 1).
The relationships between the left atrium and the aorta (LA:Aorad), the left atrium and the CVC (LA:CVCrad) and the left atrium and the fourth thoracic vertebra (LA:4TVrad) were later calculated and tabulated in a Microsoft Office Excel worksheet 2016 for Windows (Redmond, WA, USA). The information from each patient, as well as the echocardiographic measurements obtained from the echocardiographic reports, were entered in the same Excel table for later analysis.
Statistical analysis
Statistical analysis was performed to establish a reliable parameter from the radiographic examination to detect signs of congestion in patients with heart disease. Initially, all echocardiographic and radiographic measurements were submitted to a Bayesian analysis. The response variables (Yi) followed a normal distribution; that is, Yi ~ Normal (μi, σi2), i = 1, 2, ..., nj for the jth treatments. For each μi and σi2, non-informative distributions were considered, respectively, mi ~ Normal (0,10-6) and ti ~ Gamma (10-3,10-3) (σ2 = t-1, OpenBugs parameterization). Multiple comparisons were made between the posteriori distributions of the average. At the 5% level of significance, the treatments whose 95% confidence intervals (ICr) for the mean differences were considered different if they did not include a value of zero. The means and confidence intervals for all the parameters were calculated using the BRugs package of the program R (R DEVELOPMENT CORE TEAM, 2011).
A total of 220,000 values were generated in a MCMC (Markov chain Monte Carlo) process, with a sampling period of 20,000 initial values. In the collection of values, a skip of 20 cycles was used for each sample, so the final sample included 10,000 values. Convergence of the chains was verified through the CODA package of R, according to Heidelberger and Welch (1983) and Geweke (1992).
Pearson's correlation coefficients were used to verify the degree of correlation between radiographic and echocardiographic measurements that were directly related to congestion. For this, comparisons of each echocardiographic index with each radiographic value were made to establish the degree of the relationship between them. Pearson's correlation coefficients were also used to verify intra- and inter-observer correlation of the radiographic measurements performed in the study (Table 1). To analyze this relationship, the following indices were used for this analysis: a r value from -1.0 to -0.7: strong negative correlation; from -0.7 to -0.3: negative correlation; from -0.3 to +0.3: small correlation or no association; from +0.3 to +0.7: weak positive correlation; from +0.7 to +1.0: strong positive correlation.
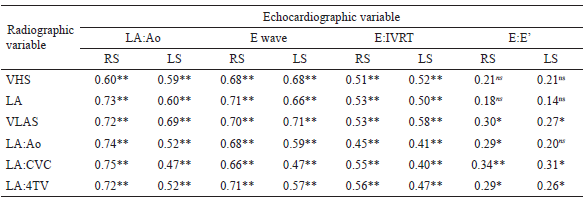
ns: not significant p≥0.05.* Significant at p≤0.05.** Significant at p≤0.01. RS: right side; LS: left side; VHS: vertebral heart score; VLAS: vertebral left atrial score; LA: left atrium; LA:Ao: left atrium to aorta ratio; LA:CVC: left atrium to caudal vena cava ratio; LA:4TV: left atrium to 4th thoracic vertebra; E:IVRT: E wave to isovolumetric relation time ratio; E:E’: E wave to E’ wave ratio.
The data were analyzed statistically to identify variables with a significant influence on a high MLAP, using the "stepwise" methodology of SAS statistical software; this allows for the elimination of variables that do not have a significant influence on the variable in question. An equation was derived to predict the LA:Aoecho, mitral E wave, E:IRVT and E:E' in an echocardiograph based on the variables that had a significant influence on these parameters.
The regression curves were constructed using the echocardiographic measure of a high MLAP as an independent variable and the radiographic variables as dependent variables. Only the radiographic measurements of the right side (RS) were used in the formulas presented in Table 2. For the LA:Aoecho ratio in the echocardiograph, the regression curves were built with the VHS, LA, LA:Aorad and LA:CVCrad radiographic measurements.
All statistical analyses were selected and performed by two authors (F.S.J; A.L.S.). The data were collected and analyzed using Microsoft Office Excel (Microsoft Office 2016 for Windows, Redmond, WA, USA), R for Windows - Version 3.1.1 Ri386 (R DEVELOPMENT CORE TEAM, 2011) and SAS - Version 9.4 (SAS, 2016).
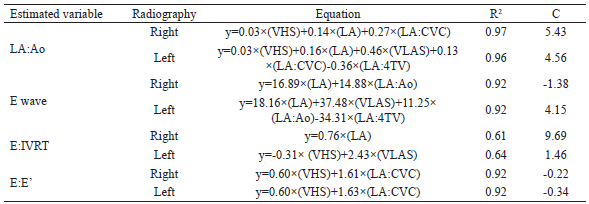
VHS: vertebral heart score; VLAS: vertebral left atrial score; LA: left atrium; LA:Ao: left atrium to aorta ratio; LA:CVC: left atrium to caudal vena cava ratio; LA:4TV: left atrium to fourth thoracic vertebra ratio; E:IVRT: E wave to isovolumetric relation time ratio; E:E’: E wave to E’ wave ratio.
Results and Discussion
The study included 158 thoracic radiographic examinations. Sixty-six radiographs were excluded as they were unsuitable for cardiac measurements due to poor quality and the presence of pleural effusion or a significant pulmonary edema. Of the remaining 93 cases, 60 were females and 33 males. There was no statistically significant difference between females and males in any of the measured echocardiographic and radiographic variables. The median dog weight was 9.3kg, with minimum and maximum values of 2.0 and 18.8kg. The median age of the dogs was 11.0 years, ranging from 1.5 to 18.0 years; in only one case, the owner did not know the correct age of the patient. Many patients were mixed breed dogs (26 dogs), but the other patients were: 16 Beagles, 10 Pinschers, seven Cocker Spaniels, seven Dachshunds, seven Poodles, seven Schnauzers, six Lhasa Apsos, two Malteses, two Whippets, and one case each of a Brazilian Terrier, a Fox Terrier and a Yorkshire Terrier.
Upon investigation of the Pearson correlation coefficients, we observed that the variables obtained in the right radiographic projection were slightly higher than those obtained from the left. Table 1 presents the Pearson correlation coefficients of the radiographic and echocardiographic measurements. The correlations between the echocardiographic variable LA:Aoecho and the radiographic variables of the right side LA, VLAS, LA:Aorad, LA:CVCrad and LA:4TVrad and of the echocardiographic variable E wave with the right side LA, VLAS and LA:4TVrad and the left side (LS) VLAS were strong and positive. Except for the correlation of the E:E' echocardiographic variable with the VHS-right and left radiographic variables; LA - right and left, VLAS - left, LA:Aorad - right and left and LA:4TVrad - right and left, which were considered null associations or had small correlations, all other correlations were considered weak and positive associations.
To date, a few studies have compared the measurement of echocardiographic variables with single radiographic measurements (HERNANDEZ-LOPEZ et al., 2012; SANCHEZ et al., 2013), but single radiographic measurements have always been found to be an inferior method of diagnosis of a high MLAP. The Pearson correlation coefficient shows that the LA:Aorad ratio had an r of 0.74 with the LA:Aoecho ratio, whereas the equation generated in this study that estimated LA:Aoecho using the variables VHS, LA and LA:CVCrad (Table 2) had an R2 of 0.97, indicating that it is better than a single measurement for estimating high MLAP from a radiographic examination.
In the literature, the LA:Aoecho ratio from echocardiograms and the left atrium bisection line (LABL) are weakly correlated, contrasting with the strong correlation observed in this study (HERNANDEZ-LOPEZ et al., 2012). In another study, the r value for the Pearson correlation was similar to that found in our study (0.79 and 0.74) (SANCHEZ et al., 2013). There are no correlation studies using other echocardiographic measures of high MLAP. However, we obtained formulas that can estimate the echocardiographic E wave, E:IVRT and E:E’ variables based on radiographic measurements. This will assist in clinical decision-making with respect to the use of medications to decrease these measurements and, consequently, the congestion. The most commonly used variable to assess high MLAP on echocardiography is LA:Aoecho, however, if measurement of this ratio proves inconclusive, other echocardiographic measurements can be made to confirm a diagnosis.
The stepwise methodology used to acquire the formulas included the radiographic parameters that best correlated with echocardiographic high MLAP and discarded the least important parameters. In this process, the best parameters are selected in the first step, and consequently have a greater impact on the respective variable. The best variable for estimation of high MLAP by radiographic examination, based on the echocardiographic parameter LA:Aoecho, was LA:CVCrad. The estimation using LA:CVCrad multiplied by 0.52938 gave an R2 of 0.96. The radiographic measurements that best predicted echocardiographic measurements of high MLAP were LA for E wave and E:IVRT (multiplied by 28.32 and 0.76, giving an R2 of 0.91 and 0.61, respectively) and VHS for E:E' (multiplied by 0.98, giving an R2 of 0.91).
In left lateral radiographs, VLAS alone was able to predict the LA:Aoecho ratio, E wave and the E:IVRT ratio (when multiplied by 0.59, 38.90 and 1.04, respectively) with R2 values of 0.95, 0.91 and 0.60, respectively. For the estimation of the E:E' ratio, VHS was used and multiplied by 1.007, leading to an R2 of 0.91.
The formulas that best predicted echocardiographic high MLAP variables by the stepwise method are shown in Table 2, where it can be seen that more than one radiographic measurement was used to produce the formulas. The formulas derived from values from the right lateral projection were slightly superior when compared to the left side values. The coefficient of determination (R2) was the lowest for the E:IVRT ratio, among all predictors of high MLAP. The equation that estimated the LA:Aoecho ratio based on echocardiography using the radiographic measurements from the right lateral projection had the highest R2.
The formulas obtained using the radiographic measurements from right lateral projections were more accurate than those obtained from the left side, as shown in Table 2. The variables that best estimated a high MLAP based on radiographic examination were LA:CVCrad for LA:Aoecho, LA for E wave and E:IVRT and VHS for E:E'. Although it is possible to use a single radiographic variable to estimate the echocardiographic measurements that indicate a high MLAP, errors are reduced by cross-checking with multiple variables.
Diagnostic cut-off values for the radiographic variables can be derived by drawing a line on their regression curves, corresponding to the cut-off values for each echocardiographic variable, and recording where they cross. For example, if a patient with high MLAP disease has a minimum LA:Aoecho value of 1.6, the cut-off values, corresponding to where the regression line crosses this number, for the radiographic variables VHS, LA and LA:CVCrad are approximately 12.2v, 4.2cm and 3.2, respectively (Figure 2).
Cut-off values that suggest a high MLAP were also recorded for other echocardiographic variables, i.e. 130cm/s for the E wave, an E:IVRT ratio of 2.5 and an E:E' ratio of 9.0. For these variables, values that indicated high MLAP based on radiographic measurements were: for E wave, 4.5cm for the LA and a LA:Aorad ratio of 3.3; for the E:IVRT ratio, an LA of 3.5cm, and for the E:E' ratio, a VHS limit of 8.8v and a LA:CVCrad ratio of 1.6 (Figure 2).
In the literature, the cited maximum values of VHS in normal dogs are 10.5v, although there are some breed variations outside this range (BAVEGEMS et al., 2005; BUCHANAN; BÜCHELER, 1995; HANSSON et al., 2005; JEPSEN-GRANT et al., 2013; KRAETSCHMER et al., 2008; MARIN et al., 2007) . According to our results, if a patient with MMVD has a VHS above 12.2v, high MLAP is present, as well as cardiomegaly. It is interesting to note that VHS values may vary in relation to the breed of the dogs, however, as MMVD occurs more commonly in small dogs, a cut value of 12.2v is a useful tool in the specific analysis of these patients, mainly in the detection of cardiac volume overload.
In studies evaluating the VHS, measurements obtained from the right lateral projection of the thorax were found to be better at detecting cardiac enlargement than those performed on the left lateral projection (GRECO et al., 2008). We also found the VHS to be larger on the right lateral thoracic projection, however, unlike in other studies, when we correlated this with echocardiographic measures of high MLAP, right lateral projection measures had higher Pearson correlation coefficients than left measures. This superiority was observed not only in the VHS, but in all measurements performed on the right side compared to the left side. The left lateral projection is generally considered better for evaluation of the cranial pulmonary vessels (BAHR, 2013). In general, this supports the view of other authors (BAHR, 2013) that at least three radiographic projections should be performed.
This study proposes a new approach for radiographic assessment of high MLAP without the need for echocardiography. Using the echocardiographic cut-off values for the definition of left heart volume overload, we verified that it is possible to identify a patient in overload via radiographic examination using a mathematical formula. Formulas are shown in Table 2; higher R2 values, when compared to the simple correlations presented in Table 1, indicate that the formulas are more accurate for the detection of volume overload.
An intra- and inter-observer repeatability analysis was performed with 15 randomly selected cases, and the data was evaluated using Pearson's correlation coefficients. In the intra-observer analysis, strong correlations were: LA-VHS RS (0.99), SA-VHS RS (0.99), LA RS (0.90), CVC RS (0.80), 4TV RS (0.93), VHS LS (0.98), LA LS (0.94), Ao LS (0.81), CVC LS (0.96), 4TV LS (0.91), VHS LS (0.98) and VLAS LS (0.90). In the inter-observer analysis, the correlations of the following measures were considered strong: LA-VHS RS (0.96), SA-VHS RS (0.99), LA RS (0.77), CVC RS (0.89), 4 TV RS (0.94), LA-VHS LS (0.97), LA LS (0.81), Ao LS (0.71), CVC LS (0.91), 4 TV LS (0.95) and VHS LS (0.94).
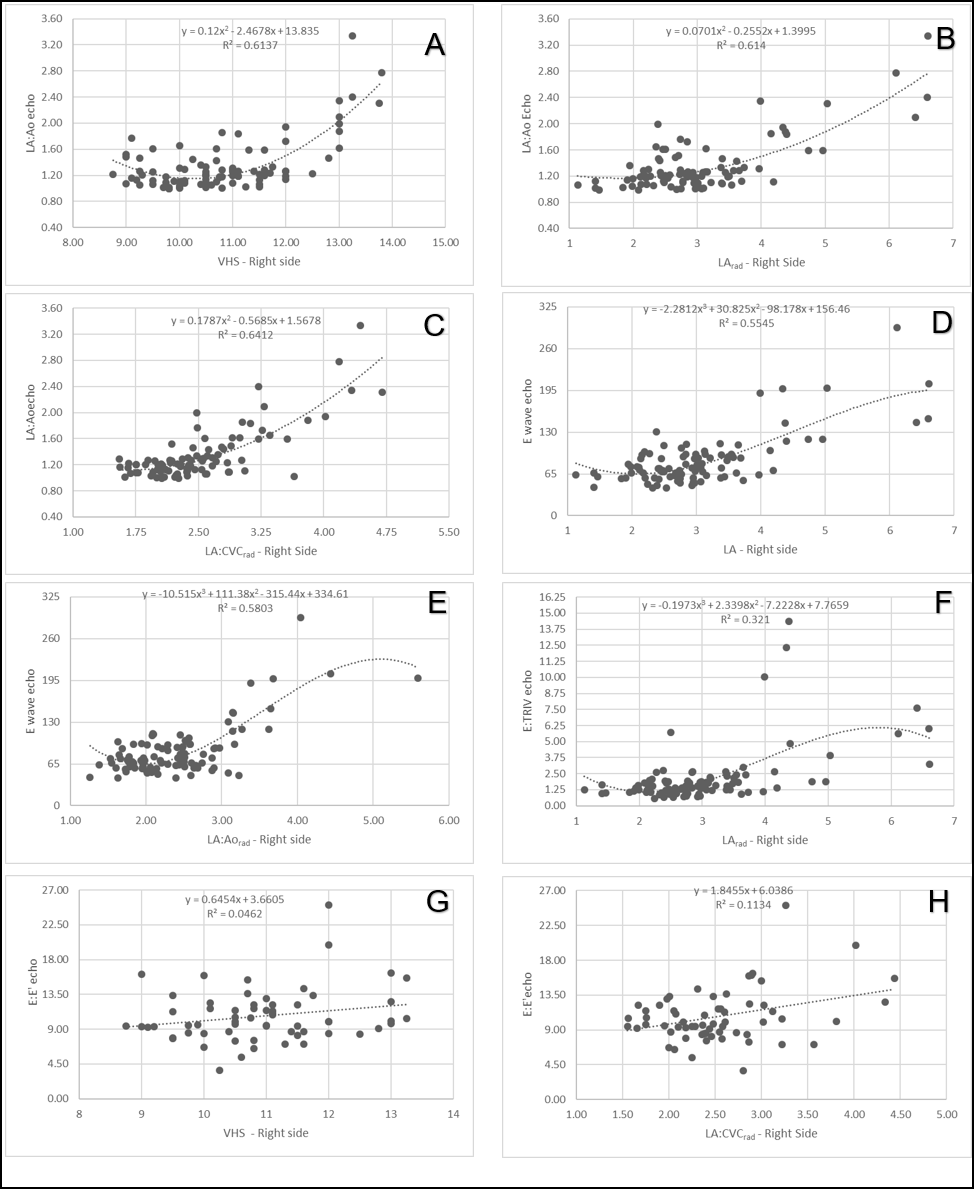
Figure 2
Regression graphs demonstrating the radiographic measurements that were used in the estimation equation of the LA:Aoecho ratio, E wave, the E:IVRT ratio and the E:E' ratio in echocardiography.
(A) Polynomial regression line of order 2 demonstrating the positive correlation of LA:Aoecho with VHS. (B) Polynomial regression line of order 2 demonstrating the positive correlation of LA:Aoecho with LA size. (C) Polynomial regression line of order 2 demonstrating the positive correlation of LA:Aoecho with the LA:CVCrad ratio from radiography. (D) Polynomial regression line of order 3 demonstrating the positive correlation of the E wave with LA size on the radiograph. (E) Polynomial regression line of order 3 of the E wave for the LA:Aorad ratio. (F) Polynomial regression line of order 3 of the E:IVRT ratio with LA size. (G) Regression line from the E:E’ ratio to VHS. (H) Regression line from the E:E’ ratio to LA:CVCrad.
The inter- and intra-observer repeatability analysis demonstrated, through high Pearson's correlation coefficients, that these measures are highly reproducible. However, this study has a number of limitations. All measurements were performed by a single observer and the results require further validation of inter- and intra-observer repeatability. Only patients with suspected MMVD were selected for the radiographic measurements, so the formulas should only be applied to dogs with high MLAP and with this clinical profile. Because this was a retrospective study, it was not possible to establish which dogs were or were not treated with diuretics or vasodilators at the time of the thoracic radiography and echocardiographic examinations.
In summary, early signs of high MLAP in patients with heart disease can be detected in thoracic radiographs using the formulas produced in this study (Table 2). The use of these formulas provides a higher coefficient of determination than using individual radiographic measurements, and it is possible to use the cut-off values to identify signs of high MLAP and remodeling. The minimum values for each radiographic measurement that are indicative of high MLAP are: 12.2v for VHS, 4.5cm for LA, 3.3 for LA:Aorad and 3.2 for LA:CVCrad. This data will help clinicians diagnose high MLAP from radiographic examinations alone; this is of particular importance when an echocardiographic examination is not available or when the patient is not sufficiently stable to tolerate detailed and prolonged echocardiography.
We propose a number of equations using measurements taken from thoracic radiographs that can predict high MLAP in dogs with MMVD. In the future, these equations could be used in some form of computer or smartphone app. These measurements and correlations (e,g. LA:CVCrad) can help to define high MLAP in patients with MMVD. High MLAP can be diagnosed from right lateral thoracic radiographs if any of the measured parameters are increased, namely: VHS ≥12.2v; LA ≥4.5cm; LA:Aorad ≥3.3 and LA:CVCrad ≥3.2.
References
ABBOTT, J. A. Acquired Valvular Disease. In: TILLEY, L. P.; SMITH, F. W. K.; OYAMA, M. A.; SLEEPER, M. M. (Ed.). Manual of canine and feline cardiology. St. Louis: Elsevier, 2008. p. 110-138.
ATKINS, C.; BONAGURA, J.; ETTINGER, S.; FOX, P.; GORDON, S.; HAGGSTROM, J.; HAMLIN, R.; KEENE, B.; LUIS-FUENTES, V.; STEPIEN, R. Guidelines for the diagnosis and treatment of canine chronic valvular heart disease. Journal of Veterinary Internal Medicine, Greenwood Village, v. 23, n. 6, p. 1142-1150, 2009.
BAHR, R. The heart and pulmonary vessels. In: THRALL, D. E. (Ed.). Textbook of veterinary diagnostic radiology. 6th ed. St. Louis: Elsevier, 2013. p. 585-607.
BAVEGEMS, V.; VAN CAELENBERG, A.; DUCHATEAU, L.; SYS, S. U.; VAN BREE, H.; DE RICK, A. Vertebral heart size ranges specific for whippets. Veterinary Radiology and Ultrasound, Harrisburg, v. 46, n. 5, p. 400-403, 2005.
BOON, J. A. Veterinary echocardiography. West Sussex: Wiley-Blackwell, 2011. 767 p.
BOSWOOD, A.; HAGGSTROM, J.; GORDON, S. G.; WESS, G.; STEPIEN, R. L.; OYAMA, M. A.; KEENE, B. W.; BONAGURA, J.; MACDONALD, K. A.; PATTESON, M.; SMITH, S.; FOX, P. R.; SANDERSON, K.; WOOLLEY, R.; SZATMÁRI, V.; MENAUT, P.; CHURCH, W. M.; O'SULLIVAN, M. L.; JAUDON, J. P.; KRESKEN, J. G.; RUSH, J.; BARRETT, K. A.; ROSENTHAL, S. L.; SAUNDERS, A. B.; LJUNGVALL, I.; DEINERT, M.; BOMASSI, E.; ESTRADA, A. H.; FERNANDEZ DEL PALACIO, M. J.; MOISE, N. S.; ABBOTT, J. A.; FUJII, Y.; SPIER, A.; LUETHY, M. W.; SANTILLI, R. A.; UECHI, M.; TIDHOLM, A.; WATSON, P. Effect of pimobendan in dogs with preclinical myxomatous mitral valve disease and cardiomegaly: the EPIC study? A randomized clinical trial. Journal of Veterinary Internal Medicine, Greenwood Village, v. 30, n. 6, p. 1765-1779, 2016.
BUCHANAN, J. W.; BÜCHELER, J. Vertebral scale system to measure heart size in radiographs. Journal of the American Veterinary Medical Association, Schaumburg, v. 206, n. 2, p. 194-199, 1995.
GEWEKE, J. Evaluating the accuracy of sampling-based approaches to the calculation of posterior moments. Bayesian Statistics, Oxford, v. 4, p. 169-193, 1992.
GRECO, A.; MEOMARTINO, L.; RAIANO, V.; FATONE, G.; BRUNETTI, A. Effect of left vs. right recumbency on the vertebral heart score in normal dogs. Veterinary Radiology & Ultrasound, Harrisburg, v. 49, n. 5, p. 454-455, 2008.
HANSSON, K.; HÄGGSTRÖM, J.; KVART, C.; LORD, P. Interobserver variability of vertebral heart size measurements in dogs with normal and enlarged hearts. Veterinary Radiology and Ultrasound, Harrisburg, v. 46, n. 2, p. 122-130, 2005.
HEIDELBERGER, P.; WELCH, P. D. Simulation run length control in the presence of an initial transient. Operations Research, Catonsville, v. 31, n. 6, p. 1109-1144, 1983.
HERNANDEZ-LOPEZ, J.; MACHEN, M. C.; OYAMA, M. A. Radiographic vertebral heart size and left atrial bisecting line: interobserver variability and comparison to echocardiographic left atrial size in dogs with degenerative mitral valve disease. Journal of Veterinary Internal Medicine, Greenwood Village, v. 26, p. 690-822, 2012.
JEPSEN-GRANT, K.; POLLARD, R. E. E.; JOHNSON, L. R. R. Vertebral heart scores in eight dog breeds. Veterinary Radiology and Ultrasound, Harrisburg, v. 54, n. 1, p. 3-8, 2013.
KIM, J. H.; PARK, H. M. Usefulness of conventional and tissue doppler echocardiography to predict congestive heart failure in dogs with myxomatous mitral valve disease. Journal of Veterinary Internal Medicine, Greenwood Village, v. 29, n. 1, p. 132-140, 2015.
KRAETSCHMER, S.; LUDWIG, K.; MENESES, F.; NOLTE, I.; SIMON, D. Vertebral heart scale in the beagle dog. Journal of Small Animal Practice, Gloucester, v. 49, n. 5, p. 240-243, 2008.
MARIN, L. M.; BROWN, J.; MCBRIEN, C.; BAUMWART, R.; SAMII, V. F.; COUTO, C. G. Vertebral heart size in retired racing greyhounds. Veterinary Radiology & Ultrasound, Harrisburg, v. 48, n. 4, p. 332-334, 2007.
MATTIN, M. J.; BOSWOOD, A.; CHURCH, D. B.; LÓPEZ-ALVAREZ, J.; MCGREEVY, P. D.; O'NEILL, D. G.; THOMSON, P. C.; BRODBELT, D. C. Prevalence of and risk factors for degenerative mitral valve disease in dogs attending primary-care veterinary practices in england. Journal of Veterinary Internal Medicine, Greenwood Village, v. 29, n. 3, p. 847-854, 2015.
OYAMA, M. A.; SISSON, D. D.; BULMER, B. J.; CONSTABLE, P. D. Echocardiographic estimation of mean left atrial pressure in a canine model of acute mitral valve insufficiency. Journal of Veterinary Internal Medicine, Greenwood Village, v. 18, n. 5, p. 667-672, 2004.
R DEVELOPMENT CORE TEAM. R: a language and environment for statistical computing. Vienna: The R Foundation for Statistical Computing, 2011.
SANCHEZ, X.; PRANDI, D.; GARCIA-GUASCH, L.; BADIELLA, L. L.; HERNANDEZ-LOPEZ, J.; MANUBENS, J.; DOMENECH, O.; OYAMA, M. A. New radiographic measurements of left atrial size in dogs with degenerative mitral valve disease: preliminary study. Journal of Veterinary Internal Medicine, Greenwood Village, v. 27, n. 3, p. 604-756, 2013.
SCHOBER, K. E.; HART, T. M.; STERN, J. A.; LI, X.; SAMII, V. F.; ZEKAS, L. J.; SCANSEN, B. A.; BONAGURA, J. D. Detection of congestive heart failure in dogs by doppler echocardiography. Journal of Veterinary Internal Medicine, Greenwood Village, v. 24, n. 6, p. 1358-1368, 2010.
STATISTICAL ANALYSIS SYSTEM INSTITUTE - SAS. The SAS System. Release 9.3. Cary: SAS Institute Inc., 2016.
THRALL, D. E.; LOSONSKY, J. M. A method for evaluating canine pulmonary circulation dynamics from survey radiographs. Journal of the American Animal Hospital Association, Lakewood, v. 12, p. 457-462, 1976.
WARE, W. A. Aquired valvular and endocardial disease. In: NELSON, R.; COUTO, G. C. (Ed.). Small animal internal medicine. 4th ed. St. Louis: Elsevier, 2014. p. 115-129.
Author notes
fsjojima@gmail.com
Additional information
Conflict of interest: The
authors report that the main author has a patent USO DE FÓRMULAS OBTIDAS A PARTIR DE MEDIDAS
RADIOGRÁFICAS DO TÓRAX PARA IDENTIFICAR A CONGESTÃO VENOSA E PRE-EDEMA EM CÃES
COM DOENÇA MIXOMATOSA DA VALVA MITRAL pending to the Universidade Federal do
Paraná, with the process number BR 10 2017 023893
8.