ARTICLES
Field-saturated hydraulic conductivity measured by two techniques and at different sampling positions relative to maize-crop rows and interrows
Condutividade hidráulica do solo saturado medida por duas metodologias em posições de amostragem relativa às linhas e entrelinhas da cultura do milho
Field-saturated hydraulic conductivity measured by two techniques and at different sampling positions relative to maize-crop rows and interrows
Semina: Ciências Agrárias, vol. 39, no. 1, pp. 403-409, 2018
Universidade Estadual de Londrina
Received: 28 June 2017
Accepted: 07 November 2017
Abstract: Field-saturated hydraulic conductivity (Ks) reflects porous system ability to transfer water in the soil-plant system. The study aimed to measure Ks through two distinct techniques. One of them was carried out in the laboratory by applying the constant-head cylinder method (CHC) in undisturbed samples, herein referred to as a standard technique. The other consisted of a simplified falling-head technique to measure Ks in situ (SFH), as proposed by Bagarello et al. (2004). We also verified the correlations of the obtained Ks values with other soil physical properties. SFH method is simpler, faster and does not require sophisticated equipment, which can be executed directly in the field. The experiment was conducted in the city of Floresta (PR), Brazil, at Cocamar Technology Diffusion Unit. It consisted of four treatments: maize-crop interrow without recent machine traffic (MI), maize-crop interrow traveled by a harvester (MIT), maize-crop row (MR) and its relative position to brachiaria crop row sown in consortium, and in maize-crop interrow (BR). In each treatment, 10 sampling points were defined (repetitions), where Ks was determined by SFH and an undisturbed sample was taken to measure Ks in the laboratory. Ks values measured by methodological approaches were compared through the following statistical indices, with their respective results: Willmott’s concordance index (0.944), maximum error (1.269) and mean absolute error (0.291), square root of normalized mean error (0.45), determination coefficient (0.88), residual mass coefficient (0.07), efficiency coefficient (0.72), performance index (0.80), and Pearson’s correlation (0.85). A high agreement was found between the studied techniques, with measured values close to each other. Notably, we must give emphasis on SFH since it had a variation coefficient 1.4 times lower than the standard technique.
Key words: Field technique, Porous system, Comparison.
Resumo: A condutividade hidráulica do solo saturado (Ks) reflete a habilidade do sistema poroso em transferir água no sistema solo-planta. O objetivo deste trabalho foi medir a Ks por meio de duas metodologias, sendo uma realizada em laboratório com aplicação de carga constante em amostras indeformadas, denominada aqui de metodologia padrão, e outra, proposta por Bagarello et al. (2004), consistindo de uma técnica de carga decrescente simplificada que mede a Ks in situ (SFH), bem como verificar suas correlações com outros atributos físicos do solo A metodologia SFH é mais simples, rápida e não necessita de equipamentos sofisticados, podendo ser executada diretamente em campo. O experimento foi conduzido em Floresta-PR, na unidade de difusão de tecnologia da Cocamar, constando de 4 tratamentos, sendo: entrelinha da cultura do milho sem tráfego recente de máquinas (MI); entrelinha da cultura do milho trafegada por colhedora (MIT); linha da cultura do milho (MR) e posição relativa à linha da cultura da braquiária semeada em consórcio e na entrelinha da cultura do milho (BR). Em cada tratamento foram definidos 10 pontos de amostragem (repetições), onde foi feita a determinação da Ks pela SFH e a tomada de uma amostra indeformada que foi utilizada para medir a Ks em laboratório. Os valores de Ks medidos pelas abordagens metodológicas foram comparados por meio dos seguintes índices estatísticos, com seus respectivos resultados: índice de concordância de Willmott (0.944), do erro máximo (1,269) e erro absoluto médio (0,291), da raiz quadrada do erro médio normalizado (0,45), do coeficiente de determinação (0,88), do coeficiente de massa residual (0,07), do coeficiente de eficiência (0,72), do índice de desempenho (0,80) e da correlação de Pearson (0,85). Pôde-se concluir que existe elevada concordância entre as metodologias estudadas, com valores medidos próximos entre si, com destaque para a metodologia SFH, a qual apresentou coeficiente de variação 1,4 vezes menor que a metodologia padrão utilizada para determinação de Ks.
Palavras-chave: Metodologia de campo, Sistema poroso, Comparação.
Field-saturated hydraulic conductivity is one of the most important soil properties, as it influences several physical and hydrological processes. This measures soil ability in conducting water (AMOOZEGAR; WARRICK, 1986), controlling overland flow, erosion, pesticide leaching, and pollutants along its profile (REYNOLDS et al., 2000). According to Horn and Kutilek (2009), Ks is a strength parameter comprising the dynamic aspects of a porous system over time and space, also encompassing the functionality of processes of agricultural and environmental interest (HORN; KUTILEK, 2009; REICHERT et al., 2016). This measure is dependent on properties related to soil porosity, such as bulk, size, morphology, continuity, and pores orientation, being more dependent on structure compared to soil texture (GONÇALVES; LIBARDI, 2013), and considered an indicator of soil physical quality (REICHERT et al., 2009; AGNESE et al., 2011).
Traditional methods for measuring field-saturated hydraulic conductivity in the laboratory directly apply Darcy’s equation, as well as constant-head permeameter (CHC) and falling-head permeameter, both of which are described by Reynolds and Elrick (2002). These techniques use undisturbed soil samples confined in a metal cylinder. Field measurements of hydraulic conductivity should be prioritized than those made in the laboratory since it minimizes sample bulk perturbation, and tend to keep conductivity and matrix pores connectivity best preserved (BOUMA, 1982). Techniques for hydraulic conductivity measurement in the field are described by Amoozegar and Warrick (1986), Reynolds and Elrick (2002), and Bagarello et al. (2004).
Among in situ used techniques, the one proposed by Bagarello et al. (2004), also known as simplified falling-head (SFH), has stood out and been extensively used. Agnese et al. (2011) obtained a good correlation of saturated hydraulic conductivity with soil structure and organic matter content. Recently, Keller et al. (2012) measured Ks by SFH and reached satisfactory correlations between this soil property and maize-crop yield. Given Ks importance as an indicator of soil quality, as well as the convenience of its determination directly in the field - as proposed by Bagarello et al. (2004), our hypothesis is that SFH technique can be used to determine the Ks of very loamy soils. Therefore, the objective of this study was to measure Ks in a Red Latosol of very loamy texture, through two techniques: constant-head method in laboratory conditions (standard), and by simplified falling-head in field conditions (in situ). The paper also proposes to make correlations between this property and other parameters such as soil bulk density (Bd), total porosity (Pt), microporosity (MiP), macroporosity (MaP), and volumetric humidity at field capacity (θfc).
The study was carried out at Cocamar Technologies Diffusion Unit, in Floresta city northern Paraná State, in the south of Brazil (23°35’23.654” S, 52°04’27.124” W). It was performed during the crop season of 2015/2016. According to Köppen’s classification, the local climate prevailing is a Cfa type, which stands for humid subtropical mesothermic. The region presents annual rainfall and temperature averages of 1450 mm and 22 °C, respectively. The soil was identified as a dystroferric Red Latosol (Oxisol). Soil granulometric analysis indicated values of 785 g kg-1 for clay, 140 g kg-1 for sand, and 75 g kg-1 for silt, within a 0-10 cm layer, thus being classified as a very loamy textural class.
The area is under no-tillage for more than 10 years. The cropping sequence involved soybeans (Glycine max) annually in the spring-summer period, and wheat (Triticum spp.), oats (Avena spp.), and maize (Zea mays) in alternate years, with or without brachiaria consortium (Urochloa ruzizienses) in the fall-winter period. For this essay, four 30-m-long transects were selected, in the same direction as maize-crop rows, cultivated with 0.90-m row spacing, with a population of 60,000 plants per hectare. In this area, brachiaria was grown in maize-crop interrows alternately, composing the following treatments: maize-crop interrow without recent machine traffic (MI), maize-crop interrow travelled by harvester (MIT), maize-crop row (MR) and its relative position to brachiaria crop row sown in consortium, and in maize-crop row (BR). Maize crop was sown through a shaft-disc system, in which a chisel plow is used to open furrow for fertilizer deposition to a depth of 0.1 m. Yet, for brachiaria, sowing was employed by grooving with discs to a depth of 0.02 m
Along each transection, ten sampling points were demarcated spaced 3 m apart to perform field-saturated hydraulic conductivity measurements, adopting a simplified falling-head method, as proposed by Bagarello et al. (2004). This technique consists of a PVC cylinder, with a diameter of 0.14 m and 0.25 m in height, inserted in soil at a depth of 0.08 m. After the cylinder insertion into the ground, a volume of 3.30 x 10⁻⁴ m3 of water was poured inside it, quantifying the time needed for all this water content infiltrates throughout this amount of soil. Conductivity calculation was held according to Equation 1.
Wherein: Δθ: difference between water content in the field and after saturation in laboratory (m3 m-3); tα: time required for water content infiltration (seconds); D: ratio between poured water volume and PVC cylinder area (L); α *: macroscopic capillary length parameter, proposed by Reynolds and Elrick (2002) (m-1), being used 12 m-1 value.
Next to each PVC cylinder, an undisturbed sample was taken at 0.0-0.05-m depth, using stainless-steel cylinders with 0.07 m in diameter and 0.05 m in height. In the laboratory, samples were adjusted to the cylinder dimensions, weighted, and saturated by capillarity in a tray, with water up to 2/3 of the sample height. Field-saturated hydraulic conductivity was also determined in undisturbed samples by constant-head method (CHC), as described by Reynolds and Elrick (2002). This method consists of letting the water flow through the undisturbed soil sample, at a constant hydraulic speed and pressure. With this, we quantified the elapsed time and water volume passing through the sample; then, Ks calculation was accomplished according to Equation 2:
Wherein: V (cm3) is the water volume collected over a period of time, Δt (seconds), L (cm) is the stainless steel cylinder height containing the undisturbed soil sample, ΔH is the water column height in the auxiliary cylinder over the ram with the undisturbed sample, and dc is the cylinder diameter with the undisturbed sample. For comparison purposes, CHC was taken as a standard technique.
Ks data normality was evaluated by Shapiro-Wilk’s test. When not significant, the data were transformed by a logarithmic function to meet the normal distribution assumption. Ks measures of all sampling positions were compared for each technique, using a confidence interval of 5% (p <0.05) (PAYTON et al., 2000). Means were deemed significantly different when there no overlapping between upper and lower confidence interval limits was observed. Yet the techniques were compared using Pearson’s correlation (R), by R version 3.3.1 software (R Foundation for Statistical Computing). Herewith, we also calculated Willmott’s concordance index - d, maximum error - Emax, mean absolute error - Eamed, normalized mean square error - NMSE; determination coefficient - R2; residual mass coefficient - RMC; and efficiency coefficient - E according to Zacharias et al. (1996), as well as performance index - C, as proposed by Camargo and Sentelhas (1997):
Wherein: Pi corresponds to obtained data by the standard technique (CHC); Oi are obtained data by the technique being compared (SFH); N is observations number; ; and R is Pearson’s correlation coefficient.
Sampling positions affected BD differently, BR and MR presented the lowest mean values, 1.04 and 1.05 g cm-3, respectively, not differing from each other and differing from (p <0.05) MIT and MI, which did not differ mutually. Mean values of total porosity disclosed similar results to those of BD, also being affected by sampling positions, higher values were observed in BR and MR, not differing between each other and differing and surpassing MIT and MI, which did not feature significant difference together. Ks mean values obtained in the two techniques treatments are reported in Table 1. Field-saturated hydraulic conductivity measured by CHC technique showed a significant difference (p <0.05) between treatments, with higher values in BR and MR, differing and surpassing the values observed in MI and MIT, which did not differ from each other, in accordance to mean values accomplished from BD and Pt. These results corroborate Dexter et al. (2004), which suggests plants with more bulky root systems, such as brachiaria, contribute to a higher soil hydraulic conductivity. Ks log correlation (P <0.01) was verified by CHC technique with coefficients of 0.54 with Pt, -0.56 with BD, -0.61 with microporosity, 0.65 with macroporosity, and - 0.65 with θfc, being considered high correlations according to Hopkins (2000). In SFH technique, Ks values submitted differences among each other (p <0.05), with larger and equal values in MR and MR, differing and surpassing MI, which differs and surpasses MIT, also in accordance with BD and Pt values, which may be due to greater preservation of pores’ continuity created by crops’ root system, as point out Reichert et al. (2016), and Dexter et al. (2001). Regarding Ks log correlations, by SFH technique, a coefficient correlation value (p <0.01) of 0.57 with Pt was observed, -0.50 with microporosity, 0.60 with macroporosity, -0.57 with θfc, being considered high correlations and an R-value = -0.46 with BD, which fits in moderate correlation degree. The two techniques presented different variation coefficients between treatments (Table 1), being the highest values obtained with Ks of CHC technique, which exhibited CV of about 1.40 times higher than in SFH. However, Ks maximum and minimum values were very close between the two techniques.
| Method | Mean and Confidence Interval(CI) per treatment | Descriptive Statistics | ||||||||
|---|---|---|---|---|---|---|---|---|---|---|
| MIT | MI | MR | BR | Maximum | Minimum | Mean | Standard deviation | CV | ||
| CHC | 5.25 10-04 | 6.13 10-03 | 1.74 10-02 | 3.24 10-02 | 9.36 1002 | 2.19 10-05 | 1.41 10-02 | 2.15 10-02 | 151.93 | |
| CI CHC | 6.86 10-04 | 5.08 10-03 | 1.48 10-02 | 1.67 10-02 | ||||||
| SFH | 1.20 10-04 | 2.43 10-03 | 5.27 10-02 | 3.52 10-02 | 8.33 10-02 | 3.21 10-05 | 2.26 10-02 | 2.48 10-02 | 109.95 | |
| CI SFH | 8.32 10-05 | 1.46 10-03 | 1.24 10-02 | 7.41 10-03 | ||||||
Statistical indices were employed to compare SFH and CHC techniques. A perfect accordance between the two techniques would result in d = R2 = E = C = R = 1, and Emax = EAmed = NMSE = RMC = 0. Pearson’s correlation coefficient disclosed 0.85 value, indicating a very high correlation, according to Hopkins (2000), and corroborates with values found by Bagarello et al. (2004). Figure 1 graphically exposes the relationship between the measured values by the two techniques. Points’ distribution was observed to be around row 1: 1. D index reported close value to the unit (0.944), indicating accordance between the two techniques, i.e. Ks values measured by SFH and CHC are very close to each other. R2 index = 0.866 designated similar behavior between the techniques regarding Ks data dispersion around their respective means, which was confirmed by the high E value (>0.70), as suggested by Zacharias et al. (1996). Regarding error magnitude, EAmed featured 0.291 value and a higher Emax (1.269) was noticed in association with greater data dispersion of the standard technique; however, these values are considered acceptable since it is a high variability property according to Warrick and Nielsen classification (1980). NMSE and RMC indexes set forth values close to zero, 0.45 and -0.079 respectively. A negative value of RMC index demonstrates that SFH technique produced Ks values higher than those measured with the standard technique, a fact confirmed by data distribution around 1: 1 row, exhibited in Figure 1. Figure 1 reveals that 60% of the measured values are above and near 1: 1 row, certifying that data dispersion was small, reflecting a high R2 value. Finally, performance index displayed 0.80 value, which according to Camargo and Sentelhas classification (1997) fits SFH technique with a “Very good” output compared to the standard method.
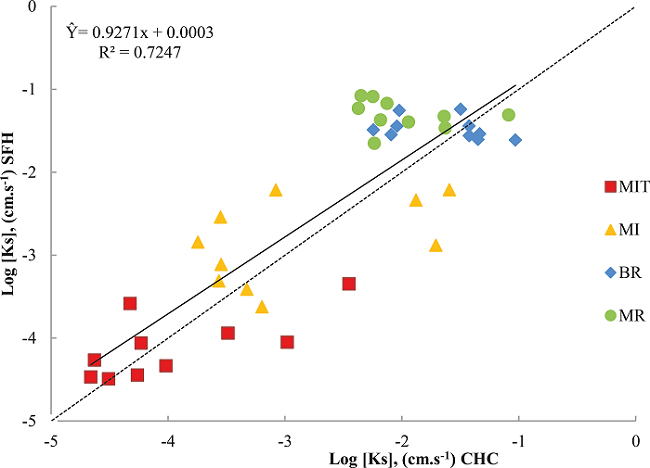
Figure 1
Variation between the techniques (CHC and SFH) for Ks determination. The dashed line corresponds to 1: 1 ratio.
A falling-head technique (SFH) can be applied to determine Ks in an expeditious manner and directly in the field, without prejudice to quality data.
Both evaluated techniques allow us to conclude that rotations with the adoption of grasses with a bulky root system, such as brachiaria, contribute to a higher water infiltration into the soil.
References
AGNESE, C.; BAGARELLO, V.; BAIAMONTE, G.; IOVINO, M. Comparing physical quality of forest and pasture soils in a Sicilian watershed. Soil Science Society of America Journal, Madison, v. 75, n. 5, p. 1958-1970, 2011.
AMOOZEGAR, A.; WARRICK, A. W. Hydraulic conductivity of saturated soils: field methods. Methods of Soil Analysis, Madison, v. 1, n. 1, p. 735-770, 1986.
BAGARELLO, V.; IOVINO, M.; ELRICK, D. A. Simplified falling-head technique for rapid determination of field-saturated hydraulic conductivity. Soil Science Society of America Journal, Madison, v. 68, n. 1, p. 66-73, 2004.
BOUMA, J. Measuring the hydraulic conductivity of soil horizons with continuous macropores. Soil Science Society of America Journal, Madison, v. 46, n. 2, p. 438-441, 1982.
CAMARGO, A. D.; SENTELHAS, P. C. Avaliação do desempenho de diferentes métodos de estimativa da evapotranspiração potencial no Estado de São Paulo, Brasil. Revista Brasileira de Agrometeorologia, Santa Maria, v. 5, n. 1, p. 89-97, 1997.
DEXTER, A.; CZYŻ, E.; GAŢE, O. Soil structure and the saturated hydraulic conductivity of subsoils. Soil and Tillage Research, Amsterdam, v. 79, n. 2, p. 185-189, 2004.
DEXTER.; CZYŻ, E.; MACKOWIAK, C. Water retention and hydraulic conductivity of a loamy sand soil are influenced by crop rotation and fertilization. Archives of Agronomy and Soil Science, Malaysia, v. 46, n. 1-2, p. 123-133, 2001.
GONÇALVES, A. D. M. A.; LIBARDI, P. L. An analysis of soil hydraulic conductivity determination by means of the instantaneous profile method. Revista Brasileira de Ciência do Solo, Viçosa, v. 37, n. 5, p. 1174-1184, 2013.
HOPKINS, W. G. A new view of statistics. Internet Society for Sports Science. Melbourne, Sportscience, 2000. Available at: <http://www.sportsci.org/resource/stats/>. Accessed at: 04 jan. 2017.
HORN, R.; KUTILEK, M. The intensity-capacity concept-How far is it possible to predict intensity values with capacity parameters. Soil and Tillage Research, Amsterdam, v. 103, n. 1, p. 1-3, 2009.
KELLER, T.; SUTTER, J. A.; NISSEN, K.; RYDBERG, T. Using field measurement of saturated soil hydraulic conductivity to detect low-yielding zones in three Swedish fields. Soil and Tillage Research, Amsterdam, v. 124, n. 1, p. 68-77, 2012.
PAYTON, M. E.; MILLER, A. E.; RAUN, W. R. Testing statistical hypotheses using standard error bars and confidence intervals. Communications in Soil Science and Plant Analysis, v. 31, n. 5-6, p. 547-552, 2000.
REICHERT, J. M.; ROSA, da. V. T.; VOGELMANN, E. S.; ROSA, da. D. P.; HORN, R.; REINERT, D. J.; SATTLER, A.; DENARDIN, J. E. Conceptual framework for capacity and intensity physical soil properties affected by short and long-term (14 years) continuous no-tillage and controlled traffic. Soil and Tillage Research, Amsterdam, v. 158, n. 1, p. 123-136, 2016.
REICHERT, J. M.; SUZUKI, L. E. A. S.; REINERT, D. J.; HORN, R.; HÄKANSSON, I. Reference bulk density and critical degree-of-compactness for no-till crop production in subtropical highly weathered soils. Soil and Tillage Research, Amsterdam, v. 102, n. 2, p. 242-254, 2009.
REYNOLDS, W.; ELRICK, D. Methods of soil analysis. In: ______. Physical methods. Part 4. Madison: Soil Science Society of America Book, 2002. p. 797-801. (Series, n. 5).
REYNOLDS, W. D.; BOWMAN, B. T.; BRUNKE, R. R.; DRURY, C. F.; TAN, C. S. Comparison of tension infiltrometer, pressure infiltrometer, and soil core estimates of saturated hydraulic conductivity. Soil Science Society of America Journal, Madison, v. 64, n. 2, p. 478-484, 2000.
WARRICK, A. W.; NIELSEN, D. R. Spatial variability of soil physical properties in the field. ln: HILLEL, D. Applications of soil physics. New York: Academic Press, 1980. p. 319-344.
ZACHARIAS, S.; HEATWOLE, C. D.; COAKLEY, C. W. Robust quantitative techniques for validating pesticide transport models. Transactions of the ASAE, St. Joseph, v. 39, n. 1, p. 47-54, 1996.
Author notes
*Auhtor for correspondence