ARTICLES
Anatomical distribution and population dynamics of Rhipicephalus (Boophilus) microplus in cattle in the municipality of Óleo, São Paulo
Distribuição anatômica e dinâmica populacional de Rhipicephalus (Boophilus) microplus em bovinos do município de Óleo, São Paulo
Anatomical distribution and population dynamics of Rhipicephalus (Boophilus) microplus in cattle in the municipality of Óleo, São Paulo
Semina: Ciências Agrárias, vol. 39, no. 3, pp. 1077-1089, 2018
Universidade Estadual de Londrina
Received: 12 July 2017
Accepted: 09 March 2018
Abstract: Rhipicephalus (Boophilus) microplus infestation is responsible for significant economic losses in cattle industry. The use of acaricides at strategic times and selection of resistant animals can minimize economic losses. This study aimed to determine the anatomical distribution and population dynamics of R. microplus in the municipality of Óleo, state of São Paulo. This study was conducted using eight male cattle, crossbred zebu-taurine (in accordance with the regional herd). Female R. (B.) microplus, greater than 4 mm, present in the right side of the animals were counted between April 2012 and March 2013. The highest tick number per animal was noted in October (128.25), and the lowest in April (35.5), with three infestation peaks during the study, in May, October, and December, which were influenced by the minimum and maximum mean temperature and rainfall. Among the cranio-caudal regions (anterior, median, and posterior), the posterior had the highest mean tick number, and the anterior had the lowest. The minimum temperature, rainfall, and solar radiation interfered with infestation of dorsoventral regions: in cold months, the lowest infestations were found in the mixed area (ear and tail); in the warm months, in the high region (head, neck, upper ribs, flank, and rump). The lower region (dewlap, cranial limb, lower ribs, abdomen, prepuce, scrotum, and lower limb) always had the highest mean tick number. The tick numbers of the caudal limb and crotch showed strong correlation with the total tick number (+0.88 and +0.70, respectively). These data, grouped according to median, posterior, and crotch regions, showed a stronger correlation with the total tick number (+0.96, +0.90, and +0.70, respectively).
Key words: Anatomical distribution, Population dynamics, State of São Paulo, Rhipicephalus (Boophilus) microplus, Ticks.
Resumo: A infestação pelo Rhipicephalus (Boophilus) microplus é responsável por significativas perdas econômicas na pecuária bovina. O uso de acaricidas de forma estratégica e a seleção de animais mais resistentes podem minimizar os prejuízos econômicos. O objetivo deste estudo foi determinar a distribuição anatômica e a dinâmica populacional do carrapato em bovinos do município de Óleo, SP. O estudo foi conduzido com 08 bovinos machos, mestiços zebu-taurino (conforme rebanho regional). Foram contadas as fêmeas de R. (B.) microplus, maiores que 4 mm, existentes no lado direito do animal, a cada 4 semanas, no período entre abril de 2012 e março de 2013. Obteve-se o maior número de carrapatos por animal em outubro (128,25), e o menor em abril (35,5), com a existência de três picos de infestação, sendo eles nos meses de maio, outubro e dezembro. Verificou-se a existência de três gerações anuais de carrapatos, que foram influenciadas pela precipitação pluviométrica e temperatura média, mínima e máxima. Das regiões Crânio-caudal (anterior, mediana e posterior), a posterior obteve o maior número médio de carrapatos e a anterior o menor. A temperatura mínima, a pluviosidade e a radiação solar interferiram nas infestações das regiões Dorso-ventral, nos meses frios, as menores infestações foram encontradas na área mista (orelha e cauda) e nos meses quentes na alta (cabeça, pescoço, costado alto, flanco e garupa). A região baixa (barbela, membro cranial, costado baixo, ventre, prepúcio, membro caudal e bolsa escrotal) se manteve sempre com a maior média. Das diferentes regiões anatômicas estabelecidas, o número de carrapatos do membro caudal e entrepernas mostraram ter forte correlação com o total, +0,88 e +0,70, respectivamente. Esses mesmos dados, agrupados segundo regiões previamente estabelecidas, obtiveram correlação mais forte com o total de carrapatos, sendo +0,96 (mediana), +0,90 (posterior) e +0,70 (entrepernas).
Palavras-chave: Carrapatos, Dinâmica populacional, Distribuição anatômica, Estado de São Paulo, Rhipicephalus (Boophilus) microplus.
Introduction
Rhipicephalus (Boophilus) microplus, commonly known as the southern cattle tick or carrapato de boi in Brazil (FORTES, 2004), is responsible for significant economic losses worldwide. In his article “Ticks. The billion dollar parasitosis,” Horn (1983) presented a survey conducted in 1983 to quantify the losses due to reduction in milk production, mortality, fall in birth rate, use of acaricides, investments in showers and sprinklers, weight loss, labor, leather quality, disease, and education in Brazil. He indicated that 95.6% of Brazilian municipalities had tick infestation, with high infestation in 80% of the municipalities. In 2013, the losses due to R. (B.) microplus were estimated at US$ 3,940 million by Grisi et al. (2013).
The control of ticks is mainly based on the application of acaricides, which is conducted without proper knowledge of the behavior and biological aspects of the species. This causes an early resistance to the active principles used. Alternative methods such as phytotherapy and biological control with the use of fungi, have been used, but without remarkable success (PEREIRA, 2008).
The appropriate use of the acaricides might extend their useful life, i.e., through strategic control. In this process, the products are applied at appropriate times, preventing an increase in the number of ticks in the environment (PEREIRA, 2008). This environmental control is important, as 95% of ticks present in an area are in the free-living phase (FURLONG; MARTINS, 2000).
Thus, this study aimed to determine the anatomic distribution and population dynamics of R. (B.) microplus in the cattle of the municipality of Óleo, SP.
Material and Methods
Study site
The study was conducted between April 2012 and March 2013, in Chácara Óleo (Óleo Farm), located in the municipality of Óleo, State of São Paulo (Geographic coordinates: 22°56ʹ40.5ʺS 49°20ʹ37.4ʺW), with an altitude tropical climate and located at 625.86 m above sea level (IBGE, 2010).
Climatic data
The four seasons of the year-autumn, winter, spring, and summer-were taken into account. The maximum, mean, and minimum temperatures were obtained from the station of the Centro Integrado de Informações Agrometeorológicas (CIIAGRO, Integrated Agrometeorological Information Center) of Santa Cruz do Rio Pardo, Guacho subunit, whereas rainfall data were obtained from the headquarters of the Casa da Agricultura de Óleo (House of Agriculture of Óleo), which are located 15 and 1.65 km, respectively, from the study site. Measurements of solar radiation were obtained from the Instituto Nacional de Pesquisas Espaciais (INPE, National Institute for Space Research) and were obtained in the State capital.
Animals
The 34 cattle monitored in the study were clinically healthy Zebu-taurine crossbred bulls (with variable degree of breed, according to the regional herd), aged between 16 and 20 months.
The cattle were selected randomly by drawing lots. In the first screening, each animal was registered according to a specific form that contained a number marked on their left brisket, containing their age, color, and pictures, as well as an identification code assigned during the study. Before the animals were included in the study, the owner was informed of the procedures and associated risks. In accordance with the procedures and after a signed informed consent form was obtained, the animals were included in the study for observation. The owner had the freedom to withdraw their animals from the study at any time.
Eight animals were selected and placed in 42.35 ha of Brachiaria brizantha under extensive grazing and supplied mineral salt and water ad libitum. During the study period, the animals received injectable levamisole-based anthelmintic, in accordance with the recommendations of the leaflet (Ripercol L®; Fort Dodge Saúde Animal Ltd.). None of the animals was replaced.
Stress was controlled by placing the animals in their normal routine. None of the animals in the herd received acaricides 45 days before the beginning of tick counts, as well as during the study, as recommended by Furlong and Martins (2000).
Counting of Rhipicephalus (Boophilus) microplus ticks
The ticks were counted as recommended by Villares (1941) and as per the modified version of Wharton and Utech (1970). Only adult females of R. (B.) microplus with more than 4 mm in length on one side of the animals were counted. Owing to the greater ease of access to the right torso, counting was performed on this side of the animal, unlike Villares (1941) who conducted the count from the left side. The standardization of counting was improved using a template with a 4 mm cut.
The body of the animal was divided in 15 anatomical regions, which are described in Table 1 and shown in Figure 1. The data obtained were regrouped in two distinct forms in order to evaluate the distribution of ticks throughout the body of an animal.
| Name of the anatomical region | Anatomical position |
| Ear | External and internal ear. |
| Head | Excluding only the components of the ear. |
| Neck | In the horizontal plane, from the atlas to the spine of the scapula; in the vertical plane, from the cervical to the ventral face of the trachea. |
| Dewlap | Flap of skin hanging below the neck. |
| Hump | Prominent region above the dorsal line of the cervical and thoracic spine. |
| Cranial limb | All the extension of the cranial limb, including the lateral and medial sides. |
| Upper ribs | From the spine of the scapula to the last rib, and from the thoracic vertebrae to the imaginary line. |
| Lower ribs | Between the imaginary line from the sternum and between the cranial limb and the last costal arch. |
| Flank | Between the lumbar column and the imaginary line, and between the last costal arch and the iliac bone. |
| Abdomen | Between the last costal arch and the caudal limb and between the imaginary line and the central ventral line. Excludes the navel and the scrotum (in males) or udder (in females). |
| Navel | In males: hanging skin that surrounds the navel and prepuce up to the beginning of the scrotal sac. In females: hanging skin surrounds the navel up to the udder. |
| Rump | Region between the iliac, ischium, and femoral bones. |
| Caudal limb | All the extension of the caudal limb, starting from below the femur line. Includes the lateral and medial sides of the limb. |
| Tail | From the first coccygeal vertebra. Includes the dorsal and ventral sides. |
| Scrotal sac or udder | In males: area of the scrotal sac. In females: udder. |
| Crotch | Area between the caudal limbs to the tibia-fibular-tarsal joint. This region is not included in the sum of the right side of the animal. |
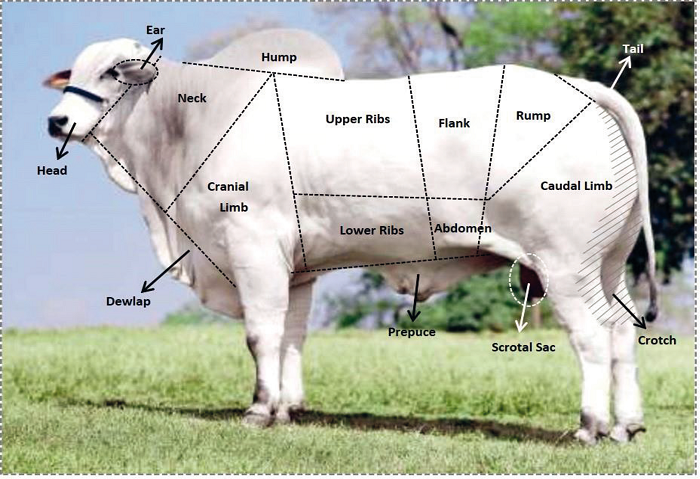
Figure 1
Anatomical regions for counting ticks in cattle.
Source: Image from http://www.jonatasbueno.com/2011/03/em-busca-do-boi.html, adapted by the authors.
Cranio-caudal regions: Anterior (head, ear, neck, dewlap, and cranial limb), Median (upper ribs, lower ribs, flank, abdomen, prepuce, and scrotum), and Posterior (rump, caudal limb, and tail) according to the proposal of Oliveira and Alencar (1990).
Dorsoventral regions: Upper (head, neck, upper ribs, flank, and rump), Mixed (Ear and Tail), and Lower (dewlap, cranial limb, lower ribs, abdomen, prepuce, caudal limb, and scrotum).
The counts as well as the identification of animals were recorded in a standardized form for statistical analysis. None of the investigated animals had humps.
Statistical analysis
As the data for the number of ticks were obtained only from the right side of the animals, the values were multiplied by 2, to express the total number of ticks except for the crotch index, the value for which was already obtained from both sides of the animals.
The values were analyzed using Student’s t-test and ANOVA, both at the 95% significance level, so that the variations during the months and seasons of the year could be assessed. The data were transformed to log10 (2x + 1) for the analysis (FRAGA et al., 2003). However, for better visualization, the numbers in the text are shown without this transformation.
The relationship between climatic variables and tick population on the animals was obtained using Pearson’s correlations, as well as the correspondence of both the methods of counting. The coefficient (ρ) obtained was classified according to Callegari-Jacques (2003) as follows:
-
If 0.00 < │ρ│< 0.30, there is a weak linear correlation
-
If 0.30 ≤ │ρ│< 0.60, there is a moderate linear correlation
-
If 0.60 ≤ │ρ│< 0.90, there is a strong linear correlation
-
If 0.90 ≤ │ρ│< 1, very strong linear correlation exists
-
If │ρ│= 1, perfect linear correlation exists
Results
Climatic data
The mean temperature was 21.45 ± 4.05 °C, with the lowest and highest temperatures recorded in July and December, respectively. The mean minimum and maximum temperatures recorded were 14.8 ± 4.8 and 27.15 ± 4.15 °C, respectively.
A monthly mean rainfall of 113.9 ± 113.3 mm, or 1411.8 mm annually was recorded for the months evaluated, with an accumulation of rainfall from January to March, characterizing summer as a rainy and humid season, whereas the winter months, from July to September, were the driest period. The rain accumulated in these seasons was, respectively, 649.8 mm (46%) and 84.2 mm (6%).
Tick count
Ticks were found in the animals in all months of the year, reaching a monthly mean of 81.88 ± 46.38 ticks per animal. The number of ticks significantly differed between the months of the year (Table 2). The lowest monthly mean was noted in April, with 35.5 ticks per animal; animal E1PL24 was the least infested, with only two ticks. The highest mean tick number (128.25 ticks per animal) was recorded in October; animal E1PL07 had the highest load, with 238 ticks. The monthly mean number of ticks is shown in Figure 2.
| CODE OFANIMALSTUDIED | E1PL01 | E1PL02 | E1PL07 | E1PL10 | E1PL20 | E1PL24 | E1PL30 | E1PL34 | MEAN | |
| April/12 | 8 | 40 | 60 | 28 | 14 | 2 | 68 | 64 | 35.50 | a |
| May/12 | 110 | 112 | 96 | 46 | 22 | 6 | 74 | 102 | 71.00 | abc |
| June/12 | 62 | 72 | 52 | 38 | 72 | 52 | 78 | 58 | 60.50 | bd |
| July/12 | 10 | 34 | 48 | 36 | 38 | 36 | 40 | 44 | 35.75 | a |
| August/12 | 40 | 62 | 58 | 76 | 44 | 28 | 30 | 70 | 51.00 | ade |
| September/12 | 30 | 84 | 158 | 136 | 46 | 40 | 110 | 98 | 87.75 | bef |
| October/12 | 48 | 200 | 194 | 138 | 152 | 90 | 98 | 106 | 128.25 | cf |
| November/12 | 16 | 24 | 40 | 96 | 4 | 30 | 78 | 40 | 41.00 | adh |
| December/12 | 22 | 88 | 238 | 202 | 50 | 46 | 140 | 90 | 109.50 | befg |
| January/13 | 28 | 120 | 174 | 132 | 64 | 24 | 140 | 100 | 97.75 | befg |
| February/13 | 36 | 142 | 110 | 84 | 56 | 14 | 154 | 106 | 87.75 | befgh |
| March/13 | 12 | 40 | 98 | 166 | 70 | 38 | 58 | 70 | 69.00 | abeh |
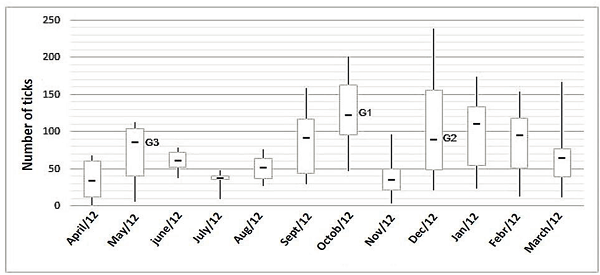
Figure 2
Variation in the number of Rhipicephalus (Boophilus) microplus in untreated cattle in the municipality of Óleo, State of São Paulo, between April 2012 and March 2013.
The mean monthly number of ticks on the animals in relation to the indices of mean, minimum, maximum and temperatures and monthly rainfall did not reveal a strong correlation, with the coefficients of, respectively, +0.59, +0.56, +0.56, and +0.37. However, the climate variables influenced the behavior of the infestation, each variable being more influential at a given time of year (Figure 3).
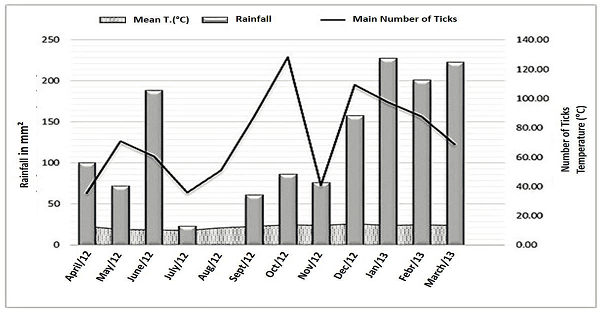
Figure 3
Rainfall, mean monthly temperature, and mean number of Rhipicephalus (Boophilus) microplus per untreated animal in the municipality of Óleo, State of São Paulo, from April 2012 to March 2013.
In this study, the highest mean incidence of ticks occurred in spring during October, November, and December, with a mean of 92.92 ticks/animal, during which the mean temperature was also higher (24.4 °C). In autumn (April, May, and June), the lowest mean temperature (19.6 °C) and a lower rate of infestation (mean, 55.67 ticks per animal) were noted. Nevertheless, the variation in the mean number of ticks across the seasons was not significant, according to Student t-test and ANOVA. When the mean number of ticks was analyzed according to seasons alone, there was a high influence of rainfall in winter, while in the other seasons, there was influence of the temperatures, being the effect of maximum temperature lower in summer and minimal in spring, and the mean temperature in both seasons (Table 3).
| Season | Maximum Temp.(ºC) | Minimum Temp.(ºC) | MeanTemp. (ºC) | Rainfall | Variation in thenumber of ticks |
| Autumn/12 | 27.9 (-0.815) ⃰ | 12.5 (-0.926) ⃰ | 19.6 (-0.869) ⃰⃰ | 359.1 (-0.004) | 57 ± 55 |
| Winter/12 | 29.5 (0.907) ⃰ | 10.0 (0.957) ⃰⃰ | 20.0 (0.929) ⃰ | 84.2 (0.785) ⃰⃰ | 84 ± 74 |
| Spring/12 | 31.3 (0.946) ⃰⃰ | 17.0 (0.246) | 24.4 (0.576) | 318.7 (0.418) | 121 ± 117 |
| Summer/13 | 29.3 (0.55) | 17.6 (0.845)⃰ | 23.6 (0,642)⃰ | 649.8 (0.002) | 93 ± 81 |
Observando-se isoladamente o número médio de carrapatos nas estações do ano, verificou-se alta influência da pluviosidade no inverno, enquanto que nas demais estações foram as temperaturas que interferiram, sendo menor o efeito da temperatura máxima no verão, da mínima na primavera e da média em ambas (Tabela 3).
Number of generations
The monthly means of ticks per animal were used to calculate the number of generations per year and the beginning of these generations. In the city of Óleo, the first generation (G1) occurs in October; the second (G2), in December; and the third (G3), in May, totaling three annual generations (Figure 2).
Anatomical distribution of ticks
Considering the 15 anatomical regions proposed, a significant variation in the number of ticks was noted during the year (p < 0.0001). The regions of caudal limb, crotch, abdomen and prepuce had a higher rate of infestation (22.85, 12.90, 8.94, and 8.25 ticks on average, respectively), whereas the head (0.46), flank (0.46), rump (0.85), and upper ribs (1.33) had the lowest mean number of ticks.
In the cranial-caudal regions, the posterior region had a higher mean (32.42 ticks, 45.9%), whereas the lowest infestation alternated in the median and anterior regions throughout the year, and the anterior region had the lowest annual mean (17.73 ticks, 23.4%; Figure 4).
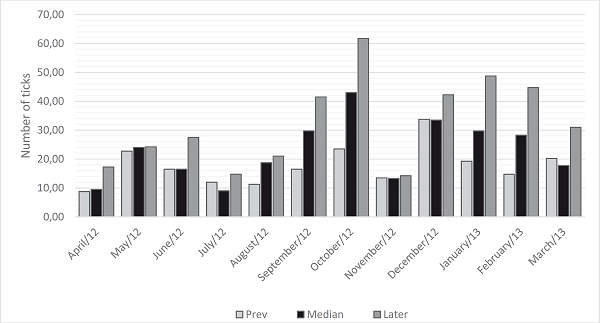
Figure 4
Number of Rhipicephalus (Boophilus) microplus ticks per cranial-caudal region of cattle in the municipality of Óleo, SP, from April 2012 to March 2013.
Cranio-caudal regions: Anterior (head, ears, neck, dewlap, and cranial limb), Median (Upper ribs, lower ribs, flank, abdomen, prepuce, and scrotum) and posterior regions (rump, caudal limb, and tail), according to the proposal of Oliveira and Alencar (1990).
In the dorsoventral regions, the largest number of ticks was found in the low areas (mean, 60.96 ticks, 83.5%), and the lowest annual mean occurred in the mixed areas (Figure 5).
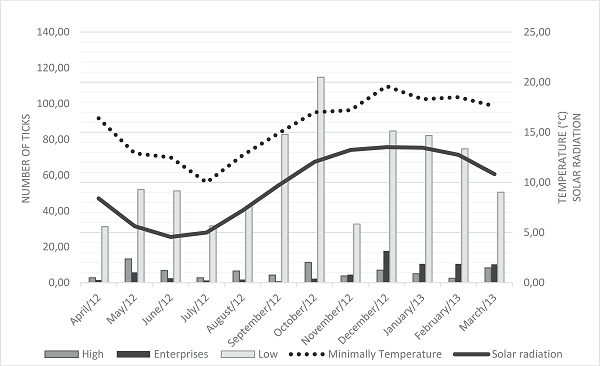
Figure 5
Number of Rhipicephalus (Boophilus) microplus ticks per dorsoventral region of untreated bovine animals, minimum temperature, and solar radiation for the municipality of Óleo, SP, from April 2012 to March 2013.
Dorsoventral Regions: High (head, neck, upper ribs, flank, and rump), Mixed (ear and tail), and Low regions (dewlap, cranial limb, lower ribs, abdomen, prepuce, caudal limb, and scrotum).
Total number of ticks ticks per body region
The highest correlation coefficients between the total number of ticks and the anatomical regions investigated in this study were noted for caudal limbs, crotch, abdomen, cranial limb, and prepuce (+ 0.88, + 0.71, +0.65, +0.64, and +0.63, respectively). The regions of lower ribs (0.59), crotch (0.49), rump (0.48), ear (0.46), tail (0.38), dewlap (0.34), and neck (0.32) had a moderate positive correlation and the upper ribs (0.29), flank (0.23), and head (0.19) had a low positive correlation with the total number of ticks. When these data were distributed in the anatomical regions as proposed by Cardoso, Fries, and Albuquerque (2000), the median, posterior, and crotch (EP) regions showed strong positive correlations (0.96, 0.90, and 0.71, respectively), and the anterior region showed moderate positive correlation.
Discussion and Conclusions
In this study, the tick numbers showed three peaks. The first and lowest occurred in May, the second and highest in October, and an intermediary peak occurred in December. In April, July, and November, the lowest infestation was noted. Santarém and Sartor (2003) conducted a study in Botucatu, SP, 130 km from Óleo, and found infestation peaks from May to October; similarly, Silva et al. (1993) and Pereira (2008) noted the highest values May in the cities of Ponta Grossa, PR (South) and Franca, SP (Southeast), respectively. However, peaks were reported during September and November in Planaltina in the Federal District, in the Central-West region (SAUERESSIG; HONER, 1993); in June, in Rio de Janeiro (SANTOS JÚNIOR et al., 2000); and in June/August, in Colina, SP (LABRUNA; VERÍSSIMO, 2001).
Different results were also noted for the months of lower infestations, which were reported to be from January to November (FARIAS et al., 1995; LABRUNA; VERÍSSIMO, 2001; PEREIRA, 2008; SANTARÉM; SARTOR, 2003; SANTOS JÚNIOR et al., 2000; SAUERESSIG; HONER, 1993; SILVA et al., 1993). The results of this study are in agreement with those of Farias et al. (1995) and Santarém and Sartor (2003), who obtained the lowest counts, respectively, in the months of July/August and November/April. The variation in the occurrence of the lowest and highest infestations reported could be attributed to the different regions with specific microclimatic characteristics and different years, with high variability of climatic data.
Although other authors (FARIAS et al., 1995; LABRUNA; VERÍSSIMO, 2001; SANTOS JÚNIOR et al., 2000; SILVA; ROCHA, 2004; VERÍSSIMO, 1991) found an influence of seasons on the number of ticks per animal, in this study, the variation in infestation along with seasons was not significant.
Farias et al. (1995) conducted in vitro and in vivo studies and revealed that the factors that most influenced larva emergence and free-living phase of R. (B.) microplus were, in descending order, rainfall and minimum and maximum temperatures. The climatic influence was also noted in the studies of Labruna and Veríssimo (2001), Pereira (2008), Santarém and Sartor (2003), Santos Júnior et al. (2000), and Saueressig and Honer (1993). Labruna and Veríssimo (2001) also revealed the occurrence of three peaks, one owing to the increase in rainfall and temperature in early spring, decreasing the cycle; the second caused by conditions favorable to the development of ticks of the first cycle; and the third caused by a climate more suited to the survival of the larvae in the soil and decreased immunity of the animals. The drop in the number of ticks in summer was attributed to the excessive temperature increase.
In the present study, each climate variable was more influential at a certain time of the year. The first tick peak occurred in the month of May; this could be because of the decrease in mean temperatures, creating an environment more conducive to the survival of the larvae in the environment. Between the first and second peaks, which occurred in the month of October, the lowest mean number of ticks and lowest temperatures were recorded, with a minimum of 10 °C. Hitchcock (1955 apud VERÍSSIMO, 1991) suggested that, at temperatures lower than 15 °C, the adult female ticks did not lay eggs, whereas Santarém and Sartor (2003) stated that the eggs oviposited between May and August showed characteristics of infertility. Both factors must have contributed to the reduction of ticks on the animals. The temperature and sudden drop in the volume of rainfall also influenced the prolongation of the cycle during this period, as there was a gap of four months between the first and second peaks.
From September, rainfall and temperature increased, which culminated with the occurrence of the second peak of infestation in October. This second peak was more pronounced than the first one, because of the more suitable temperature for the survival of larvae; therefore, a greater number of ticks were found in the pasture, in addition to the fall in animals’ immunity, caused by low supply and decrease in nutritional value of pasture, as found by Santarém and Sartor (2003).
With increasing temperatures and rainfall, the duration of the cycle of R. microplus decreased, and the third peak occurred in December. However, this rise in temperature indicated that the environment in the pasture was not very favorable for the survival of the larvae, facilitating their desiccation, which should have led to the third peak, which was smaller than the second one. Santarém and Sartor (2003) concluded that, in the Botucatu region, the warm months are not favorable for the survival of larvae. This less favorable climate, coupled with the decrease in the availability of food in the pasture and consequent reduction of shading on the soil, might have caused a progressive reduction in the number of ticks between January and March. However, because this study lasted only for one year, confirming the reproducibility of the data was not possible.
The occurrence of these three peaks allowed the determination of the occurrence of three generation of ticks per year in the municipality of Óleo, in agreement with the reports of Silva et al. (1993) in Ponta Grossa (PR) and of Saueressig and Honer (1993) in Planaltina (DF), and Pereira (2008) in the Southern region, disagreeing only in relation to the period of occurrence. Silva et al. (1993) determined the beginning of the generations in December, February, and May, and Saueressig and Honer (1993), in November, March/April, and May/June. In contrast, Farias et al. (1995) and Pereira (2008), both in the State of São Paulo, verified the occurrence of four generations, in accordance with the findings of the last author, the first generation at the beginning of summer, the second at the end of summer and beginning of autumn, the third between autumn and winter, and the last between winter and spring.
In the analysis of cranial-caudal regions, the posterior region, followed by the medial and anterior regions showed a higher rate of infestation, in agreement with the findings of Oliveira and Alencar (1990) and Cardoso et al. (2000).
Compared with the five anatomical regions with higher and lower mean infestation, respectively, four (caudal limb, abdomen, cranial limb, and crotch) and two (head and tail) of these agree with the findings of the study of the Paiva Neto (2004) who used Nellore, Holstein, and Curraleira breeds. Although the regions used in their study showed slight differences in nomenclature and topography with the regions used in our study, the data reinforce the concept that a higher rate of tick fixation exists in the lower regions and that they have easier contact with pastures and, consequently, with infesting larvae.
Regarding the dorsoventral regions, a higher infestation was noted in the lower regions (60.96%) throughout the study; although the annual mean was lower in the mixed areas, alternation was noted between the least infested site according to the time of year, which was in the cold months, smaller in the mixed region, and lower in the hot months in the high regions. These findings show a strong correlation with the climatic variables: minimum temperature (0.70), rainfall (0.69), and solar radiation (0.60); however, this correlation was positive for the mixed regions and negative for the high regions. “Migration” might be associated with a small decrease in the skin surface temperature of the host when a drop in ambient temperature occurred, causing the ticks to position themselves in the regions of higher solar incidence to compensate for this loss.
The counting of R. microplus females from one side of the animals was a time-consuming and occasionally dangerous task, because one needs to observe and touch places in the body of the animal having difficult access. Accordingly, the number of ticks of each body region was confronted with the total count, in order to determine places of easy access that corresponded to the total body of the animal. However, only regions of the caudal limb and crotch showed a strong positive correlation with the total number of ticks, (0.88 and 0.70, respectively); thus, they can be used as a replacement for the values recommended by Villares (1941) and subsequently amended by Wharton and Utech (1970).
Cardoso et al. (2000) divided the animal’s body in four regions: anterior, medial, posterior, and crotch and obtained different correlations among these for specified regions in this study, (+0.35, +0.82, +0.70, and +0.60, respectively). When the counts obtained in this study were divided according to the regions proposed by those authors, the correlations were stronger: anterior (+0.46), median (+0.96), posterior, (+0.90) and crotch (+0.70).
Although the median region, defined by Cardoso et al. (2000), shows a stronger positive correlation than the crotch, proposed in the two studies, the latter region can be recommended as a replacement for the traditional method, given that its access is easier and safer.
References
CALLEGARI-JACQUES, S. M. Bioestatística: princípios e aplicações. 4. ed. Porto Alegre: Artmed, 2003. 255 p.
CARDOSO, V.; FRIES, L. A.; ALBUQUERQUE, L. G. Comparação de diferentes métodos de avaliação da resistência genética de bezerros F1 Angus x Nelore desmamados ao carrapato Boophilus microplus. In: SIMPÓSIO NACIONAL DE MELHORAMENTO ANIMAL, Belo Horizonte, 2000, Anais... Belo Horizonte: [S.l.], 2000. p. 460-463.
FARIAS, N. A.; STOBBE, N. S.; CHRISTOVÃO, M. L.; PERRI, S. H. V.; COSTA, A. J. Influência das condições climáticas da região noroeste do estado de São Paulo, Brasil, sobre os estágios não-parasitários do carrapato Boophilus microplus (Canestrini, 1887) (Acari:Ixodidae). Revista Brasileira de Parasitologia Veterinária, Jaboticabal, v. 4, 2 p. 67-77, 1995.
FORTES, E. Artropodologia. In: ______. Parasitologia veterinária. 4 ed. São Paulo: Ícone, 2004. 381-547.
FRAGA, A. B.; ALENCAR, M. M.; FIGUEIREDO, L. A.; RAZOOK, A. G.; CYRILLO, J. N. S. G. Análise de fatores genéticos e ambientais que afetam a infestação de fêmeas bovinas da raça Caracu por carrapatos (Boophilus microplus). Revista Brasileira de Zootecnia, Brasília, v. 32, n. 6, p. 1578-1586, 2003. Suplemento 1.
FURLONG, J.; MARTINS, J. R. S. Resistência dos carrapatos aos carrapaticidas. Juiz de Fora: EMBRAPA Gado de Leite, 2000. 25 p. (EMBRAPA Gado de Leite, Circular técnica, 59).
GRISI, L.; MARTINS, J. R. S.; BARROS, A. T. M.; CANÇADO, P. H. S.; VILLELA, H. S. Perdas econômicas potenciais devido ao parasitismo em bovinos no Brasil. Revista de Educação Continuada em Medicina Veterinária e Zootecnia do CRMV-SP, São Paulo, v. 11, 3 p. 71-71, 2013.
HORN, S. C. Prováveis prejuízos causados pelos carrapatos no Brasil. 2 ed. Boletim de Defesa Sanitária Animal. Brasília: Ministério da Agricultura, 1983. 79 p. (Número Especial).
INSTITUTO BRASILEIRO DE GEOGRAFIA E ESTATÍSTICA - IBGE. Cadastro das localidades selecionadas. Rio de Janeiro: IBGE, 2010. Disponível em: <ftp://geoftp.ibge.gov.br/organizacao_ territorial/localidades/>. Acesso em: 20 maio 2014.
LABRUNA, M. B.; VERÍSSIMO, C. J. Observações sobre a infestação por Boophilus microplus (ACARI:IXODIDAE) em bovinos mantidos em rotação de pastagem sob alta densidade animal. Arquivos do Instituto Biológico, São Paulo, v. 68, p. 115-120, 2001.
OLIVEIRA, G. P.; ALENCAR, M. M. Resistência de bovinos de seis graus de sangue Holandês-Guzerá ao carrapato (Boophilus microplus) e ao berne (Dermatobia hominis). Arquivo Brasileiro de Medicina Veterinária e Zootecnia, Belo Horizonte, v. 42, n. 2, p. 127-135, 1990.
PAIVA NETO, M. A. Estudo da incidência e localização de carrapato (Boophilus microplus) em bovinos nelore, holandês e curraleiro no Distrito Federal. Brasília: [S.l.], 2004. (Circular Técnica EMBRAPA Recursos Genéticos e Biotecnologia, n. 34).
PEREIRA, A. A. Aspectos ecológicos de Boophilus microplus (Canestrini, 1887) (Acarina:Ixodidae) no município de Franca, nordeste de São Paulo. 2008. Tese (Doutorado em Medicina Veterinária) - Universidade Estadual Paulista Júlio de Mesquita Filho, Jaboticabal.
SANTARÉM, V. A.; SARTON, I. F. Fase de vida livre e flutuação sazonal do Boophilus microplus em Botucatu, São Paulo, Brasil. Semina: Ciências Agrárias, Londrina, v. 24, n. 1, p. 11-20, jan./jun. 2003.
SANTOS JÚNIOR, J. C. B.; FURLONG, J.; DAEMON. E. Controle do carrapato Boophilus microplus (Acari:Ixodidae) em sistemas de produção de leite da microrregião fisiográfica fluminense do Grande Rio-Rio de Janeiro. Ciência Rural, Santa Maria, v. 30, 2 p. 305-311, 2000.
SAUERESSIG, T. M.; HONER, M. R. Dinâmica populacional do carrapato Boophilus microplus nos cerrados do Distrito Federal: análise e simulações. In: SIMPÓSIO BRASILEIRO DE PARASITOLOGIA VETERINÁRIA, 8., 1993, Londrina. Anais... Londrina: CBP, 1993. 36 p. p. A3.
SILVA, C. R.; ROCHA, E. F. Estudo sazonal da dinâmica populacional dos estágios parasitários de Boophilus microplus (Canestrini) (Acari:Ixodidae) na pele de hospedeiros da Raça Gir. A Hora Veterinária, Porto Alegre, v. 24, 142 p. 19-22, 2004.
SILVA, N. L.; PEROTTO, D.; CUBAS, A. C.; LESSKIU, C.; MOLETTA, J. L.; MOTTA, J. B. O. Modelo populacional do Boophilus microplus (Canestrini, 1887) em bovinos de corte, na região sul do estado do Paraná. In: SIMPÓSIO BRASILEIRO DE PARASITOLOGIA VETERINÁRIA, 8., 1993, Londrina. Anais... Londrina: CBP , 1993. p. A1.
VERÍSSIMO, C. J. Resistência e suscetibilidade de bovinos leiteiros mestiços ao carrapato Boophilus microplus. 1991. Dissertação (Mestrado em Zootecnia) - Universidade Estadual de São Paulo, Jaboticabal.
VILLARES, J. B. Climatologia zootécnica. III. Contribuição ao estudo da resistência e susceptibilidade genética dos bovinos ao Boophilus microplus. Boletim Indústria Animal, Nova Odessa, v. 4, n. 1, p. 60-86, 1941.
WHARTON, R. H.; UTECH, K. B. W. The relation between engorgement and dropping of Boophilus microplus (Canestrini) (Ixodidae) to the assessment of tick numbers on cattle. Journal of the Australian Entomological Society, v. 9, 3 p. 171-182, 1970.
Author notes
*Author for correspondence