Resumen:
Introducción: el objetivo de este trabajo es investigar la contribución del tejido adiposo y las adipocinas y la insuficiencia renal (KF).
Métodos: ratas machos se alimentaron con una dieta estándar de laboratorio (C) o una dieta hipercalórica incluyendo 30% de sacarosa; Grupo obeso (Ob) y obeso con grupo de insuficiencia renal (Ob/KF). Se evaluaron los cambios de adipocinas en condiciones de obesidad y KF, utilizando cirugía 5/6 para inducir lesión vascular. Las ramas anterior y media de la arteria renal izquierda fueron unidas, dejando la rama posterior viable para permitir sobreviviencia y función renal. El riñón derecho fue removido.
Resultados: se logró una tasa de supervivencia del 90% de los animales debido a un cuidado especial. La función renal disminuyó progresivamente después de la cirugía. En comparación con el grupo control, en los otros dos grupos (Ob y Ob/KF) el nivel de leptina aumentó y el de adiponectina disminuyó (p < 0.01). Se observaron aumentos postquirúrgicos en la presión arterial, los lípidos, la creatinina y la insulina (p < 0.01).
Conclusión: este modelo se propone para el estudio de los mecanismos fisiopatológicos que conducen a la obesidad y las complicaciones de la función renal o cardiovascular.
Palabras clave:Renal Insufficiency, CronicRenal Insufficiency, Cronic,ObesityObesity,AdipokinesAdipokines,HypertensionHypertension.
Abstract:
Background: The aim of this paper is to investigated the contribution of adipose tissue thought the adipokines and kidney failure (KF)
Methods: In male rats were fed with a standard lab diet (C) or a hypercaloric diet including 30% sucrose; obese group (Ob) and obese with kidney failure group (Ob/KF). We evaluated the changes of adipokines under conditions of obesity and KF, using 5/6 surgery to induce vascular injury. The anterior and media branches of the left kidney artery were tied together, leaving the posterior branch viable to enable the kidney to function. The right kidney was removed.
Results: A 90% survival rate of the animals was achieved due to special care taken. Kidney function progressively decreased after surgery. Compared with the control group, in the other two groups (Ob and Ob/KF) the level of leptin increased and that of adiponectin decreased (p < 0.01). Post-surgery increases were observed in blood pressure, lipids, creatinine and insulin (p < 0.01).
Conclusion: This model is proposed for the study pathophysiological mechanisms that lead to obesity and complications of kidney or cardiovascular function.
Keywords: Insuficiencia Renal Crónica, Obesidad, Enfermedad Cardiovascular, Adipoquinas.
Aportaciones originales
Relationship of receptors of adipokines with hypertension and obesity. Murine model*
Relación de receptores de adipocinas con hipertensión y obesidad en modelo murino
Instituto Mexicano del Seguro Social
Received: 22 May 2017
Accepted: 19 June 2017
Disorders as obesity, hypertension and diabetes are the primary causes related of chronic kidney failure and/or kidney transplant. Furthermore, epidemiological studies with large numbers of patients suggest a direct association between obesity and the advancement of kidney failure.1 Until recently hospitals had ignored the importance of maintaining records on kidney failure. Additionally, this disorder advances at first without symptoms.2 Therefore, the exploration of the relation between obesity and kidney failure has met with difficulties, underlying the importance of developing an animal model that could be used for this purpose.
Ageing, which is associated with a tendency to an increase in adipose tissue, has been identified as a predominant risk factor for heart disease which in turn is clearly linked to kidney failure.3,4 It has been reported that patients with heart failure, 57% had kidney failure.2,5,6,7 It is known that in an obese person the adipocyte produces proinflammatory adipokines such as leptin, which contribute to heart disease. Contrarily, adipocytes also produce anti-inflammatory adipokines such as adiponectin, which has benefic effects for the cardiovascular system.8
Several studies demonstrated that administration of a fructose or sucrose rich diet to normal rats of either sex induces several features of the human phenotype of obesity. Also increases the production of reactive oxygen species (ROS), as a consequence, the enlarged abdominal adipocytes of fed rats with hypercaloric diet overproduce leptin.9
Therefore, recent studies on obesity have focused on exploring the participation of adipokines on cardiovascular remodeling. Through studies with distinct animal models, it has been found that cardiovascular remodeling is due to the participation of various factors: hemodynamics (activation of reactive species, including ROS and RNS, and an increase in blood pressure), metabolism (endothelial dysfunction, lipotoxicity and hyperglycemia), and inflammation.10
In the present work, the aim was to establish an experimental animal model that can be employed to study the association between obesity and kidney failure. This model should allow for the exploration of metabolic dysfunctions associated with obesity, including those related to heart disease.
A total of 30 male Sprague Dawley rats (200 to 250 g) were employed in the study. Animals were housed in a clean room with regulated temperature and a 12-hour light-dark cycle of National Medical Center under standard laboratory conditions. All animal procedures complied with published recommendations for use of laboratory animals by the government. Animals were assigned in groups in the period after weaning categorized immediately, the control group was fed a standard diet (Purina rat chow) (C), while the other two groups obese (Ob) and obese with kidney failure (Ob/KF) were given a hypercaloric diet that included 30% sucrose. At six months, in one group kidney failure was induced with 5/6 kidney surgery.
Surgery was carried out in two phases in the Ob/KF group. Firstly, ischemia was induced in the left kidney. Each rat was laid on its side and the abdominal cavity was dissected. Parts of the intestine were eviscerated to facilitate the exposure of the kidney at the hilum. The anterior and media branches of the kidney artery were tied together, leaving the posterior branch viable to enable the kidney to function. The second part of surgery was the removal of the right kidney after a paramedian laparotomy (at 2 cm from the median line). This incision was made because it heals quickly. A part of the intestine was eviscerated to locate the hilum of the kidney, and then the kidney artery and vein were individually tied, as was the ureter. Then the nephrectomy was carried out, and animals recovered for 8 weeks before sacrifice.
Determination was made of glucose levels in the blood, considering hyperglycemia with a level > 100 mg/dL. A curve of tolerance to glucose was made by administering 2g/kg of body weight and then monitoring the response in the rat every 30 min for 2 hours. Blood samples were taken at 8 am (during fasting) by a longitudinal cut on the end of the tail. One drop of blood was placed on the reactive strip of the glucometer. For the Ob/KF group, glucose levels were determined before and after 5/6 kidney surgery.
Determinations of levels of cholesterol, triglycerides, high-density lipoproteins (HDL) and creatinine were made on a Cardiocheck apparatus after placing one drop of blood (see previous section on blood samples) on a reactive strip.
Cardiovascular parameters, including blood pressure and heart rate, were measured with a non-invasive method by using a digital plethysmograph (Kent Scientific Corp.) applied to the rat tail.
Upon sacrificing the animals, blood was collected in a tube and centrifuged to separate the plasma. Kits were used to measure insulin, adiponectin and leptin (Lincoln Research). The intra and interassay coefficients of variation were < 10%.
Total cellular RNA was isolated from rat endothelial cells using 1ml of Trizol reagent in 1 X 10⁶ cells (Invitrogen, Carlsbad, CA) according to the manufacturer’s protocol. Briefly, RNA was precipitated from the Trizol solution after the addition of chloroform, followed by isopropyl alcohol, and then washed in 75% ethanol in diethyl pyrocarbonate-treated (DEPC) water. Ethanol was then removed, and RNA pellets were briefly air-dried before the addition of 20 µl of RNase-free water. Contaminant genomic DNA was removed by DNase treatment (DNA-free; Ambion, Austin, TX). Total RNA was eluted in DEPC-treated water (pH 7.5). Total RNA concentration and quality was determined spectrophotometrically at 260 nm/280 nm and isolated RNA was stored at -70ºC.
Purified total RNA (1 µg) was used as a template to generate cDNA (Kit First Strand cDNA Synthesis, Fermentas Life Sciences), RT-PCR were performed using a kit from Invitrogen Life Technologies which was amplified with a specific primer for AdipoR1, AdipoR2 and Ob-Rb receptor and actin. PCR mixture contained 0.5 U per sample of Taq DNA polymerase and buffers (PCR amplification buffer 30 mM MgCl), 10 mM dNTP; 15 µM each 5′ and 3′ primers were added to cDNA samples from AdipoR1. Forward primers used were 5′- AGGTATCCATCCATCCCACA-3′ and reverse primer 5′-CTTCAGAGGCAGGAAACAGG-3′ (product size 600 bp); AdipoR2 forward primers used were 5′- AACTCAAGTTCGACCCAG -3′ and reverse primer 5′- TTTCAACTCTGCAGCCAT-3′ (product size 404 bp). From Ob-Rb receptor forward primers used were 5′-CCAGGTGAGGAGCAAGAGAC-3′ and reverse primer 5′-CTGCACAGTGCTTCCCACTA-3′ (product size 470 bp). From β-actin, forward primer 5′- CCTGGGTATGGAATCCTGTG-3′ and reverse primer 5′-TTGTAAAGAAAGGGTGTAAA -3′ (product size 374 bp) were used. Initial denaturation at 95 °C for 5 min was followed by 35 cycles of denaturation for 1 min at 95 °C, annealing for 1 min at 55 °C and extension for 1 min at 72 °C, and the PCR was terminated by a final extension at 72 °C for 5 min using a thermocycler Master Cycler ep Gradient S (Eppendorf North America, Westbury, NY). Subsequent assay results were analyzed relative to a housekeeping gene (actin) within the same sample to normalize for possible variations in RNA quality and quantity and RT-PCR efficiency actin levels were analyzed independently and did not vary in any of the experimental groups.
The total RNA and expected PCR products were analyzed on 2% agarose gels containing ethidium bromide. Finally, the optical density (OD) of bands was measured using a Kodak Transilluminator Gel Logic 200 (Estman-Kodak, Rochester, USA). Data are show as a ratio of AdipoR1, AdipoR2 and ObRb expression to actin.
Values represent the mean ± standard deviation (SD) and were introduced into a data base and analyzed by two-way ANOVA with the Graph Pad Prism 6 program. When necessary, the Student’s t test was used for paired and unpaired data. Statistical significance was considered when p < 0.05.
Due to the large quantity of fat in obese rats, adipose tissue represented a difficult problem in surgery. Therefore, 30% more anesthesia was employed with these animals (figure 1). At approximately 10 days after the second surgery, coarse and wiry hair of a yellowish color was noted on rats, as well as slight inflammation at the metatarsus (without difficulty in hind leg function). Kidney damage was confirmed by an increase in creatinine levels and blood pressure (table 1).
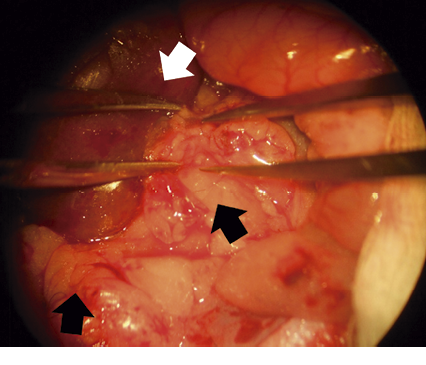
Figure 1
Image obese rat kidney, a large amount of adipose tissue is observed, the perirenal fat should be removed carefully to ligation of the renal arteries
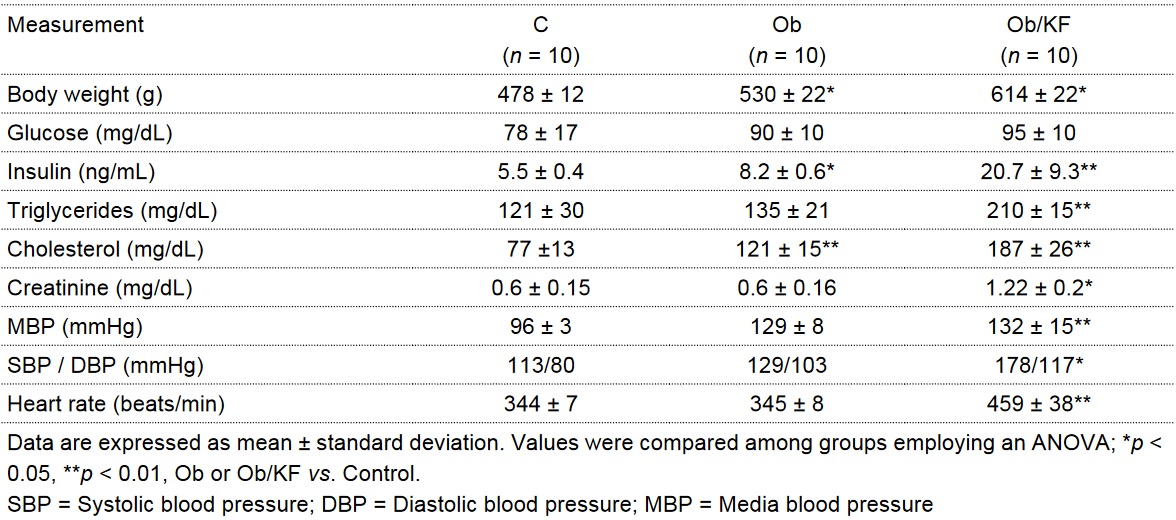
Table I
Plasmatic concentrations of biomarkers and blood pressure in control (C), obese (Ob) and obese with kidney failure (Ob/KF) groups
The diet rich in carbohydrates (30% sucrose) led to a greater body weight in two groups of animals (obese, obese with kidney failure) than in the control group (p < 0.01). Compared to the control group, metabolic changes were detected in these two obese groups. There was a tendency to greater glucose levels (without reaching a significant difference), greater levels of insulin (concluding that there was insulin resistance in these animals), greater levels of cholesterol and triglycerides (table 1), and changes in adipokines (showing an increase in leptins and a decrease in adiponectin; p < 0.01) (figure 2). Kidney damage was confirmed by creatinine levels and blood pressure.

Figure 2
Plasmatic leptin and adiponectine concentrations in control (C), obese (Ob) and obese with kidney failure (Ob/KF) groups
Data are expressed as mean ± standard deviation. Values were compared among groups employing an ANOVA; *p < 0.05, **p < 0.01, Ob or Ob/KF vs. Control
In the control group compared Ob groups showed an increased expression of the receptor Ob-Rb (p < 0.05). Likewise, AdipoR1 expression reached a maximal 2-fold increase in Ob vs control group (p < 0.001) (figure 3).
The result confirms the relevance of obesity-stimulates in AdipoR1 and leptin receptor in the activity for angiogenesis
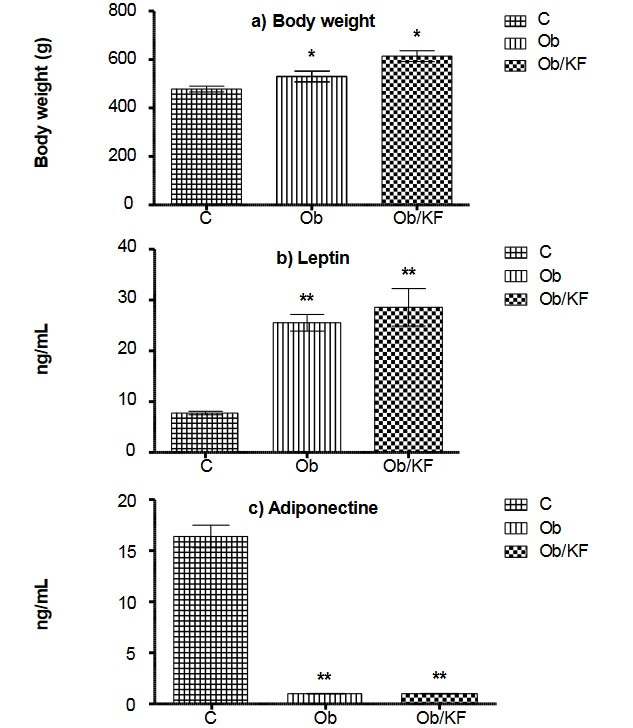
Figure 3
Changes in expression of ObRb, AdipoR1 and AdipoR2 endothelium cells of control (C), obese (Ob) and obese with kidney failure (Ob/KF) groups
Data are expressed as mean ± standard deviation. Values were compared among groups employing an ANOVA; *p < 0.05, **p < 0.01, Ob or Ob/KF vs. Control
As a result of changes in diet and an increase in sedentariness, there has been an increase in obesity in the world in recent decades. Obesity is a risk factor for several chronic degenerative diseases, including diabetes and heart disease. This fact has stimulated research into the physiopathological mechanisms that trigger these disorders.
An important factor leading to adult overweight and obesity is the prevalence of a hypercaloric diet (rich in fat and carbohydrates) at both the prenatal and postnatal stage.11,12,13 Hence, animal models have been developed for the study of obesity and its cardiovascular complications. The animal model employed in this work with the ingestion of a diet with 30% sucrose, induced obesity in rats. This model imitates the prevalence of carbohydrates in the diet of most people today.14,15
Sprague Dawley rats were chosen due to their genetic predisposition to the development of high blood pressure (systemic as well as in the glomerulus capillaries, the latter leading to progressive glomerulus damage).16 It is known that the model of a 5/6 nephrectomy, which drastically reduces kidney mass, is an aggressive treatment that generally has low survival rates.17
With the care taken in the surgery of the present study, there was a 90% survival rate of animals, despite hypertension and metabolic changes (in cholesterol, triglycerides, insulin and creatinine). Great care was taken to deal with the increase in adipose tissue in the abdominal cavity and at the periphery of the kidney, as well as the abundance of connective tissue between the kidney artery and vein (complicating the separation of both vessels) that is typical of rats at 6 months of age (figure 1). In some studies, involving 5/6 kidney surgery, anti-hypertensive drugs are administered or the diet used is low in sodium,18,19 which was not the case in the present study.
The focus of this study was to evaluate the influence of an increase in adipose tissue on metabolic changes resulting from the induction of insulin resistance. In obese rats and animals with obesity accompanied by kidney failure, the level of leptins increased and that of adiponectin decreased compared with control animals. These alterations are considered part of an inflammatory process,20,21,22 and are related to endothelial and cardiovascular dysfunction.
The binding of leptin and adiponectin to their respective receptors activates a cascade of intracellular signaling involving the participation of some transcription factors, such as NF-kB and c-Jun, which regulate and stimulate the synthesis of proinflammatory cytokines.23 However, knowledge is limited of these molecular signals of adipokines and their connection to cardiovascular and renal dysfunction.24,25
The effects of adiponectin on glucose and lipid metabolism are mediated by adiponectin receptors,26 our study demonstrated that Adipo R1 expression in endothelium was altered by obesity and hypertension and suggests a regulation of AdipoR1. Also, AdipoR2 decreased expression in the development of obesity.
The animal model of microsurgery employed in the present study is reproducible and applicable to further research into the relation between adipose tissue and kidney failure. Since this model mimics the characteristic causes of obesity in humans, it should certainly be relevant in exploring the physiopathological mechanisms of kidney failure in patients.
PubMed: https://www.ncbi.nlm.nih.gov/pubmed/29792610
http://revistamedica.imss.gob.mx/editorial/index.php/revista_medica/article/view/2509/2876 (pdf)
We acknowledge the support of the Instituto Mexicano del Seguro Social (IMSS) (FIS/IMSS/PROT/G14/1330) and the Mexican National Research Council (SNI/CONACYT). Leticia Manuel Apolinar acknowledges Foundation IMSS, A.C.
Figure 1
Image obese rat kidney, a large amount of adipose tissue is observed, the perirenal fat should be removed carefully to ligation of the renal arteries
Table I
Plasmatic concentrations of biomarkers and blood pressure in control (C), obese (Ob) and obese with kidney failure (Ob/KF) groups
Figure 2
Plasmatic leptin and adiponectine concentrations in control (C), obese (Ob) and obese with kidney failure (Ob/KF) groups
Data are expressed as mean ± standard deviation. Values were compared among groups employing an ANOVA; *p < 0.05, **p < 0.01, Ob or Ob/KF vs. Control
Figure 3
Changes in expression of ObRb, AdipoR1 and AdipoR2 endothelium cells of control (C), obese (Ob) and obese with kidney failure (Ob/KF) groups
Data are expressed as mean ± standard deviation. Values were compared among groups employing an ANOVA; *p < 0.05, **p < 0.01, Ob or Ob/KF vs. Control
