Patentes verdes brasileiras: comportamento das invenções que recebem o maior número de citações
Brazilian green patents: behavior of inventions that receive the highest number of citations
Patentes verdes brasileiras: comportamento das invenções que recebem o maior número de citações
Em Questão, vol. 28, núm. 2, pp. 170-187, 2022
Universidade Federal do Rio Grande do Sul

Esta obra está bajo una Licencia Creative Commons Atribución 4.0 Internacional.
Recepción: 20 Junio 2021
Aprobación: 20 Octubre 2021
Resumo: O objetivo da pesquisa é verificar quais são as variáveis que influenciam o comportamento das patentes que mais recebem citações. A literatura reconhece o número de citações recebidas como um dos indicadores mais importantes para descobrir o valor de uma invenção. Essa alegação é testada em uma população de pesquisa que consiste no conjunto de patentes verdes brasileiras registradas no banco de dados do Global Patent Index. São utilizadas as seguintes variáveis: tipo de requerente, país do requerente, número de inventores, código de classificação internacional de patentes, tamanho da família, renovações, solicitação do Tratado de Cooperação em Matéria de Patentes, família triádica, concessão e número de citações. Essas variáveis são utilizadas para criar uma árvore de decisão e uma regressão logística com o Statistical Package for the Social Sciences, V.21, e o MS Excel. Os resultados mostram que, no comportamento das patentes verdes brasileiras, o tamanho da família e as renovações estão vinculados às patentes mais citadas. Outra variável significativa, mas cujos números não foram significativos o suficiente para colocá-la na árvore de decisão, foi a adesão ao Tratado de Cooperação em Matéria de Patentes.
Palavras-chave: Valor de patente, Citações recebidas, Propriedade industrial, Patentes verdes.
Abstract: The objective of the research reported here is to ascertain what variables influence the behavior of the patents that receive the most citations. The literature recognizes the number of forward citations as one of the most important indicators for discovering an invention’s value. This claim is tested in a research population consisting of the set of Brazilian green patents registered in the Global Patent Index database. The following variables are used: applicant type, applicant country, number of inventors, International Patent Classification code, family size, renewals, Patent Cooperation Treaty applicability, triadic family, grant and number of citations. These variables are used to create a decision tree and a logistic regression with the Statistical Package for the Social Sciences, V.21, and MS Excel. The results show that, in the behavior of Brazilian green patents, family size and renewals are connected to the most-cited patents. Another significant variable, but one whose numbers were not significant enough to place it in the decision tree, was membership in the Patent Cooperation Treaty.
Keywords: Patent value, Forward citation, Industrial property, Green patents.
1 Introduction
The literature on technological innovation endeavors to measure the knowledge of countries, regions and institutions through patents. Mere numbers telling the volume of patents filed and granted are not enough, though, because that type of analysis measures only inventive ability, not innovative aspects.
For an invention to become an innovation, it must find itself a place in the market and generate some kind of returns for its owner. In “The Theory of Economic Development,” in 1991, Schumpeter (1997) differentiated invention from innovation in that innovation is the successful implementation of an invention and refers to new combinations of existing or nonexistent resources to produce new goods or tap new markets.
The literature on the subject of patent value exhaustively reports that there are many patents that have no value and few patents with high value. Stevens and Burley (1997) say that for every 100 patents produced, only one to three patents may bring significant financial returns, since the chances of any idea becoming an economic success are so low that many ideas are needed to beat the odds.
To elucidate this gap, the literature on patent value is growing, reporting more and more studies furnishing information on quality. Part of the literature focuses on data found in databases, like citations, renewal fees, number of family members, number of claims and legal disputes.
The citation indicator (indicating patents cited by other patents) is used in patent value literature as the most important indicator for assigning value to a patent. Sapsalis, van Pottelsberghe de la Potterie and Navon (2006) explain that, when data on monetary value are not available, the literature relies on the number of citations as a good substitute for a patent’s value.
Investigating the behavior of the most highly cited patents can draw a predictive picture of the characteristics of possible success, because the higher the technological quality of the patent, the more inventions should be based on the underlying invention, thus increasing the value of the patent’s right of exclusion (Fischer; Leidinger, 2014). Another point the literature makes is that the volume of citations demonstrates the value of the quality of the patent as an idea pioneer (Ercan; Kayakutlu, 2014), in addition to demonstrating the patent’s importance as a basis for subsequent technological inventions (YANG et al., 2015).
In this context, the main objective of the research reported here is to investigate what qualitative and quantitative variables influence the behavior of the patents that receive the most citations.
For this purpose, the following variables were used: applicant type, applicant country, number of inventors, International Patent Classification (IPC) number, number of countries where the invention is protected (number of family members), number of renewals, applicability/inapplicability of the Patent Cooperation Treaty (PCT), triadic family, grant and number of citations.
The research population is the set of Brazilian green patents registered in the Global Patent Index (GPI) database. The Brazilian Green Patent Program started as a pilot and is now offered as a service by the Instituto Nacional da Propriedade Industrial (INPI). It provides a priority examination route separate from all other priority examination requests, expediting the examination of patent applications for technologies aimed at sustainable development in areas the Brazilian government considers strategic. The term “green technologies” here refers to these categories: (i) alternative energies, (ii) transportation, (iii) energy conservation, (iv) waste management and (v) agriculture (OMPI, 2014).
The next section examines the various indicators of patent value and explores the importance of each.
2 Patent value indicators
Ascertaining patent value is a tricky task that researchers seek to accomplish by combining patent indicators or asking inventors/applicants for their views. According to Lemley and Myhrvold (2008), it is particularly difficult to assess the value of patent rights, because patents exist in a blind market with high information asymmetry, where only the parties directly involved know the terms of the transaction.
But it is possible to approach an answer if a patent has some kind of value. The value the applicant places on the patent can be gleaned from the applicant’s strategy, while the value third parties assign to the patent shows in their citations of the invention or their legal attempts to prevent the patent from gaining protection.
Table 1 below contains some of the main patent value indicators and what they reveal about the value of inventions.
| Indicator | Definition | Rationale |
| Backward citation | Number of citations of previous patents | Technological evolution; measures the breadth of the technological base on which the patent is built; indicates the extent to which the patent makes use of the existing prior art. |
| Grant | Examination by the patent office that evaluates whether the invention meets the grant criteria | Private, economic and technological value; first indicators of an invention’s quality; official recognition of the invention as fulfilling patentability criteria: novelty, inventive step (non-obviousness) and industrial applicability. |
| Family size | The number of international patents filed for the same priority patent | Private, market and economic value; geographical scope of patent protection; costliness of seeking protection in different jurisdictions; sign of an invention’s market potential; indication that a patent is important on an international scale and that the patent’s validity has been certified by various patent offices. |
| Forward citation | Number of citations by subsequent patents | Technological, economic, social and market value; technological evolution; technological importance; impact on subsequent technology developments; indication of the patent’s significance for further research. |
| Litigation | Third parties’ opposition to granted patents that they deem invalid | Economic, market and private value; scope of patent protection; breadth of the technology claimed by the patent holder; costs and risks associated with legal disputes. |
| Number of claims | A clear and concise definition of what the patent legally protects | Economic value; legal scope of patent protection; a broader scope refers to a broader area of technology from which others are excluded; indication of the breadth of the technology claimed by the patent holder. |
| Number of inventors | Number of inventors involved in creating the invention | Economic and technological value; the number of inventors can be a proxy for the cost of the research behind the invention, which itself is statistically related to the invention’s technical value: the more resources involved, the more research-intensive and expensive the project. |
| Number of technical classes | The number of IPC classes a patent covers | Used as a proxy for the scope; scope of the knowledge under patent protection. |
| Patent Cooperation Treaty | Agreement enabling a patent applicant to seek patent rights in a large number of countries by filing a single international application with a single patent office and then enter the national stage in the desired countries at a later date | Economic, private and market value; seen as an indicator of inventions with higher market expectations; used as a filter of quality. |
| Opposition | Third parties’ objection to granting a patent for an invention | Economic, market and private value; scope of patent protection; costs and risks associated with legal disputes. |
| Renewals | Maintenance costs to keep the patent valid during a maximum period of 20 years | Private, economic, technological and social value; renewal rates allow estimation of the distribution of value; patents are renewed only if the value of keeping the patent alive is higher than the cost of renewing the patent. |
| Triadic family | A set of patent applications filed at the EPO, JPO and USPTO | Economic, private and market value; scope of patent protection; used as a quality filter (only those patents with high expected commercial value are applied for); used as an indicator of a country’s “patent intensity.” |
Note that each indicator can be used to reveal a different aspect of a patent. Indicators like backward citation, family size, number of claims, number of inventors, number of technical classes, PCT and triadic family can be determined at the beginning of the patent life cycle, because they are decided by the inventors or applicants.
Then there are signals that only appear with time, such as grant, forward citation, litigation and opposition. These indicators depend on third parties like patent offices, patent users and competitors.
One of the most often-used indicators – and one of the most effective for measuring the value of an invention according to the literature – is forward citation (Sapsalis; van Pottelsberghe de la Potterie; Navon, 2006; LEE; SOHN, 2017). Forward citation data are calculated as of the patent’s public disclosure date, so they grow with time; after all, each patent has a different age.
3 Methods and data
This section describes the data collection process and the steps in building the research model.
3.1 The databases and data collection
Three databases were needed to collect the data. The first database is the Global Patent Index (GPI), an online tool developed by the European Patent Office (EPO) for searching worldwide patent data and Espacenet, the EPO patent database. The GPI is a subscription database that provides 30 days of testing for free. The search was carried out on November 12, 2019, with the following search strategy: EVDE=“green patent”. “EVDE” stands for “Event description,” where the database searches for records of the patent's legal procedures in relation to the office. The database recovered 631 family patents. The patents whose applications to enter the Brazilian Green Patent Program were rejected and the documents referring to utility models and certificates of invention were removed from the research population. The final population totaled 478 patents.
The Brazilian patent office’s database (Base de Dados do INPI) was also used to complement the data and check the veracity of some fields. Like any national patent office database, it contains patents registered in national territory. Its data export capabilities are limited, so the data were collected by hand on April 29 and 30, 2020. These data concerned renewals and grants.
Patent citations were collected from the Derwent Innovation Index (DII) database on April 3, 2020. DII belongs to Clarivate and contains references and abstracts of more than 11 million patents, with links to cited documents, patent citations, related literature and the full texts of the documents. It includes publications from 40 international and national patent registration and granting institutions. The period available online is from 1966 to the present (Clarivate, 2020). The data were collected by hand because the citation data cannot be exported.
3.2 Organization and calculation of indicators
The data were used to build a table in Libreoffice with ten variables: applicant country, applicant type, number of inventors, grant, family size, triadic family, PCT, IPC, renewals and citations.
3.2.1 Preliminary analyses
Once the indicators were calculated, a descriptive analysis was carried out to obtain a general characterization of central tendency and dispersion statistics. A Kolmogorov-Smirnov test showed that the independent variable (citations) does not follow a normal distribution (D=478)=.387, p=.001. For this reason, the median was chosen to establish two groups for the dependent variable. Nevertheless, 322 patents have 0 citations. This implies that the median of the whole set is 0, and for this reason the median of the patents with at least one citation was calculated (Me=4) and used to create the two groups. Group 1 includes patents with four or more citations (85 cases), whereas group 0 includes patents with three or fewer citations (393 cases). The techniques used in this research do not require a similar number of elements in each dependent variable group, so they can be validly applied despite the disparity in the number of cases in each group.
Mann-Whitney U tests were performed to identify statistically significant differences between the two groups without taking into account the interaction between dependent variables. The mean ranks for group 1 in family size (399.22) were significantly greater than for group 0 (204.96); U (Nunder the median=393, Nequal/above the median=85)=3126.500, p<.001. In the case of renewals, the same conclusion applies: mean ranks for group 0=207.19, and mean ranks for group 1=388.89; U (Nunder the median=393, Nequal/above the median=85)=4004.000, p<.001.
3.2.2 Construction of the decision tree and the logistic regression model
The variable of interest, citations, is considered the dependent variable, whereas the remaining nine variables are independent variables.
A decision tree was built for the variable (under the citation median or above the citation median) using International Business Machines (IBM) Statistical Package for the Social Sciences (SPSS) (V.21). The CHAID algorithm was chosen, which has a maximum depth of three (This is the maximum tree depth by default using the CHAID algorithm), with 10-fold cross-validation, and all the variables described above (except for the identification variables) were inputted as independent variables (HAUGHTON; OULABI, 1997). The independent variables were: applicant country, applicant type, grant, family size, triadic family, PCT, IPC, renewals and number of inventors.
The country was also excluded as an independent variable, because the vast number of cases would greatly complicate analysis, and an alternative aggregation by regions or continents would require the creation of an artificial coding system that does not correspond with the potential interests of inventors (who usually do not choose such aggregation levels when deciding the countries in which they request protection for their inventions). A logistic regression (forward stepwise, Wald criterion) was performed with a significance>.001 (Nagelkerke R-square=.651).
4 Results
In this part, the decision tree with its respective data analysis will be presented. Next, the logistic regression is explained with its statistical details and, finally, the analyses of percentage of years with renewals and the patent age.
4.1 Decision tree
The decision tree presents two variables that are valid predictors of the number of citations (“Number of citations” has been operationalized in terms of values equal to or greater than the median of citations for patents with at least one citation, coded as “1,” and values less than the median of citations for patents with at least one citation, coded as “0”): family size, which is the main predictor variable and generates the first set of child nodes in the decision tree, and number of renewals, which operates at the level of the child nodes produced by the previous split. The remaining variables do not provide splitting points that yield statistically significant values in the chi-square test. Therefore, they are excluded from the decision tree (Figure 1).
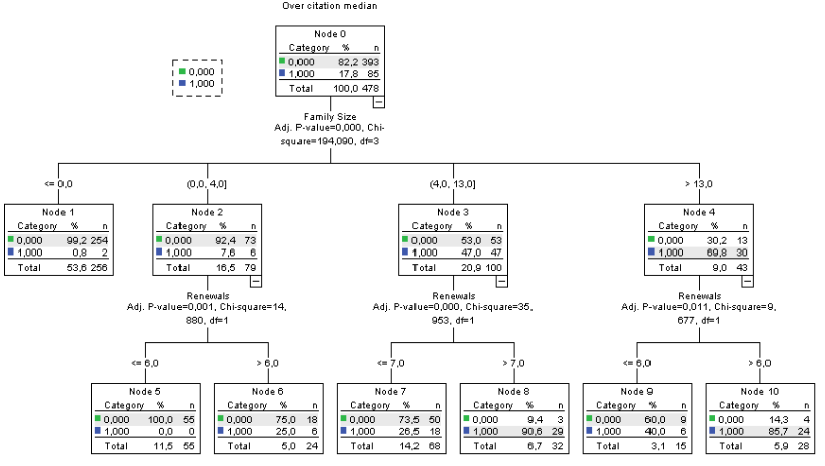
Figure 1 -
Decision tree for the most highlycited Brazilian green patents
Source: Survey data.
Source: Survey data.
The median has been calculated for values greater than 0 in citations. It is four. Values equal to or greater than four citations have been coded as “1,” and the rest, as “0.” As can be seen, the main variable predicting whether a patent is above/equal to or below the median in number of citations is the number of members of its family. For nodes 2, 3 and 4, the next segmentation variable is the number of renewals.
The error estimate using re-substitution and cross-validation (.088 [standard error: .013]; cross-validation estimate: .126 [standard error: .015]) are similar. These values are usually interpreted as a measure of the tree’s predictive precision. In this case, the values are related to the proportion of cases incorrectly classified by the model. The model presents a limited sensitivity of 62.4%, although its specificity is much greater (98.2%). Overall, the model is able to classify 91.8% of cases correctly.
Figure 1 shows that the “family size” variable is the main predictor of the independent variable. “Family size” is divided into four nodes:
(1) Node 1: This contains the inventions that do not have a family (the most numerous grouping, 53.6% of the patents). There are only two patents with a number of citations equal to or above the median (Me = 4, internally encoded as “1”). This node did not yield any child nodes.
(2) Node 2 and subsequent splits: This contains patents with between zero and four protection requests in different countries. This node holds 16.55% of the total number of patents in the sample, and 7.6% of its elements have the value of “1”. Node 2 splits into two child nodes, 5 and 6, according to the values of the “renewals” variable, which is the second most-relevant predictive variable. For node 2, there are statistically significant differences between the patents with six or fewer renewals (node 5), where there are no patents with a number of citations equal to or above the median (over 55 cases in the node), and the patents with more than six renewals (node 6), where 25% of the patents (6 out of 24) have a value of “1.”
(3) Node 3 and subsequent splits: Family size ranges between four and 13. Forty-seven percent of the patents in the node (100 in total) present citation values equal to or over the median. This node splits into two nodes depending on the number of renewals: node 7 (with seven or fewer renewals), of which 26.5% (n=18) are cases with a number of citations equal to or over the median, and node 8, with more than seven renewals, of which 90% (29 out of 32) are cases that received a number of citations equal to or above the median.
(4) Node 4 and subsequent splits: Node 4 contains patents whose family size is over 13. In this node, 69.8% of the patents (30 out of 43) received a volume of citations equal to or above the median. This node splits into two child nodes, which, as in the case of node 5, are given by values of renewals equal to or smaller than six (node 9, with 40% (6 out of 15) patents with a volume of citations equal to or over the median) or greater than six (node 10, with 85.7% (24 out of 28) patents presenting citation values equal to or over the median).
4.2 Logistic regression
The final regression model had, overall, a statistically significant χ2 (df=3, n=488) 241.004, p=.001 (omnibus tests for the model in the third step). The Nagelkerke R-square value (0.657) indicates a reasonably high proportion of the variance explained by the model. Also, the Hosmer-Lemeshow test results (sig. 0.816) indicate an acceptable goodness of fit. The model presents a sensitivity of 64.7% and a specificity of 96.4%, with an average overall percentage of correct classifications of 90.8%.
The number of family members presents a significant effect (Wald 11.294, df=1, p<0.001). The odds ratio (1.121) for this variable shows that the effect of family size on level 1 of the dependent variable is positive. For every unitary increase in the number of family members, the likelihood of having a value of citations equal to or above the median changes by a factor of 1.121. The second variable in the equation is renewals (Wald 47.053, df=1, p<0.001). The odds ratio (1.642) shows that the likelihood of having a value of citations equal to or above the mean changes by a factor of 1.642 with every unitary increase in the value of the “renewals” variable (where the rest of the variables remain constant). Lastly, PCT is also included in the equation as a predictor (Wald 63.112, df=1, p<0.001), but its odds ratio is particularly small: 0.087. This result, although statistically significant, has a very limited effect in terms of changing the odds of a given patent’s having a number of citations equal to or greater than the median for this particular set of patents.
4.3 Analyses of percentage of years with renewals and patent age
It could be argued that, since the number of renewals is, as expected, strongly correlated with patent age in years (Rho = 0.79), and the number of citations is moderately correlated with patent age in years (Rho = 0.42), age by itself could account for a significant amount of the variability in citation values, which would indicate a spurious segmentation in the classification tree.
In order to test whether a spurious relationship exists between the two variables, the percentage of years with renewals (percentage of years from the applicant year to 2020 with renewals) was calculated.
This variable was imputed as an independent variable in the same classification tree as presented in the paragraphs above, with two variants. In the first case, the “renewals” variable was excluded beforehand from the set of initial independent variables to avoid undesirable interaction with the percentage of renewals, since one is derived from the other. In the second case, to explore the two variables’ interaction in the tree model, the “renewals” variable was imputed together with the rest of the independent variables.
In case a), only family size was a statistically significant predictor of the patent’s having more than the median number of citations. In case b), family size and renewals were the two predictor variables. The percentage of years during which a patent is renewed is not a predictor variable. One possible explanation is that, when a patent ceases to be perceived as potentially profitable, the inventor ceases to renew it, and this result is congruent with the perception of the patent’s value. Further analyses comparing the number of citations received before and after the last year of renewal are necessary to shed light on the interpretation of this relationship, but in any case, the moderate correlation between patent age and citation (.42) does not support the conclusion that age by itself is a valid predictor of the dependent variable.
In this sense, an analysis such as the one presented in section a) including the patent’s age as independent yielded age as an independent variable with predictive power, but only on a splitting node [χ² (1,N=39)=873, p<0.001] with this variable as a predictor, and without an interpretable linear relationship for the values of age for the two resulting child nodes (child node i. contains patents 10 to 14 years old, while child node j. contains patents two to 13 years old). In other words, age is a predictor of citations, but not with a linear model. Hence, conclusions like “Ceteris paribus, the older the patent, the greater the number of citations” are not supported by the interpretation of the decision tree or by the correlation between age and citations.
5 Discussion
It is clear from the decision tree that the three value indicators of citation, family size and renewals are associated. As the family size increases, the number of most-cited patents grows; see: node 1- zero family – 0.8%, node 2 - zero to four family members – 7.6%, node 3 – four to 13 family members - 47% and node 4 - more than 13 family members – 69.8% of most-cited patents.
The same thing happens with renewals. The nodes that represent the inventions with the highest number of renewals are the ones that have the most-cited patents. Observe: node 6 –inventions with more than six renewals - 25%, node 10 - inventions with more than six renewals but also more than 13 family members – 85.7% and node 8 – inventions with more than seven renewals – 90.6% of the most-cited patents.
Some of the literature addresses the relationship among the variables of citation, family size and renewals.
Han and Sohn (2015) declare that a patent that is frequently cited by other patents has a longer survival time. Other research into citations and renewals states that renewals are the data for estimating value, because, if a patentee finds it unprofitable to renew at year four, it will be even more unprofitable to renew at years eight and 12, so an optimal rule is to renew if and only if it is profitable to renew for the next immediate period (BESSEN, 2008). Bessen (2008) uses many variables, including the number of citations, and the results conclude that patent citations received increase patent value by 4 to 7%. However, Bessen (2008) highlights that, although patent citations are significantly correlated with patent value, they explain a only small portion of the variance in patent value.
Already the relationship between temporal scope and geographical scope is solid. Yang et al. (2015) report that data on renewal and family are correlated to the Research & development cost of products. Added to that, renewal and family are used as proxies for patent evaluation, because patentees only shoulder the additional costs of extending protection to other countries if they deem it worthwhile, and the same happens with renewal, when the fee typically increases over time, and, at the end of every period, patent holders must decide whether or not to renew (YANG et al., 2015).
Family and renewal constitute two essential dimensions of a patent life, which together reflect the efforts and costs incurred by patent owners to acquire and uphold their rights. In both cases substantial funds indeed are required to keep a patent alive: renewal fees for each year of protection; validation fees and translation costs for each country of protection (van Pottelsberghe de la Potterie; van Zeebroeck, 2008).
And to complete the discussion of the literature, Deng (2007) reports that the owners of higher-quality inventions not only choose to keep their patents alive longer in a given country, but also seek patent protection in more countries (DENG, 2007).
6 Conclusions
The research objective was reached, and the variables connected to the most-cited patents were identified. Through the methodology described above, it was discovered how Brazilian green patents might behave and which are possibly the most valuable among them.
Generally and simply put, if a patent has significant market potential, its applicant will apply for protection in as many countries as possible (and of course in countries where some risk threatens the invention). If the patent successfully demonstrates that it lives up to its potential, its owner will probably pay the renewal fees to continue with the legal monopoly over the invention; that is, such patents have a longer life. Moreover, the more countries the patent is filed in, the more widely the invention is translated and disseminated, which directly impacts public access and the consequent number of citations. Both techniques and predictive models are consistent with each other and with the existing literature, although the quantitative relationship among the three factors of citation, family size and renewal has not been explored in the literature within a predictive framework, to the best of the authors’ knowledge. The relationship between citations (whose contribution to patent value has been repeatedly demonstrated in the literature) and the number of family members and renewals points towards a plausible interrelation among these three components in what might be understood as a wide notion of patent value.
Funding
This study was financed in part by the Coordenação de Aperfeiçoamento de Pessoal de Nível Superior (Capes) - Brazil.
Research data
CATIVELLI, A. S.; MAÑANA-RODRÍGUEZ, J.; LASCURAIN SANCHEZ, M. L. Brazilian Green Patents. Figshare. Dataset. https://doi.org/10.6084/m9.figshare.13221593.v1
References
Baron, J.; Delcamp, H. The private and social value of patents in discrete and cumulative innovation. Scientometrics, Hoboken, v. 90, n. 2, p. 581-606, 2012.
BESSEN, J. The value of U.S. patents by owner and patent characteristics. Research Policy, [s.l.] v. 37, n. 5, p. 932-945, 2008.
DENG, Y. Private value of European patents. European Economic Review, [s.l.], v. 51, n. 7, p. 1785-1812, 2007.
Clarivate. Web of Science platform: Derwent Innovations Index. Clarivate. 2020.
ERCAN, S.; KAYAKUTLU, G. Patent value analysis using support vector machines. Soft Computing, [s.l.], v. 18, n. 2, p. 313-328, 2014.
FISCHER, T.; LEIDINGER, J. Testing patent value indicators on directly observed patent value - An empirical analysis of Ocean Tomo patent auctions. Research Policy, [s.l.], v. 43, n. 3, p. 519-529, 2014.
HAN, E. J.; SOHN, S. Y. Patent valuation based on text mining and survival analysis. The Journal of Technology Transfer, [s.l.], v. 40, n. 5, p. 821-839, 2015.
HAUGHTON, D.; OULABI, S. Direct marketing modeling with CART and CHAID. Journal of Direct Marketing, [s.l.], v. 11, n. 4, p. 42-52, 1997.
LEE, J.; SOHN, S. What makes the first forward citation of a patent occur earlier? Scientometrics, Budapest, Hungary v. 113, n. 1, p. 279-298, 2017.
LEMLEY, M.; MYHRVOLD, N. How to make a patent market. Hofstra Law Review, Hempstead, New York, v. 36, 257-259, 2008.
MARTINEZ, C. Insight into different types of patent families. OECD Science, Technology and Industry Working Papers, No. 2010/02, OECD Publishing, Paris, 2010.
NI, J. et al. Valuation of pharmaceutical patents: a comprehensive analytical framework based on technological, commercial, and legal factors. Journal of Pharmaceutical Innovation, [s.l.], v. 10, n. 3, p. 281-285, 2015.
OECD. Patent Statistics Manual. Paris: OECD, 2009.
OMPI. Módulo 7: Patentes. In: OMPI. General Course on Intellectual Property at a Distance. Switzerland: OMPI, 2014.
VAN POTTELSBERGHE DE LA POTTERIE, B.; VAN ZEEBROECK, N. A brief history of space and time: the scope-year index as a patent value indicator based on families and renewals. Scientometrics, Hoboken, v. 75, n. 2, p. 319-338, 2008.
SAPSALIS, E.; VAN POTTELSBERGHE DE LA POTTERIE, B.; NAVON, R. Academic versus industry patenting: An in-depth analysis of what determines patent value. Research Policy, [s.l.], v. 35, n. 10, p. 1631-1645, 2006.
SCHUMPETER, J. A. Teoria do desenvolvimento econômico. São Paulo: Nova Cultura, 1997.
STEVENS, G. A.; BURLEY, J. 3,000 Raw Ideas Equal 1 Commercial Success! Research Technology Management, England & Wales, v. 40, n. 3, p. 16-27, 1997.
YANG, G. et al. Using the comprehensive patent citation network (CPC) to evaluate patent value. Scientometrics, Hoboken,v. 105, n. 3, p. 1319-1346, 2015.
Notas de autor
adrianacativelli@gmail.com
ORCID https://orcid.org/0000-0001-8533-2263
jmanana@pa.uc3m.es
ORCID https://orcid.org/0000-0002-0717-5271
mlascura@bib.uc3m.es
ORCID https://orcid.org/0000-0001-9023-4967
Información adicional
Como citar:: CATIVELLI, Adriana Stefani; MAÑANA RODRIGUEZ, Jorge; LASCURAIN SANCHEZ, Maria Luisa. Brazilian green patents: behavior of inventions that receive the highest number of citations. Em Questão, Porto Alegre, v. 28, n. 2, e-116098, abr./jun. 2022.
Declaração de autoria: Concepção e elaboração do estudo: Adriana Stefani Cativelli, Jorge Mañana Rodriguez, Maria Luisa Lascurain Sanchez. Coleta de dados: Adriana Stefani Cativelli. Análise e interpretação de dados: Adriana Stefani Cativelli, Jorge Mañana Rodriguez. Redação: Adriana Stefani Cativelli, Jorge Mañana Rodriguez. Revisão crítica do manuscrito: Adriana Stefani Cativelli, Jorge Mañana. Rodriguez, Maria Luisa Lascurain Sanchez.