
This work is licensed under Creative Commons Attribution-NonCommercial-ShareAlike 4.0 International.
Received: 24 May 2018
Accepted: 01 January 2019
Abstract:
Objective: Competitive performance between brands can be gauged by perceptual consumer indicators. The lack of a reference regarding this performance can hinder the establishment of real goals by marketing managers. This study aimed to compare product and service brand performance measured by consumer-based brand equity, thus revealing patterns for benchmarking. Specifically, the research detected the most differentiating metrics, validating a general indicator, showing the performance patterns, and comparing international with national brands.
Method: In a cross-sectional study, 1,710 consumers evaluated six metrics of a consumer-based brand equity scale (awareness, associated image, perceived quality, loyalty, willingness to pay a premium price, and exclusivity) revalidated using confirmatory factor analysis. The study used 61 brands of 11 products and services to measure performance with univariate and multivariate analyses of variance.
Results: The results for the consumers show that: (1) brands varied more strongly in the awareness and perceived quality metrics, (2) few brands exceed one standard deviation above the category’s average performance, (3) some categories do not have brands that exceed one standard deviation above the category’s average performance, and (4) international brands are generally perceived as having greater value than national brands.
Theoretical/methodological contributions: The research gauges brand performance in the absence of accounting and market indicators using a research instrument.
Relevance/Originality: The article offers the factorial revalidation of a consumer-based brand equity scale and a benchmark of perceived brand performance using that scale.
Implications for management: The research helps in setting goals in marketing and their monitoring.
Keywords: Brand performance, Brand equity, Benchmark, Goal setting.
Resumo:
Objetivo: O desempenho competitivo entre marcas pode ser aferido por indicadores perceptivos dos consumidores. A falta de referência sobre esse desempenho pode prejudicar o estabelecimento de metas reais por gestores de marketing. A pesquisa objetivou comparar o desempenho de marcas de produtos e serviços baseado no valor percebido pelo consumidor, demonstrando padrões para referências. Especificamente detectaram-se as métricas mais discriminativas, validação de um indicador geral, mostra o padrão do desempenho e a comparação entre marcas internacionalizadas versus nacionais.
Método: Com corte transversal, 1.710 consumidores avaliaram seis métricas de uma escala de valor da marca baseado no consumidor (conhecimento, imagem associada, qualidade percebida, lealdade, disposição a pagar preço premium e exclusividade) revalidada com análise fatorial confirmatória. Aferiram-se 61 marcas de 11 produtos/serviços com análises de variância univariada e multivariada.
Resultados: Os resultados junto aos consumidores demonstram que (1) as discriminações oorreram principalmente nas métricas de conhecimento e qualidade percebida, (2) poucas marcas ultrapassam um desvio padrão acima da média do desempenho na categoria, (3) algumas categorias não apresentam marcas que ultrapassam um desvio padrão da média do desempenho na categoria, e (4) as marcas internacionais geralmente são percebidas com maior valor do que as marcas nacionais.
Contribuições teóricas/metodológicas: A pesquisa afere o desempenho da marca na ausência dos indicadores contábeis e de mercado por meio de um instrumento de pesquisa.
Relevância/originalidade: O artigo oferece a revalidação fatorial de um instrumento de Consumer- based brand equity e um benchmark de desempenho percebido de marcas por meio desse instrumento.
Implicações para a gestão: A pesquisa auxilia o estabelecimento de metas em marketing e seu monitoramento.
Palavras-chave: Desempenho de marca, Valor da marca, Benchmark, Estabelecimento de meta.
1 Introduction
The theories regarding brand performance are at advanced stages of knowledge. At the company level, many of them are based on the marketing productivity stages of Rust, Ambler, Carpenter, Kumar, and Srivastava (2004), complemented and updated by Katsikeas, Morgan, Leonidou, and Hult (2016), in which there are cause and effect relationships between the firm’s marketing actions and its results (Fischer & Himme, 2017; Hanssens & Pauwels, 2016). Performances are gauged by indicators of consumer mentality, of market competitiveness, and of the finances of the firm the brand belongs to. The effects of marketing actions or investments over company competitiveness and financial indicators have been well documented in the literature (Fischer, Shin, & Hanssens, 2015; Porto & Foxall, 2019), as well as, to a lesser extent, the effects on metrics derived from consumers (Srinivasan, 2015).
At the product level, Ehrenberg’s (1969) brand performance model, detailed in Ehrenberg, Uncles, and Goodhardt (2004) and updated by Singh and Uncles (2016), is perhaps the most recognized. It proposes that it is only necessary to identify the behavioral loyalty rate, the brand size and the switching rate in order to reveal brand performance (market share) (Jung, Zhu, & Gruca, 2016). Perceptual consumer indicators (customer mindset metrics - Srinivasan, 2015) are thus ignored. Indicators based on the perceptions of the public receiving the marketing actions have been shown to be complementary in understanding both market share predictors and buying behavior because they capture consumers’ experiences (Murphy & Dweck, 2016; Porto & Oliveira-Castro, 2015).
One of the main performance measures that use public perception is consumer-based brand equity (CBBE). This construct is the added value given to the product by the brand (Christodoulides, 2015). One of the limitations of relating its indicators with objective transaction metrics (e.g. market share) at the products and services level is due to the CBBE scales commonly used in the research. Those that enable the CBBE dimensions to be captured for all brands that compose a category in the same research instrument for the same consumer are rare. This is necessary so that there is a brand versus brand comparison and so that the values of each metric can be associated with the objective metrics.
Porto (2018) developed and validated a CBBE scale. It has allowed for the performance of various brands that compose a category to be gauged by consumer perceptions and it can be used both as a variable of effect on the consumer (Davcik, Vinhas da Silva, & Hair, 2015; Porto & Soyer, 2018; Porto & Dias, 2018) and as a cause of brand performance (Davcik et al, 2015; Porto & Carvalho, 2015; Porto & Lima, 2015). However, evidence is still needed on how the scale behaves to provide a performance pattern. This study aims to compare product and service brand performance based on consumer-based brand equity, revealing patterns for benchmarking.
Gauging brand performance via product and service consumer perceptions can reveal some intriguing consumer relationships, such as whether consumers attribute a higher value to product or service brands (Christodoulides & De Chernatony, 2010; Porto, 2018), which brand equity (CBBE) metrics differentiate brand consumers the most (Mühlbacher, Raies, Grohs, & Koll, 2016), whether there is any brand performance pattern among different categories (Singh & Uncles, 2016; Stocchi & Fuller, 2017), or whether consumers attribute a higher value to international or national brands (Romaniuk, Dawes, & Nenycz-Thiel, 2018; Zhuang, Wang, Zhou, & Zhou, 2008).
In light of the above, this study specifically aimed to: (1) identify which brand equity metrics most differentiate the percieved performance result between brands, (2) provide a general indicator to monitor the result of that performance, (3) detect performance result patterns among product and service categories, and (4) compare the perceptions of consumers regarding the origin of internationalized product and service brands versus national ones.
It is hoped that this study may shed light on the comparison of different consumer perceptions of brand equity, thus contributing empirically to generalizations in marketing and the establishment of more realistic marketing goals. Managers could use these metrics to monitor the performance results of brands that are managerially responsible, even in categories that lack consolidated data derived from objective (transactional) metrics.
2. Performance in the market for setting marketing goals
Setting marketing goals or objectives is a task that is often carried out by managers in their marketing plans (McDonald & Wilson, 2016). This activity fundamentally depends on the managers’ ability to allocate real objectives, generally derived from the way brands grow, become successful in the market, and are sustained (Sharp, 2016). The market share indicator has been the main metric of marketing objectives (Edeling & Himme, 2018). According to Porto and Oliveira-Castro (2015), its predictors are derived from both brand factors that managers can control when applied to the product (brand manageability) and brand factors derived from consumer experiences (brand past attractiveness). The aspects of brand equity help create the context of brand competition, providing the market structure of brands. Hanssens and Pauwels (2016) warn of the multiplicity of marketing objectives in marketing practices, where there is particular difficulty in counterbalancing between conflicting objectives, which can sometimes derive from different causes (Porto & Melo, 2016).
Goal setting depends on detecting brand performance and its projections and trends in the near future (McDonald & Wilson, 2016). For this, capturing metrics that gauge the performance and reliability of these measures is crucial in order not to lose focus on where the brand must go. Brand performance is a measure of relative success in a market (O'Cass & Ngo, 2007). Specifically, it is a comparison between brands belonging to the same category or of the same brand within a category over time, using metrics that evaluate relationships between corporate actions relating to products or services and their effects.
These effects can be gauged by competitiveness metrics [e.g. market share and penetration (Ehrenberg et al., 2004; Jung, Zhu, & Gruca, 2016)], company accounting metrics [e.g. revenues, profit margins (Mizik, 2014)], financial market metrics [e.g. value of intangible assets, sales value of product portfolio (Davcik et al., 2015; Voss & Mohan, 2016)], and metrics of effect on consumers [e.g. loyalty, price paid (Baalbaki & Guzmán, 2016)]. The latter can be subdivided into behavioral metrics (e.g. buying rates, frequency of use) or perception metrics (e.g. perceived quality or level of awareness).
The behavioral and perceptual metrics complement each other in explaining the entire impact of company marketing actions on consumers. Thus, any marketing activity of a brand is able to simultaneously stimulate two responses among consumers (Foxall, 2005; Vella & Foxall, 2011): one of these responses relates to economic exchange (revealed buying behavior) and the other relates to the individual experience (covert or perceptual behavior). The latter derives from the consumer’s ability to obtain experience via learning with brands (Porto & Oliveira-Castro, 2015). The first contact with a new brand launched can be the start of an experience with the object that may or may not last and it is perceived by the consumer.
The perceived brand performance studies use consumer-based brand equity scales. Some central points of these studies (Baalbaki & Guzmán, 2016; Christodoulides & De Chernatony, 2010; Huang & Sarigöllü, 2014; Keller, 2016) can be listed: (1) the identification of which metrics compose brand equity for the consumer, (2) the object relating to the equity (whether a product, service, company, or country), (3) its predictive or explanatory capacity in competitive performance, accounting, and financial market indicators, and (4) the research instrument capable of being parsimonious in capturing all its relevant dimensions.
Thus, questions regarding the composition of the brand equity instrument are crucial for revealing its capacity to gauge brand performance from a perceptual viewpoint. The measurement instrument needs to cover a wide range of metrics that allows for various brands from the same category to be simultaneously compared, which detects which of the metrics has the greatest effect on the “consumer-based brand equity” construct, and which enables the detection of patterns and idiosyncrasies among brands from the same category (Tybout & Calder, 2010).
3. Composition of the consumer-based brand equity measures
Consumer-based brand equity is a set of perceptual metrics that capture the consumer experiences related to brands and how they receive their marketing actions (Villarejo-Ramos & Sanchez-Franco, 2005; Yoo, Donthu, & Lee, 2000). Via consumer mentality metrics (Mizik, 2014; Srinivasan, 2015), they capture the brands that can provide more benefits (symbolic – status, fulfillment) to consumers (Foxall, 2005; Porto & Oliveira-Castro, 2015) and that, at the same time, can lead to positive results for the company through the commercialization of the brand in the market (Davcik et al., 2015).
Some typical brand equity measures are how well known the brand is, associated images, perceived qualities, the loyalty rates of each one, willingness to pay a premium price, and its exclusivities (Aaker, 1996; Davcick et al., 2015; Keller, 2016; Keller & Lehmann, 2006). Together they form the brand equity construct based on consumer perceptions (Aaker, 1996; Porto, 2018).
Familiarity with the brand (brand awareness) is the most basic requirement for evaluating consumer-based brand equity (Aaker, 1996). In general, it is initially stimulated by advertising and promoting the brand (Keller, 2016; Villarejo-Ramos & Sanchez-Franco, 2005; Yoo et al., 2000). When it is available at sales points (Huang & Sarigöllü, 2014), many consumers can acquire it and, thus, social situations (media, friends, or relatives) can spread the brand more, making it more familiar and more important to the consumer. If it is an admired and global brand (Steenkamp, 2017), then it is necessarily a very well-known brand and, therefore, accessible in people’s memories.
Perceived quality is perhaps the most important metric for evaluating brand equity (Keller, 2001) if the consumer has had a reasonably in-depth experience with at least one brand from the same category. This occurs primarily through use (Oliveira-Castro, Foxall, Yan, & Wells, 2011) and verifying the attributes of the product or service (Zeithaml, 1988). Generally, the consumer verifies whether the product has accomplished what it was meant to, whether it is made of good material, whether the customer service is attentive, whether the service provider is competent, etc. Thus, reasonably experienced consumers are able to gauge quality from having seen the brand’s usefulness when in use; that is, they verified that the brand accomplished what it was meant to do.
Associated images are the association networks in the memory of positive and/or negative images (Keller, 2016; Krishnan, 1996; Porto & Dias, 2018). When that image is positive it shows that the brand has a good reputation and attractiveness; on the other hand, if it is negative, it has a bad reputation, and is an aversive stimulus, driving the consumer away. Specific associations are due to the experiences each consumer has with the brand, but owe a lot to the information conveyed by advertising campaigns in the mass media and to word-of-mouth (Aaker & Biel, 2013; Villarejo-Ramos & Sanchez-Franco, 2005; Yoo et al., 2000). Exposure and, especially, the interpretation of the advertising content or of the messages of other consumers regarding brands helps in associating a new piece of information with the consumer’s previous experiences with the product as a whole.
In turn, brand loyalty is a metric that represents the brand choice preference in situations where the consumer needs to buy some brand from the category again (Ehrenberg et al., 2004; Porto, 2018). As most products and services have an expiry date (Theotokis, Pramatari, & Tsiros, 2012), loyalty has become a common measure of brand equity because the consumer needs to replace their stock quite often, leading to repurchase. However, the attitudinal loyalty aspect (liking, intentions) has been used more than behavioral loyalty (purchase frequency, observed repeat purchases) in the most widely used CBBE instruments (Soedarto, Kurniawan, & Sunarsono, 2019). Brand loyalty rates derive from the buying or use experience itself and also from the good development of customer relationship programs (Soltani & Navimipour, 2016), which can provide the consumers with more benefits.
The exclusivity metric of brand equity refers to the degree of rarity of the offer and/or personalization that the brand offers the consumer (Keller 2016; Netemeyer et al., 2004; Zhan & He, 2012). Brands perceived as exclusive may bring differentiating and singular aspects to their user. Luxury brands are generally characterized as exclusive (Hudders, Pandelaere, & Vyncke, 2013). This is because they are offered to a small, generally high-income public, and may even be made on demand (Hamann, Williams Jr, & Omar, 2007). Therefore, controlled access to the brand added to its customization is an important characteristic in creating exclusivity.
And, finally, when a consumer is willing to pay a premium price, they judge a brand to be more expensive than another or its cost to be higher than that of others due to some utilitarian or symbolic characteristic of the product or service (Netemeyer et al., 2004; Sethuraman & Cole, 1999). Depending on the pricing strategy adopted by the brand, consumers can decide that one is worth more than another. In this case, the consumer indicates that the excess can be reduced in favor of the company and that the brand with a higher premium price is a Veblen brand (Skouras, Avlonitis, & Indounas, 2005). Greater willingness to pay a premium price is generally associated with the appearance of quality and can also be associated with ostentatious consumption (Ko, Costello, & Taylor, 2019).
Despite some researchers suggesting that loyalty and willingness to pay a premium price are a result of CBBE (Rodrigues & Martins, 2016), this author proposes that the construct be composed of these metrics, with alterations in the wording of the items that compose the indicators. The problems in the loyalty measures in CBBE instruments derive from their attitudinal conception, typically used in the CBBE instruments (Yoo & Donthu, 2001). It is often correlated with other measures that compose the construct (Christodoulides, Cadogan, & Veloutsou, 2015). By altering to the behavioral dimension this problem can cease to exist, or minimize that correlation. Futhermore, willingness to pay a premium price is a construct that derives from the consumer’s experiences generating inclinations, but nonetheless is not a transactional result (objective metric) of the brand (Farris, Bendle, Pfeifer, & Reibstein, 2015). The consumer has not yet paid more for the brand when they report their willingness, and it is therefore still a mindset metric.
Every brand can have a mix of different weights between the indicators that compose CBBE. However, there may be a brand performance pattern among categories. For a moment, in each category, there is a brand that stands out in relation to the rest and, when verifying various categories, a small quantity of brands can emerge that stand out positively with regard to their consumer value. By revealing a response pattern for CBBE, the manager can inprove the establishment of marketing goals (McDonald & Wilson, 2016), by elaborating them in a more realistic way (Locke & Latham, 1990; Shane & Delmar, 2004).
Thus, there could be a comparative benchmark of brand performance with other market and financial performance indicators (Kumar, 2018; Hanssens & Pauwels, 2016). Unfortunately, managerial practice has been based on manager empricism or normative rules that lack proof in scientific research. The present study provides a benchmark regarding the performance of consumer-based brand equity, opening up a path toward bringing the scientific knowledge closer to marketing goal practices.
4. Method
The research was cross-sectional, covering 1,710 consumers who evaluated the value of 61 brands from 11 categories, including 7 products (female sanitary towels, mouthwash, games console, shaving device, cream cheese, gourmet popcorn, and ream of A4 paper) and 4 services (gas station brand, cinema – chain, internet provider, and air travel – airline). The sample of brands was composed of categories that covered products – durable and non-durable consumer goods – and services – online and offline. All the categories needed to have at least three competing brands for comparative purposes.
Of all these consumers, 51% were women, composed mainly (82%) of residents of the Federal Disctrict of Brazil, 98% changed the internet provider at least once in 10 years, 88.2% bought at least one air ticket in a year, 86.7% fill the fuel tank of their main vehicle at least once a month, 72.5% went to the cinema at least once, 81.3% acquired at least one games console in 10 years, 58.3% bought at least one ream of 500 sheets of A4 in 3 months, 82.4% acquired at least once shaving (hair removal) device over 2 years, 59.2% acquired at least one 8-unit box of female sanitary towals in 6 months, 78.0% bought at least one 250 ml mouthwash in a month, 86.7% bought at least one 150 gram unit of cream cheese in two months, and 40.7% bought at least one 100 gram packet of gourmet popcorn in a year.
With the research data, the brands with the greatest market penetration (consumers who bought the brand at least once during the period indicated in the study divided by the total consumers investigated) were: BR Gas Station (89.3%), Cinemark cinema (83.8%), and Gillette shaving device (78.6%). Some brands came close to 1% market penetration (e.g. Ink ream of A4 paper = 0.6% and LF = 1.2%).
For each product or service category the sampling power test was calculated (Faul, Erdfelder, Buchner, & Lang, 2009). With effect size f.(Pilai V) = 0.06, alpha error probability of 0.05, for the 11 categories with the 6 metrics as dependent variables for the multiple analysis of variance, the sampling power was in the order of 98.34% (critical F value of 1.33). That is more than enough to reduce the chances of the Type 2 error occurring.
This study used the consumer-based brand equity measurement instrument, validaded by Porto (2018), which contains six metrics: awareness, associated image, perceived quallity, loyalty, willingness to pay a premium price, and exclusivity. All the metrics were adapted to the categories of the products and services analyzed and only the associated image metric was modified to represent the gradation of image (very negative to very positive) as a five-point Likert-type scale. For all the metrics, after each question, a list containing all the brands (and the answer scales) of each product/service was displayed on the questionnaire. The scale can be seen in Figure 1.
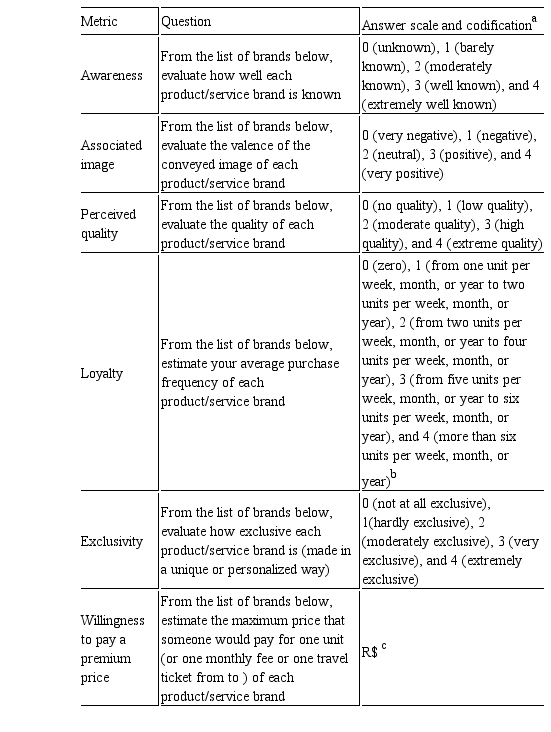
Example: From the list of brands below, evaluate how well known each brand of air transport is:
Consumer-based brand equity research instrument.
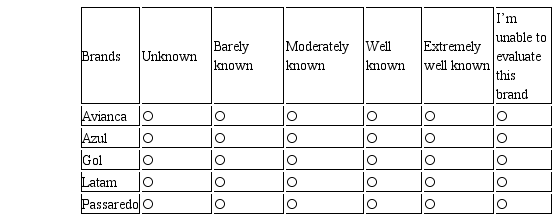
a The names of the brands were arranged as items to be evaluated in alphabetical order and if the respondent was unable to evaluate a particular brand the option was given to click on: I’m unable to evaluate this brand.b This scale needs to be customized for each product/service.c This scale was configured so that the respondent could only put positive numerical values or zero. Source: own authorship
The data collection occurred between the months of October and November of 2016. The questionnaire was made available virtually on an online platform and disclosed on social networks and messaging apps in Brazil. On average, each respondent took 5 minutes (standard deviation = 2.2) to complete the whole questionnaire for one product/service. Note that the consumers did not answer for all the categories and, consequently, all the brands.
The description of the metrics of this study, arithmetic mean, and standard deviation (S.D.) enable it to be verified that the consumers tended to take a moderate position in each metric, with the exception of loyalty, which had a low index. The awareness (known brand) metric presented a mean of 2.28 (S.D. = 0.9), the perceived quality metric presented a mean of
2.66 (S.D. = 0.7), the associated image metric presented a mean of 2.77 (S.D. = 0.6), the loyalty metric presented a mean of 0.60 (S.D. = 0.6), the exclusivity metric presented a mean of 1.69 (S.D. = 1.0), and the willingness to pay a premium price metric presented a mean of R$ 108.49 (S.D. = 344.1).
All the measures were relativized (divided by the mean value of the metric for the category). Next, each indicator was standardized in order to place all the indicators in the same order of greatness. For a value equal to zero, the metric was equal to the mean for the category. Values below zero (above zero) were below the mean (above the mean). All the data analyses were carried out after this transformation.
For the analysis procedure, the database was initially restructured (lines versus columns). After the standardization transformations, the metrics had an asymptotic normal distribution (Kolmogorov-Smirnov p > 0.05) and all of them were included in the analyses. The Levene’s Test was not significant (p > 0.05). Some analyses were conducted to show the brand’s performance in order to detect response patterns.
Initially, as much as a previously validated scale has been used (Porto, 2018), the decision was made to validate it again using confirmatory factor analysis (CFA) due to the modification of one of the metrics (associated image). This was followed by a multiple analysis of variance (MANOVA) using the six brand equity metrics as dependent and the brands as an independent variable. Next, a univariate analysis of variance was carried out with the general consumer- based brand equity score as dependent and the brands as independent variables. This analysis was subdivided for each product or service category. Finally, as a final analysis, a univariate analysis of variance was conducted, using the general consumer-based brand equity score as dependent and the brand origin and product typology as independent variables, with an interactive effects test.
5. Result
5.1 Confirmatory factor revalidation of the CBBE scale of products and services
Using the maximum likelihood estimation, a chi-square of 479.39 was obtained (9 degrees of freedom; p ≤ 0.01). The model exhibited a very good fit (GFI = 0.97; AGFI = 0.93; CFI = 0.94; TLI = 0.94; RMSEA = 0.80; SRMR = 0.05).
The model was unifactorial, with good composite reliability (CR = 0.85) and an acceptable average variance extracted (AVE = 0.50). The model with the factor loading of each metric to compose the “consumer-based brand equity” factor can be seen in Figure 2. It is observed that perceived quality was the metric with the greatest representativeness in the construct (factor loading = 0.83) and that the modified metric (associated image) also obtained a good factor loading (factor loading = 0.81), better than the previous validation process of Porto (2018). The next step was to detect the performance of each metric.
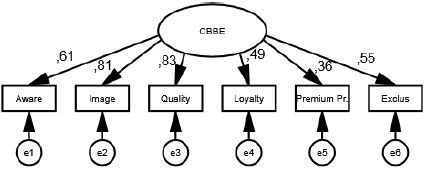
Figure 2
Factorial structure of consumer-based brand equity
Source: own authorship
5.2 Performance in each brand equity metric
The result of the multiple analysis of variance containing the six brand equity metrics as dependent and the brands as an independent variable showed that there was a significant difference between the brands for all the metrics [F (360.30400) = 13.65; p ≤ 0.01; Wilks’ Lambda = 0.41]. Table 1 shows the F test for each dependent variable and the partial eta squared. It is observed that the metric with the biggest effect size (eta squared) was that of brand awareness, followed by perceived quality. The effect size indicates how much the product and service brands help to predict the values of each one of the CBBE measures; in other words, how much the brands are differentiated in each measure.
Test of effects among brands with each brand equity metric
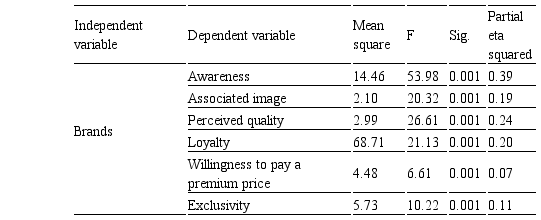
Source: own authorship
The Tukey test showed the differences between the brands. The “Chamex” brand of reams of A4 paper obtained the highest estimated mean for brand awareness (M = 2.73; S.E. = 0.05), brand loyalty (M = 4.39; S.E. = 0.18), and brand exclusivity (M = 1.81; S.E. = 0.07) metrics. The “Gillette” shaver brand obtained the highest estimated mean in the associated image (M = 1.33; S.E. = 0.03), perceived quality (M = 1.44; S.E. = 0.03), and willingness to pay a premium price (M = 1.96; S.E. = 0.07) metrics.
In contrast, the Auto Lu’s gas station brand obtained the lowest estimated mean in the brand awareness (M = 0.16; S.E. = 0.08), brand loyalty (M = 0.03; S.E. = 0.28), brand exclusivity (M = 0.27; S.E. = 0.12), associated image (M = 0.50; S.E. = 0.05), and perceived quality (M = 0.32; S.E. = 0.05) metrics. The air transport brand “Passaredo” obtained the lowest mean for willingness to pay a premium price (M = 0.63; S.E. = 0.12).
5.3 Performance in the general brand equity indicator
Initially, there followed the creation of a standardized score of brand equity with all the metrics of the study. The result of the univariate analysis of variance containing the general brand equity indicator as dependent and the brands as independent showed that there is a significant difference between these variables [F (60.5092) = 40.18; p ≤ 0,01; eta squared = 32.1%]. Table 2 shows the estimated mean and the standard error for all the brands separated by category. It is observed that the “Chamex” brand obtained the highest mean and the “Auto Lu’s” brand obtained the lowest mean.
Mean standard error and confidence interval in the general brand equity indicator
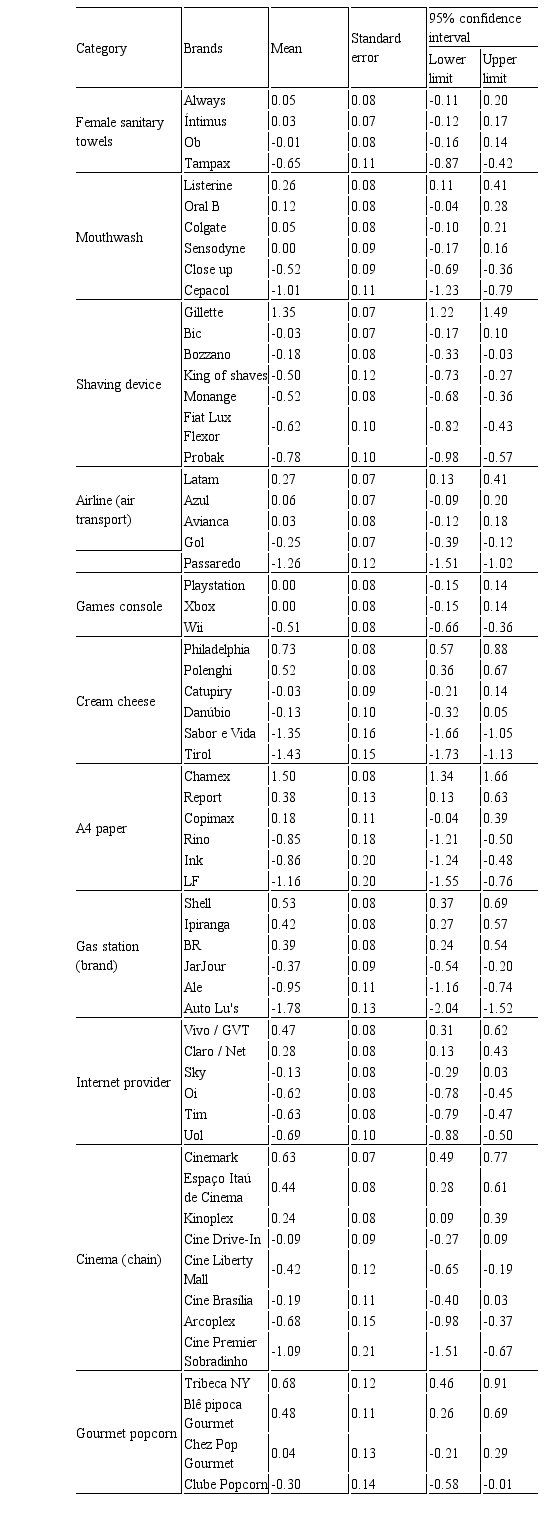
Source: own authorship
The results can be seen in Figure 3 and Figure 4. It is perceived that rarely does any exceed one positive standard deviation (value higher than 1) and few brands exceed one negative standard deviation (value lower than -1). But in all the categories there is a discrepancy between the brands, indicating that they do not have the same equity. Thus, it seems to be hard to achieve a high brand equity index in all the metrics that is able to abruptly differentiate one brand from others from the same category.
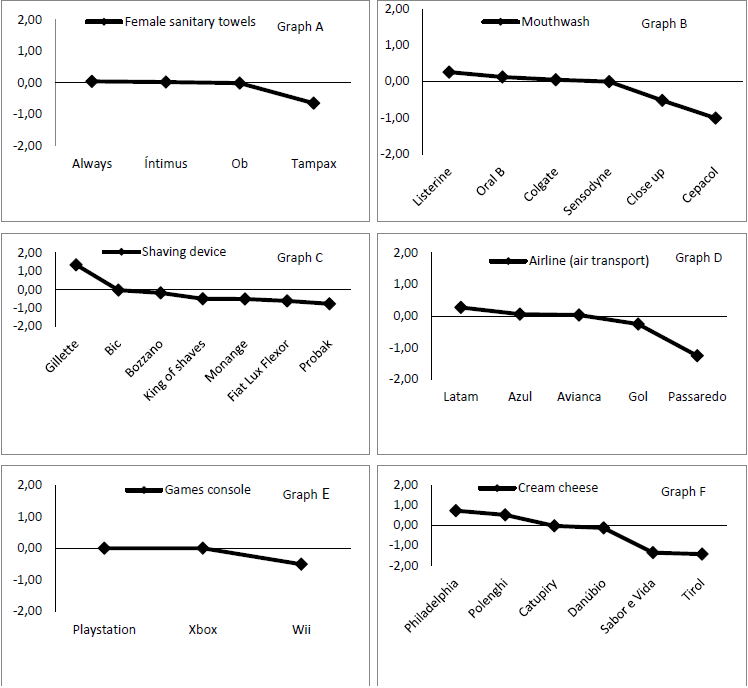
Figure 3
Graphs of the brands in the general brand equity indicator for the female sanitary towels (Graph A), mouthwash (Graph B), shaving device (Graph C), air transport (Graph D), games console (Graph E), and cream cheese (Graph F) products.
Source: own authorship
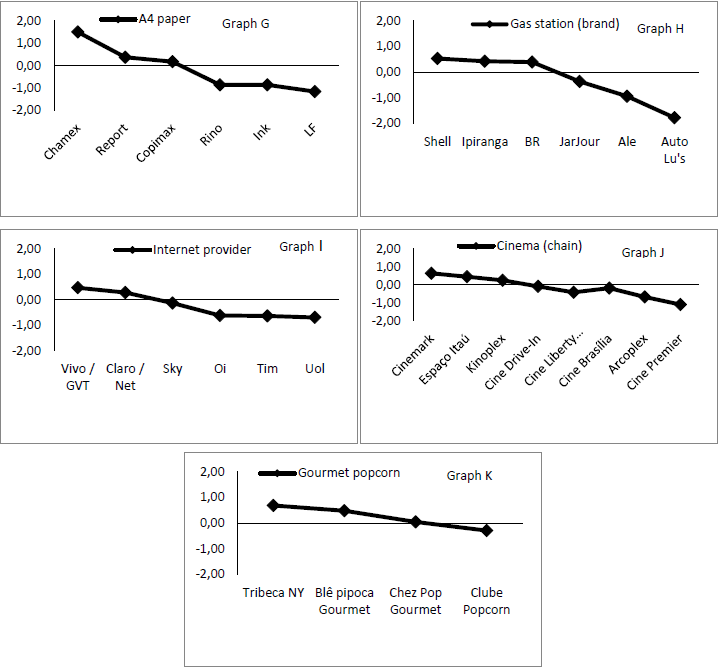
Figure 4
Graphs of the brands in the general brand equity indicator for the ream of A4 paper (Graph G), gas station (Graph H), internet provider (Graph I), cinema (Graph J), and gourmet popcorn (Graph K) products.
Source: own authorship
5.4 Effect of brand origin on consumer-based brand equity
The result of the univariate analysis of variance containing the product typology (product vs. service) and brand origin (international vs. national brands) as independent and the general brand equity score as dependent showed that there is a significant relationship only between brand origin and the general brand equity indicator [F (1.5149) = 94.45; p ≤ 0.01; eta squared = 2%]. Product typology did not present a significant result (p > 0.05). Table 3 shows the effects of both independent variables on brand equity.
Effects of product typology and brand origin on the general brand equity indicator
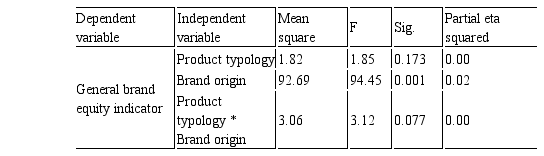
Source: own authorship
Graph L (Figure 5) shows the difference between the marginal estimated means of this analysis. It is perceived that international brands, whether product (M = 0.09; S.E. = 0.02) or service (M = 0.19; S.E. = 0.04), have a higher mean than the brands of national products (M = - 0.14; S.E. = 0.03) or services (M = - 0.15; S.E. = 0.03).
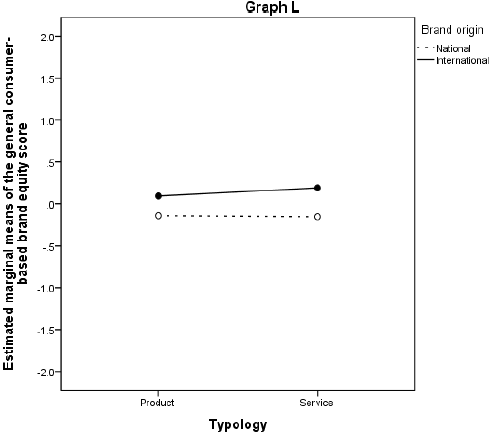
Figure 5
Graph of the effect of brand origin and product typology over the general brand equity indicator
Source: own authorship
6. Discussion
On the whole, the study shows the performance of brands in product and service categories using a brand equity scale based on consumer perceptions (Aaker, 1996; Christodoulides & De Chernatony, 2010; Jung et al., 2016; Keller, 2016; Murphy & Dweck, 2016; Porto & Oliveira-Castro, 2015). The Porto (2018) scale was factorially revalidated, presenting good indicators, even with alterations of the associated image measure. This measure is more intuitive for estimating the image’s valence, which meets the aims of having a brand that is more highly valued by a particular public (Keller, 2016). In addition, even with an alteration of the categories and brands analyzed, perceived quality continues to be the main metric of the CBBE construct, as previously demonstrated in the study of Porto (2018). With that, this study reveals robustness of the scale for use by marketing researchers.
The research offers evidence that brands vary more intensely in the awareness and perceived quality metrics, which indicates that within the same category, they are the ones responsible for the greatest differentiation on the part of consumers (Mühlbacher et al., 2016). For the awareness metric, this may occur due to investments in advertising or promotions geared toward making the brand more recognized in the market. As some brands invest much larger amounts than others in advertising campaigns, the brand recognition reactions by the public are disproportionately greater for those that invest more (Steenkamp, 2017). Complementarily, brands with the greatest technical quality generally have higher amounts to spend, which benefits them in the generation of greater recognition (Bagwell, 2007).
However, perceived quality derives from the (product or service) offer itself and is often based both on its attributes (Oliveira-Castro et al., 2011; Zeithaml, 1988) and on previous experiences of use of the brands (Porto & Oliveira-Castro, 2015). Those that consumers buy and use generate utilitarian consequences (Foxall, 2005) and, simultaneously, by observing performance in use, they can certify that some brands have more or less quality.
Thus, managers who elaborate goals for these two indicators (Locke & Latham, 1990; McDonald & Wilson, 2016; Shane & Delmar, 2004), and actually achieve them, will be able to stand out from their competitors. This result may shed light on the reason managers often elaborate goals to increase the brand awareness (e.g. top of mind) and quality (Farris et al., 2015; Katsikeas et al., 2016) indicators. Achieving simultaneous goals with the performance indicators derived from CBBE can reveal complementarity and inhibit the establishment of conflicting objectives (Hanssens & Pauwels, 2016; Porto & Melo, 2016).
No significant difference in performance was found for product or service brands (Christodoulides & De Chernatony, 2010; Porto, 2018), but it was revealed that there is a brand performance pattern among the categories (Singh & Uncles, 2016; Stocchi & Fuller, 2017). When brand equity is compared with the mean equity for the category, it is perceived that it is hard for brands to exceed one standard deviation above the mean, whatever the category. Thus, when elaborating goals to achieve the brand equity indicators, as well as having to observe the sector mean for the indicator (Kumar, 2018), managers need to be careful not to exagerate when setting the equity threshold. Otherwise, it will be very easy for the goal not to be achieved. The study thus provides greater knowledge regarding managerial performance in marketing (Shane & Delmar, 2004), focusing on the establishment of goals. The research indicates that it is rare for a brand to have high performance (one standard deviation above the sector mean) and, even when this occurs, only one brand in the category achieves that maximum performance.
Another benchmark that the study presents relates to international brands. The research indicates that a solely national brand will have greater difficulty achieving the maximum level of the general brand equity score. Previous studies have already indicated that foreign brands are more highly valued than national ones (Chailan & Ille, 2012; Steenkamp, 2017). Thus, it is demonstrated that besides the national brands competing in an unequal situation in relation to multinational brands (Chailan & Ille, 2012; Romaniuk et al. 2018; Zhuang et al., 2008), they are also perceived as being of lower value. Therefore, the study corroborates with those findings and opposes the generalization that goals should be set with similar magnitude, whatever the brand origin.
7. Concluding remarks
The study compared the performance of product and service brands based on the consumer-based brand equity, showing patterns for benchmarking. It revealed which brand equity metrics differentiate the effect of performance between brands the most and, based on the general score, the study detected performance result patterns among product and service and brand origin categories. Managers and marketing researchers could use the research instrument applied in this study with the consumer-based brand equity metrics to monitor brand performance outcomes.
Specifically, by using this instrument it is possible for the manager to identify which of the brand equity indicators is below the mean for the sector they operate in and thus elaborate actions to leverage it. Moreover, goals of achieving below one positive standard deviation for the brand in a given fiscal year could be set, as few brands in rare categories manage to achieve that threshold. The manager, however, needs to be aware that if the brand is national it is harder to achieve ambitious goals due to the consumer valuing brands from their own country less, if the product is not characteristic of their country.
One of the limitations of the study is that it did not cover luxury products nor highly specialized services, which creates an opportunitiy for new research to investigate whether the metrics have the same pattern for such categories.
Moreover, the research did not verify marketing activities as a direct antecedent nor possible company consequences of equity perceptions. Hence, future research could clarify how this path occurs, putting into context the reason brands vary more intensely in the quality perception and awareness metrics.
Future studies could also clarify the reason few brands exceed one standard deviation above the mean of their category’s performance and why in some categories there are no brands that exceed one standard deviation from the mean of the category’s performance, Would this be due to the amount invested in marketing? In addition, what can managers do in order for brands belonging to national companies to be better perceived by the residents of the country themselves? Is there room to become as competitive as internationalized brands? It is hoped that the research instrument utilized here can be used more often to detect patterns of brand equity perceptions, thus helping create empirical generalizations in marketing, and that it is a useful instrument for managers to monitor the performance of their brands.
References
Aaker, D.A. (1996). Measuring brand equity across products and markets. California Management Review, 38(3), 102-120.
Aaker, D. A., & Biel, A. (2013). Brand equity & advertising: Advertising's role in building strong brands. New York: Psychology Press.
Baalbaki, S., & Guzmán, F. (2016). Consumer-based brand equity. In F. D. Riley, J. Singh, & C. Blankson (Eds.), The Routledge Companion to Contemporary Brand Management (pp. 32-47). London: Routledge.
Bagwell, k. (2007). The economic analysis of advertising. In R. Schmalensee, M. Armstrong, & R. Willig (Eds.), Handbook of Industrial Organization (v. 3, p. 1701-1844.). Oxford, Elsevier.
Chailan, C., & Ille, F. (2012). Brand strategies of firms from emerging economies. In M. A., Marinov, & S. T. Marinova (Eds.), Internationalization of Emerging Economies and Firms (pp. 320-342). New York: Palgrave Macmillan.
Christodoulides, G. (2015). Brand equity. In C. K. Cooper (Ed.), Wiley Encyclopedia of Management (v. 1, pp.1-2). Oxfordshire, Uk: Wiley Doi: 0.1002/9781118785317.weom090279
Christodoulides, G., Cadogan, J. W., & Veloutsou, C. (2015). Consumer-based brand equity measurement: Lessons learned from an international study. International Marketing Review, 32(3/4), 307-328. Doi: 10.1108/IMR10-2013-0242
Christodoulides, G., & De Chernatony, L. (2010). Consumer-based brand equity conceptualization and measurement: A literature review. International Journal of Research in Marketing, 52(1), 43-66. Doi: 10.2501/S1470785310201053
Davcik, N. S., Vinhas Da Silva, R., & Hair, J. F. (2015). Towards a unified theory of brand equity: Conceptualizations, taxonomy and avenues for future research. Journal of Product & Brand Management, 24(1), 3-17. Doi: 10.1108/JPBM-06-2014-0639
Edeling, A., & Himme, A. (2018). When does market share matter? New empirical generalizations from a meta-analysis of the market share–performance relationship. Journal of Marketing, 82(3), 1-24. Doi: 10.1509/jm.16.0250
Ehrenberg, A. S. (1969). Discovery and use of laws of marketing. Journal of Advertising Research, 9(2), 11-17.
Ehrenberg, A. S. C., Uncles, M. D., & Goodhardt, G. J. (2004). Understanding brand performance measures: Using Dirichlet benchmarks. Journal of Business Research, 57(12), 1307-1325. Doi: 10.1016/j.jbusres.2002.11.001
Farris, P., Bendle, N., Pfeifer, P., & Reibstein, D. (2015). Marketing metrics: The manager's guide to measuring marketing performance. New York: FT Press.
Faul, F., Erdfelder, E., Buchner, A., & Lang, A. G. (2009). Statistical power analyses using G* Power 3.1: Tests for correlation and regression analyses. Behavior Research methods, 41(4), 1149-1160. Doi: 10.3758/BRM.41.4.1149
Fischer, M., & Himme, A. (2017). The financial brand value chain: How brand investments contribute to the financial health of firms. International Journal of Research in Marketing, 34(1), 137-153. Doi: 10.1016/j.ijresmar.2016.05.004
Fischer, M., Shin, H. S., & Hanssens, D. M. (2015). Brand performance volatility from marketing spending. Management Science, 62(1), 197-215. Doi: 10.1287/mnsc.2014.2102
Foxall, G. (2005). Understanding consumer choice. New York: Springer.
Hamann, D., Williams Jr, R. L., & Omar, M. (2007). Branding strategy and consumer high- technology product. Journal of Product & Brand Management, 16(2), 98-111. Doi: 10.1108/10610420710739973
Hanssens, D. M., & Pauwels, K. H. (2016). Demonstrating the value of marketing. Journal of Marketing, 80(6), 173-190. Doi: 10.1509/jm.15.0417
Huang, R., & Sarigöllü, E. (2014). How brand awareness relates to market outcome, brand equity, and the marketing mix. In T. M. Choi, (Ed.), Fashion Branding and Consumer Behaviors (pp. 113-132). New York: Springer.
Hudders, L., Pandelaere, M., & Vyncke, P. (2013). Consumer meaning making: The meaning of luxury brands in a democratized luxury world. International Journal of Market Research, 55(3), 391-412. Doi: 10.2501/IJMR-2013-036
Jung, S., Zhu, J., & Gruca, T. S. (2016). A meta-analysis of correlations between market share and other brand performance metrics in FMCG markets. Journal of Business Research, 69(12), 5901-5908. Doi: 10.1016/j.jbusres.2016.04.106
Katsikeas, C. S., Morgan, N. A., Leonidou, L. C., & Hult, G. T. M. (2016). Assessing performance outcomes in marketing. Journal of Marketing, 80(2), 1-20. Doi: 10.1509/jm.15.0287
Keller, K. L. (2001). Building customer-based brand equity: A blueprint for creating strong brands. Cambridge (UK): Marketing Science Institute.
Keller, K. L. (2016). Reflections on customer-based brand equity: perspectives, progress, and priorities. AMS Review, 6(1-2), 1-16. Doi: 10.1007/s13162-016-0078-z
Keller, K. L., & Lehmann, D. R. (2006). Brands and branding: Research findings and future priorities. Marketing Science, 25(6), 740-759. Doi: 10.1287/mksc.1050.0153
Ko, E., Costello, J. P., & Taylor, C. R. (2019). What is a luxury brand? A new definition and review of the literature. Journal of Business Research, 99, 405-413.Doi: 10.1016/j.jbusres.2017.08.023
Krishnan, H. S. (1996). Characteristics of memory associations: A consumer-based brand equity perspective. International Journal of Research in Marketing, 13(4), 389-405. Doi: 10.1016/S0167-8116(96)00021-3
Kumar, P. V. (2018). A study on benchmarking practices in marketing - a drive to achieve organizational excellence. International Journal of Engineering Technology Science and Research, 5(1), 567-570.
Locke, E., & Latham, G. (1990). A theory of goal setting and task performance. Englewood Cliffs, NJ.: Prentice-Hall.
McDonald, M., & Wilson, H. (2016). Marketing Plans: How to prepare them, how to profit from them. Chichester, West Sussex: John Wiley & Sons.
Mizik, N. (2014). Assessing the total financial performance impact of brand equity with limited time-series data. Journal of Marketing Research, 51(6), 691-706. Doi: 10.1509/jmr.13.0431
Mühlbacher, H., Raies, K., Grohs, R., & Koll, O. (2016). Drivers of brand strength: Configural paths to strong cognitive brand equity. Journal of Business Research, 69(8), 2774-2780. Doi: 10.1016/j.jbusres.2015.11.013
Murphy, M. C., & Dweck, C. S. (2016). Mindsets shape consumer behavior. Journal of Consumer Psychology, 26(1), 127-136. Doi: 10.1016/j.jcps.2015.06.005
Netemeyer, R.G., Krishnan, B., Pullig, C., Wang, G., Yagci, M., Dean, D., Ricks, J., & Wirth, F. (2004). Developing and validating measures of facets of customer-based brand equity. Journal of Business Research, 57(2), 209-224. Doi: 10.1016/S0148- 2963(01)00303-4
O'cass, A., & Ngo, L. V. (2007). Balancing external adaptation and internal effectiveness: Achieving better brand performance. Journal of Business Research, 60(1), 11-20. Doi: 10.1016/j.jbusres.2006.08.003
Oliveira-Castro, J. M., Foxall, G. R., Yan, J., & Wells, V.K. (2011). A behavioral-economic analysis of the essential value of brands. Behavioural Processes, 87(1), 106-114. Doi: 10.1016/j.beproc.2011.01.007
Porto, R. B. (2018). Consumer-based brand equity of products and services: Assessing a measurement model with competing brands. Brazilian Journal of Marketing, 17(2), 150- 165. Doi: 10.5585/remark.v17i2.3547
Porto, R. B., & Carvalho, G. P. (2015). Dinâmica da participação de mercado durante o lançamento de novas marcas em produto de compra rotineira. Innovation & Management Review, 12(4), 205-231. Doi: 10.11606/rai.v12i4.102027
Porto, R. B., & Dias, L. G. (2018). Effectiveness of the positioning statement: Experimental test on brand awareness in competitive contexts. Revista Eletronica de Ciencia Administrativa, 17(1), 84-114. Doi: 10.21529/RECADM.2018004
Porto, R. B., & Foxall, G. R. (2019). The marketing firm as a metacontingency: revealing the mutual relationships between marketing and finance. Journal of Organizational Behavior Management, 39(3/4), 115-144. Doi: 10.1080/01608061.2019.1666774
Porto, R. B., & Lima, N. S. R. (2015). Nonlinear impact of the marketing mix on brand sales performance. Brazilian Business Review, 12(5), 57-77. Doi: 10.15728/bbr.2015.12.5.4
Porto, R. B., & Melo, L. B. (2016). Intensidade de propaganda e precificação como fontes geradoras dos conflitos entre desempenhos de marcas. Revista de Administração da UNIMEP, 14(1), 54-79. Doi: 10.15600/1679-5350/rau.v14n1p54-79
Porto, R.B., & Oliveira-Castro, J. M. (2015). Consumer purchase and brand performance. In G. Foxall, (Ed.), The Routledge Companion to Consumer Behavior Analysis (pp. 175-201). New York: Routledge.
Porto, R. B., & Soyer, T. D. S. (2018). Is naming brands in English worth doing? Effects of foreignness and country of origin on brand equity. Brazilian Business Review, 15(6), 606- 623. Doi: 10.15728/bbr.2018.15.6.6
Rodrigues, P., & Martins, F. V. (2016). Perceptual and behavioural dimensions: Measuring brand equity consumer based. Journal of Fashion Marketing and Management: An International Journal, 20(4), 507-519. Doi: 10.1108/JFMM-03-2016-0019
Romaniuk, J., Dawes, J., & Nenycz-Thiel, M. (2018). Modeling brand market share change in emerging markets. International Marketing Review, 35(5), 785-805. Doi: 10.1108/IMR- 01-2017-0006
Rust, R. T., Ambler, T., Carpenter, G. S., Kumar, V., & Srivastava, R. K. (2004). Measuring marketing productivity: Current knowledge and future directions. Journal of Marketing, 68(4), 76-89. Doi: 10.1509/jmkg.68.4.76.42721
Sethuraman, R., & Cole, C. (1999). Factors influencing the price premiums that consumers pay for national brands over store brands. Journal of Product & Brand Management, 8(4), 340-351. Doi: 10.1108/10610429910284319
Shane, S., & Delmar, F. (2004). Planning for the market: business planning before marketing and the continuation of organizing efforts. Journal of Business Venturing, 19(6), 767-785. Doi: 10.1016/j.jbusvent.2003.11.001
Sharp, B. (2016). How brands grow. Oxford, UK: Oxford University Press.
Skouras, T., Avlonitis, G. J., & Indounas, K. A. (2005). Economics and marketing on pricing: How and why do they differ? Journal of Product & Brand Management, 14(6), 362-374. Doi: 10.1108/10610420510624512
Singh, J., & Uncles, M. (2016). Measuring the market performance of brands: applications in brand management. In F. D. Riley, J. Singh, C. Blankson (Eds.), The Routledge Companion to Contemporary Brand Management (pp. 45-63). London: Routledge.
Soedarto, T., Kurniawan, G. S. A., & Sunarsono, R. J. (2019). The parceling of loyalty: brand quality, brand affect, and brand trust effect on attitudinal loyalty and behavioral loyalty. Academy of Strategic Management Journal, 18(1), 1-15.
Soltani, Z., & Navimipour, N. J. (2016). Customer relationship management mechanisms: A systematic review of the state of the art literature and recommendations for future research. Computers in Human Behavior, 61, 667-688. Doi: 10.1016/j.chb.2016.03.008
Srinivasan, S. (2015). Customer mindset metrics and firm performance. In V Kumar, & Denish Shah (Eds.), Handbook of Research on Customer Equity in Marketing (pp. 306- 332).Norhtampton, MA, USA: Edward Elgar Publishing
Steenkamp, J. (2017). Global brand strategy: World-wise marketing in the age of branding. London: Springer.
Stocchi, L., & Fuller, R. (2017). A comparison of brand equity strength across consumer segments and markets. Journal of Product & Brand Management, 26(5), 453-468. Doi: 10.1108/JPBM-06-2016-1220
Theotokis, A., Pramatari, K., & Tsiros, M. (2012). Effects of expiration date-based pricing on brand image perceptions. Journal of Retailing, 88(1), 72-87. Doi: 10.1016/j.jretai.2011.06.003
Tybout, A., & Calder, B. J. (2010). Kellogg on marketing. Hoboken, NJ, USA: John Wiley & Sons.
Vella, K. J., & Foxall, G. R. (2011). The marketing firm: Economic psychology of corporate behaviour. Northampton, USA: Edward Elgar Publishing.
Villarejo-Ramos, A. F., & Sanchez-Franco, M. J. (2005). The impact of marketing communication and price promotion on brand equity. Journal of Brand Management, 12(6), 431-444. Doi: 10.1057/palgrave.bm.2540238
Voss, K., & Mohan, M. (2016). Good times, bad times: The stock market performance of firms that own high value brands. European Journal of Marketing, 50(5/6), 670-694. Doi: 10.1108/EJM-12-2013-0716
Yoo, B., & Donthu, N. (2001). Developing and validating a multidimensional consumer-based brand equity scale. Journal of Business Research, 52(1), 1-14. Doi: 10.1016/S0148- 2963(99)00098-3
Yoo, B., Donthu, N., & Lee, S. (2000). An examination of selected marketing mix elements and brand equity. Journal of the Academy of Marketing Science, 28(2), 195-211. Doi: 10.1177/0092070300282002
Zeithaml, V. A. (1988). Consumer perceptions of price, quality, and value: a means-end model and synthesis of evidence. The Journal of Marketing, 52(3), 2-22. Doi: 10.1177/002224298805200302
Zhan, L., & He, Y. (2012). Understanding luxury consumption in China: Consumer perceptions of best-known brands. Journal of Business Research, 65(10), 1452-1460. Doi: 10.1016/j.jbusres.2011.10.011
Zhuang, G., Wang, X., Zhou, L., & Zhou, N. (2008). Asymmetric effects of brand origin confusion: Evidence from the emerging market of China. International Marketing Review, 25(4), 441-457. Doi: 10.1108/02651330810887486
