Social media marketing communication: effect of interactivity and vividness on user engagement
COMUNICAÇÃO DE MARKETING EM MÍDIAS SOCIAIS: EFEITO DA INTERATIVIDADE E VIVACIDADE NO ENGAJAMENTO DE USUÁRIOS
Social media marketing communication: effect of interactivity and vividness on user engagement
Revista Brasileira de Marketing, vol. 18, núm. 4, pp. 244-268, 2019
Universidade Nove de Julho

Esta obra está bajo una Licencia Creative Commons Atribución-NoComercial-CompartirIgual 4.0 Internacional.
Recepción: 26 Junio 2019
Aprobación: 25 Octubre 2019
Abstract:
Objective: The study analyzes the effect of interactivity and vividness on Facebook posts with respect to user engagement, in a higher education institutions context.
Method: Quantitative and descriptive. Data was collected by direct and structured observation of 1,981 posts from 16 Higher Education Institutions (HEI) and analyzed using descriptive statistics and multiple linear regression.
Originality/relevance: The study investigates a relevant theme - social media marketing communication -, whereby a knowledge gap was detected; notably, with regards to HEI and developing countries. The results indicate several relevant effects involving the post’s interactivity and vividness on Facebook that lead to user engagement.
Results: Our findings show that posts with high interactivity have an inverse influence on the number of users’ likes and comments. Posts with high vividness yield a higher quantity of likes, but a lower number of user comments and shares
Theoretical contributions : The research broadens the understanding of Facebook posting practices in the context of HEI, providing evidence on the timing of the posts and the typology of media (interactivity and vividness). At the same time, it allows us to confirm theoretical propositions and empirical findings that emanate from the literature regarding the effect of post characteristics with respect to user engagement in social media.
Keywor ds: Digital marketing, Social media marketing, Engagement, Facebook, Higher Education Institution.
Keywords: Digital marketing, Social media marketing, Engagement, Facebook, Higher Education Institution.
Resumo:
Objetivo: Estudo analisou o efeito do engajamento de usuários na interatividade e vivacidade em postagens de marcas no Facebook, no contexto de instituições de ensino superior.
Método: Quantitativo e descritivo, com dados coletados por observação direta e estruturada de 1.981 postagens de 16 instituições de ensino superior. Os dados coletados foram analisados por meio de técnicas de estatística descritiva e pela regressão linear múltipla.
Originalidade/Relevância: Estudo investigou um tema relevante: a comunicação de marketing em mídias sociais, na qual se identifica uma lacuna de conhecimento, notadamente no âmbito das IES e em países em desenvolvimento. Os resultados encontrados dão indicação da existência dos efeitos da interatividade e da vivacidade no engajamento de usuários no Facebook.
Resultados: Conclui-se que as postagens com interatividade em nível elevado têm influência inversa sobre a quantidade de curtidas e comentários dos usuários, e que as postagens com vivacidade em nível elevado têm influência direta sobre a quantidade de curtidas. Ao mesmo tempo, postagens com vivacidade têm relação inversa à quantidade de comentários e compartilhamentos dos usuários.
Contribuições teóricas : Estudo amplia a compreensão sobre as práticas de postagens no Facebook no contexto das IES, apresentando evidências sobre o momento da postageme os tipos de mídia (interatividade e vivacidade) utilizados. Do mesmo modo, contribuiu para confirmar algumas proposições teóricas e achados empíricos presentes na literatura sobre o efeito de características das postagens no engajamento de usuários nas mídias sociais.
Palavras-chave: Marketing digital, Marketing em mídia social, Engajamento, Facebook, Instituição de Ensino Superior.
1 Introduction
The advancement of technology and the development of the Internet have significa ntly changed the consumer's daily life, notably in relation to the proliferation of online social media use (Duffett, 2017). Such media have become a relevant sociocultural phenomenon, manifes ted through transformations in the manner that consumers and businesses connect, communica te and relate with market entities (Kaplan & Haenlein, 2010). In the wake of this social and cultural phenomenon, many companies have turned to social media (such as Facebook) as a communication and marketing relationship channel to drive customer interaction, brand awareness and business generation. (Malhotra, Malhotra & See, 2013; Shareef et al., 2019). To succeed, however, companies need to understand how social media users are attracted to brand postings and understand the characteristics of posts (such as interactivity and vividness) that drive greater user engagement with respect to published content (Fagerstrøm & Ghinea, 2013). Higher education institutions (HEI) including those of a community nature - use social media as a channel for communication and marketing relationships. HEIs market services that require frequent contact and long-term relationships with different stakeholders (Pereira & Borges, 2011; Mondini et al., 2012; Sarquis et al., 2017; Soares et al., 2018). In this line, Pereira and Borges (2011) advocate that HEIs ought to use social media to approach students and promote the brand. Similarly, Mondini et al. (2012) identified the use of social media by HEIs (especially Facebook) in communications and in their relationship with teachers, students, the community and suppliers. There is no doubt about the importance of analyzing the impact of social media posts on users (Fagerstrøm & Ghinea, 2013; Mondini et al., 2012).
In the Brazilian context, community higher education institutions - such as those linked to the Santa Catarina Association of Educational Foundations (ACAFE) - stand out for their relevant role in the regional market. In the case of ACAFE, HEIs offer 925 undergraduate and 554 postgraduate courses; they have 142,293 students, 8,968 teachers, 5,924 staff and 1,282 research groups (ACAFE, 2019). In Brazil, studies by Mondini et al. (2012), Sarquis et al. (2016) and Soares et al. (2018) reinforce the social and economic relevance of these institut ions and highlight the need to expand studies on HEI marketing practices. Within the undergraduate level, there is a predominance in the target audience of young people from 17 to 21 years old, that are high school graduates (Sarquis et al., 2017). These audiences tend to be heavy users of the Internet and use social media to communicate, buy products and build relationships (Brazil, 2016).
The social media marketing literature has grown significantly. Past studies indicate that organizations are increasingly creating fanpages and cultivating relationships with consumers and other stakeholders through social media (Harris & Rae, 2009; Chua & Banerjee, 2015; Rydén et al., 2015). Porter and Donthu (2008), for example, investigate how consumer trust in virtual communities creates value for the company, while highlighting the relevance of social media in customer relationships. On the other hand, Smith, Fischer and Yongjian (2012) analyze differences in user-generated content on Twitter, Facebook and YouTube, and postulate that there are several post characteristics which include the type of media. Kumar et al. (2016) analyze the effect of posts on customer buying behavior, and Bocconcelli et al. (2018) investigate the impact of social media on the company's communication with stakeholders. Overall, recent research shows that social media is increasingly used by organizatio ns, especially as a communication channel and for marketing relationships.
In the same vein, international studies point to the need to broaden theoretical knowledge of social media marketing communication practices, including the context of educational institutions and the effectiveness of posts (Fagerstrøm & Ghinea, 2013); Chauhan & Pilla i, 2013; Assimakopoulos, Antoniadis, Kayas & Dvizac, 2017). For Assimakopoulos et al. (2017), the literature on this topic is still incipient and needs quantitative and descriptive studies. In the same vein, Chauhan and Pillai (2013) point out the need to understand how social media are used by educational institutions, as well as the popularity of posts (i.e., their effects on user engagement). Finally, authors such as Cvijikj and Michahelles (2013) and Chua and Banerjee (2015) studied user engagement on Facebook by analyzing the number of likes, comments and sharing of content by users.
In the literature, there are indications that some HEI practices in social media would not be enjoying the desired results (Almeida, Figueiredo & Maciel, 2015). Thus, there is a need to improve these methods with respect to media types. For example, Chauhan and Pillai (2013) posit that the posting performance evaluation process is marked by operational difficulties, and that different media types (such as the interactivity or vividness level) do not produce the same levels of user engagement. De Vries, Gensler and Leeflang (2012) and Luarn, Lin and Chiu (2015) postulate that there is more interactivity when, for example, the post requires the user to comment or share some published content. There will be vividness when the post features image, animated gifs or videos that make the content more engaging. In any case, there is still little empirical evidence on organizations' social media marketing communication practices, notably in relation to the characteristics of publications, consumer reaction and performance achieved (Cvijikj & Michahelles, 2013). Similarly, little is known about the effects of publications on user attitude and behavior (Kumar et al. 2016; De Vries, Gensler & Leeflang, 2017).
Given the context presented, the objective of this research is to investigate this theme, with the following research question: What is the effect of interactivity and vividness in Facebook posts on user engagement? In this context, the objective is to investigate the effect of interactivity and vividness of Facebook posts on the engagement of HEI users. Specifica lly, it aims to: identify the organizations' blogging practices on Facebook; and examine whether interactivity and vividness in the post influences user engagement in terms of likes, comments, and likes.
To achieve these objectives, a quantitative and descriptive research approach was outlined, with data collected via direct and structured observation of the selected HEI's Facebook pages. It is hoped that the results of the research may contribute to broaden the understanding of the subject, in order to confirm - or refute - some of the theoretical propositions and empirical findings, in the light of the literature on the effects of post characteristics on user engagement. In this study, we do not intend to qualitatively analyze the content of the posts, nor the nature (positive or negative) of user comments.
2 Literature review
2.1 Digital Marketing
This work is founded on the accumulated knowledge of digital marketing and social media marketing theories. Coviello, Milley and Marcolin (2001) define digital marketing as the use of Digital Technology and the Internet in communication and marketing relationships with certain consumer groups. Suryawardani and Wiranatha (2017) postulate that digital marketing is the set of actions of disclosure and personal interaction in the digital environment with customers, employees and other stakeholders. In addition to the term digital marketing, the specialized literature uses – to a lesser extent - the terms online marketing, Internet marketing, web marketing, and e-marketing. For the purposes of this paper, the term digital marketing is used to refer to the set of marketing practices developed in the Internet environment, using smartphones, digital television or any other digital media.
Digital marketing practices encompass various promotional and relationship tactics, activities and actions such as corporate website, electronic billboards, search engine optimization (SEO), search engine marketing (SEM), email marketing and mobile marketing (Isohella et al., 2017; Suryawardani & Wiranatha, 2017). It is also worth mentioning the use of blogs, content marketing, online services, online social media and online advertising (Varadarajan & Yadav, 2009). Choosing these various online business practices requires a priori analysis of marketing objectives, organizational capabilities, and established communication and relationship strategies to reach target audiences.
The literature points out that digital marketing practices generate benefits for organizations, such as: contributing to boost the positive perception, feeling, attitude and consumer purchasing intentions; strengthen brand awareness and image (Suryawardani & Wiranatha, 2017), develop interactive, constant, personalized, real-time relationships with both customers and consumers (Ryan, 2016). In an empirical study involving three microenterprises, Isohella et al. (2017) also revealed benefits such as low costs, ease of performance measureme nt and better customer relationships. The research by Suryawardani and Wiranatha (2017), on the other hand, showed a positive effect of digital marketing practices on the intention of consumers to visit, which will in turn have a positive impact on traditional communication actions.
Subsequent theoretical developments indicate a growing use of social media as a marketing communication channel. For example, Malhotra et al. (2013) point to a greater use of Facebook by organizations, usually aiming at direct interaction with consumers and to develop visual communications through image and video posts. In this line, De Vries et al. (2012) show that some companies are increasingly posting messages (containing videos, images, questions, and information) on their Facebook pages to encourage customers to follow the brand and engage in posts by liking, commenting, or sharing content. On Facebook, user engagement has often been examined through these three metrics, which are considered distinct and complementary engagement measures (Sabate et al., 2014). Previous studies also indicate that posts are naturally occurring behavioral manifestations of engagement that are easy to observe, and are also indicative of users' cognitive, affective, and behavioral responses (De Vries et al., 2012; Ji et al., 2019).
It should also be noted that several other studies (such as Malhotra et al., 2013; and Chua & Banerjee, 2015) give indications about the different effects of Facebook post characterist ics in terms of user likes and sharing comments. The accumulated knowledge of the area allows us to assume that posts from different types of media (i.e., those characterized by different levels of vividness or interactivity) impact differently the user engagement. Along the same line, Malhotra et al. (2013) revealed that posts with images have more comments.
Chua and Banerjee (2015) corroborate this issue by revealing that posts with a high level of vividness (containing images, photos or videos) are associated with more comments and user sharing. The study by Luarn et al. (2015) reinforces this point by postulating that posts with
high interactivity (i.e., those that invite the user to perform some action, such as visiting a website) are characterized by a higher number of likes, compared to posts with low interactivit y. Thus, as pointed out by De Vries et al. (2012) and Chauhan and Pillai (2013), the literat ure suggests that companies' use of social media tends to yield better results when the posts contain elements of vividness and interactivity that are appealing to users. On Facebook, interactivity and vividness in posts are different concepts; however, they may coexist in the same post, and there may be different levels of vividness and interactivity (Ji et al., 2019).
2.2 Social media in the context of higher education institutions
In Brazil, HEIs intensified their marketing communication practices attracting new students as well as to broaden relationships with their student body. In the past decade, the education sector has faced intense competition, with the entry of new competitors, reduced government funding and the proliferation of distance learning courses (Antunes, 2011). Because of that, HEIs had to intensify the dissemination of their brands and services, be more incisive and use interactive mechanisms in order to improve the return on the marketing investment (Suryawardani & Wiranatha, 2017). These changes in the way HEIs operate was also necessary given the customer behavior, who are increasingly used to the Internet and who use social media a lot to communicate, interact and obtain information (Duffett, 2017).
In the context of HEI, previous studies such as Peruta and Shields (2016), Fujita, Harrigan and Soutar (2017) and Araujo (2018) show that social media are used as a communication and relationship channel with students, employees, parents of students, alumni and the wider community. According to Fujita et al. (2017), some HEI social media marketing communication practices are: promoting hashtags to create relevant content that inspires user participation; provide students and staff with opportunities to express their opinions and collectively build meaning for the brand; align the institution's communications with student experiences; and deliver relevant and timely content. In turn, Araujo's study (2018) reveals that, through Facebook, these practices contribute to improve visibility and access to academic publications, as well as to promote faster and more interactive exposure to the public.
It is worth noting that these multiple studies also suggest that social media marketing communication practices can be used to attract new students (Peruta & Shields, 2016); improve relationships and build contact networks (Antunes, 2011); facilitate the development of personalized, interactive and frequent contacts and calls (Assimakopoulos et al., 2017); contribute to value creation and favor the dissemination of services quickly and economica lly (Fujita et al., 2017). Thus, it is plausible to assume that HEI's presence in social media could contribute to improving brand image and business performance, as well.
In the context of the case presented by Pereira and Borges (2011), the authors analyzed the use of social media in a public educational institution through a survey with students, staff and community representatives. The results reveal that social media are used as a communication channel with students and the community; that social media are perceived as an important source of information; and that social media generate benefits such as approximation and interactivity, access to information, contributing to the perception of technological progress of the institution.
In the case of ACAFE HEIs, the study by Mondini et al. (2012) points out that most use at least one social media (especially Facebook and Twitter). In addition, the authors show that the practices aim to develop communication and relationship actions with students. The authors postulate that the use of social media reinforces the credibility of the HEI, as well as enabling a better understanding of students' needs and wants.
In the same vein, Sarquis et al. (2016) studied ACAFE HEIs and confirmed widespread use of Facebook and Twitter. The main purpose behind its use is the development of communication and relationships with students and the community. The authors show that HEIs publish different types of content; However, there is no clear and defined definition regarding the periodicity of actions. In addition, a low level of interaction with the user was identified. According to the authors, the main performance metrics are: number of followers and number of likes, comments and sharing by users. The main benefits of social media marketing strategies are: obtaining student information, service feedback, targeted marketing campaigns and improved institutional image.
2.3 Development of research hypotheses and framework
Social media marketing research suggests some factors related to posting characterist ics have different effects on user engagement (Brookes, 2010; De Vries et al., 2012;Chauhan & Pillai, 2013; Cvijikj & Michahelles, 2013; Sabate et al., 2014; Luarn et al., 2015). On Facebook, brand posts feature format (media type) characteristics, including different levels of interactivity and vividness.
Steuer (1992) defines interactivity as the message intensity to enable and stimulate user participation in a real-time mediated environment. Chua and Banerjee (2015) define it as the intensity with which the media allows users to interact and influence the communication process, in a synchronized and interactive way. Sabate et al. (2014) postulate that interactivit y in social media postings will influence the reaction of users, as they arouse greater attention and interest. In a Facebook study, De Vries et al. (2012) stated that posts with low interactivity will produce an inverse (negative) effect on user’s engagement, and Luarn et al. (2015) postulate that interactivity in the posts favor user engagement in terms of likes, comments, or sharing.
Despite its relevance, there are still few empirical studies on the effects of interactivit y on social media postings on Facebook user engagement. Chua and Banerjee (2015) believe that empirical evidence on the subject is still inconclusive, and further research is needed to understand its effects on user engagement, namely in specific contexts. Thus, believing that media interactivity influences user engagement, we formulate the first hypothesis of this research, as follows:
H1a: High interactivity Facebook post influences users likes H1b: High interactivity Facebook post influences users comments H1c: High interactivity Facebook post influences users sharing
The literature indicates that the posting vividness is likely to influence the Facebook user engagement. For Sabate et al. (2014), postings with high vividness tend to attract user attention and stimulate a proactive attitude toward the message. In this sense, Steuer (1992) defines vividness as the representational richness in a mediated environment that contains stimuli and information for different human senses. Thus, the vividness of the post will be related to the diversity of sensory stimuli used - such as colors, graphics and videos, for example. It is plausible to assume that a video message will tend to be more vivid than a plain text message. Sabate et al. (2014) corroborate this understanding by stating that a message that contains only images will tend to stimulate only the user's view, while a video message will also stimula te the sense of hearing.
Brand posts on Facebook will always have some level of vividness - be it null, low, moderate or high (De Vries et al., 2012; Chua & Banerjee, 2015). De Vries et al. (2012) indicate that posts with more vividness cause a more positive user attitude towards the message. This effect may favor user engagement in terms of likes, comments or shares. Chua and Banerjee's (2015) contribution in the context of Facebook supports the assumption that posts with no vividness will have a small number of users' likes.
However, the relationship between the vividness of Facebook posting and user engagement is not yet sufficiently clarified. The work of Luarn et al. (2015) suggests that Facebook users will be more prone to like, comment, and share in posts with moderately vividness (rather than higher, as one might suppose). In the same vein, Brookes (2010) identified that posts containing images get more user engagement than posts with videos. Thus, the results of the various surveys are still contradictory and not conclusive.
Considering that this theme lacks new scientific investigations, and believing that high vividness Facebook brand posts will tend to influence users' engagement in terms of likes, comments and sharing, the second research hypothesis was formulated, as follows:
H2a: High vividness Facebook post influences users likes H2b: High vividness Facebook post influences users comments H2c: High vividness Facebook post influences users shares
Figure 1summarizes the established research hypotheses and presents the research reference framework. Two independent variables will be analyzed to help explain users' engagement: (1) interactivity and (2) vividness of the post.
The three dependent variables analyzed are Facebook user engagement metrics: (a) likes,
(b) comments, and (c) shares. We chose to measure user engagement through these three performance metrics in line with the recommendation of Chua and Banerjee (2015), Luarn et al. (2015) and Ji et al. (2019). These metrics are believed to represent behavioral manifestat ions that happen naturally. In addition, they are easily observable, and reflect users' cognit ive, affective, and behavioral responses.
Thus, the proposed model is unidirectional, with exogenous variables stipulated in a single direction relative to the endogenous variable.
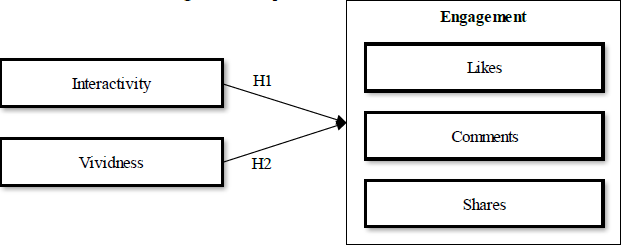
Figure 1
Proposed frame of reference
Source: prepared by the authors.
3 Methodological aspects
This study is classified as quantitative and descriptive. It has as its object of study the 16 HEIs associated with ACAFE located in the state of Santa Catarina. ACAFE is the main HEI association in this state and brings together all community colleges. Of the total, eleven of them are universities, and five are university centers. Considering that all HEIs associated with ACAFE participated in the research, we deem this research to be comprised of a census.
The unit of analysis is the messages posted by HEIs on their respective Facebook pages, collected during the period that ranges from August to October 2017. Data collection was through direct, non-participant and structured observation of the Facebook pages. According to Kozinets (2015), this observation method is recommended for research in virtual environme nts, since it enables the collection of empirical data pertaining to the practices and behaviors of the phenomenon analyzed.
Data collection was performed using a structured collection instrument (Observation Record Form), comprised of four dimensions and the respective variables. The first dimens ion includes data about the HEI page, containing the variables: HEI name (variable 1), Facebook page link (v2), page creation time (v3), number of followe rs (v4), date from the note (v5) and link from the posted message (v6). The second dimension includes the data of the moment of posting, containing the variables: date of posting (v7), day of the week (v8) and time of day (v9), as suggested by Brookes (2010) and Sabate et al. (2014). The third dimension includes data related to the media typology, with the variables: level of interactivity of posts (v10) and level of vividness (v11), measured according to Vries et al. (2012) and Luarn et al. (2015). Finally, engagement metrics contain data on comment quantity (v12), shares (v13) and likes (v14), as recommended by Luarn et al. (2015) and Chua and Banerjee (2015). The collectio n instrument was previously tested in three other HEIs from another state of the country. These results allowed us to improve the order of responses and post recording, as well as the description of the guidelines for data collection.
Regarding the measurement of post characteristics, the investigative triangula t ion procedures (Flick, 2018) and intra- and inter-examiner reliability of Haneline and Young (2009) and Denzin and Lincoln (2011) were adopted. As part of the investigative triangulat io n, different researchers (two professionals with experience in research and social media) performed the observation of the posts separately and independently. Over two weeks after the first observation each researcher performed a second evaluation of the posts. To ensure intra - examiner reliability, agreement on the data collected at both assessment times was carried out. Inter-rater reliability was established through agreement with the data collected by the two researchers. In case of disagreement, a third researcher (experienced in social media) was called in to support this post evaluation process.
Regarding the method of analysis, the data collected were initially tabulated in Excel. Subsequently, the data were completed and validated, and the exploratory analysis was performed.
Initially, the internal consistency of the engagement metrics was evaluated; Cronbach's alpha ( = 0.793) corresponds to a high reliability of the measurement scale. Data normalit y analysis by asymmetry and kurtosis shows characteristics that approximate it to a normal distribution (asymmetry between 1 and -1). Pearson's correlations were subsequently calculated and indicate a positive and high linear relationship between the variables (likes and comments ρ = 0.61; likes and shares ρ = 0.55; comments and shares ρ = 0.52). Finally, multicollinear ity metrics were calculated by Variance Inflation Factor. No problems were found in this regard for the variables’ interactivity (VIF = 1,167) and vividness (VIF = 1,160).
The collected data were submitted to a set of analytical techniques: (a) descriptive statistics (relative frequency, minimum percentage, maximum percentage, standard deviatio n and arithmetic mean); and (b) testing of research hypotheses tested by multiple linear regression using the least squares method as advocated by De Vries et al. (2012) and Sabate et al. (2014).
After the data exploration steps were completed, the collected data were adjusted to apply the multiple linear regression, by transforming the data of the independent variables into logarithmic values (due to the number of dummy variables). The user engagement metrics (y1 = number of likes, y2 = number of comments and y3 = number of shares) were calculated as follows: we considered the number of interactions (comments, likes or shares) of each post; This value was then divided by the number of fans on the page as follows:
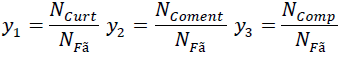
Where: NFãrepresents the number of fans / followers of the HEI page, NCurtthe amount of likes per post, NComentPost the amount of comments per post, NCompPost the number of shares per post.
4 Data presentation and analysis
4.1 Sample Profile
Table 1presents the data of the HEI Facebook pages and posts of the study. On average, participating HEIs have 9,267 students, with USJ being the smallest (292 students) and UNISUL the largest (29,369 students). Most HEIs (10) were founded from 1965 on. The oldest
HEI is UNIPLAC (founded in 1959), and the newest is USJ (founded in 2005). It is noted that the vast majority of the studied HEIs are community-based institutions – that is, they were constituted in the form of associations or foundations, with legal entity constituted under private law, not for profit and assets belonging to civil society entities or government (Brazil, 2013). Such profile is in the state of Santa Catarina.
| HEI | Facebook page | Followers | Posts | Firstpost | Last post |
| Centro Universitário Católica de Santa Catarina | www.facebook.com/CatolicaSC | 22.799 | 180 | 01/08/17 | 31/10/17 |
| Universidade Regional de Blumenau | www.facebook.com/FURBoficial/ | 44.115 | 83 | 01/08/17 | 31/10/17 |
| Universidade do Estado de Santa Catarina | www.facebook.com/udesc | 60.651 | 67 | 01/08/17 | 31/10/17 |
| Universidade do Contestado | www.facebook.com/universidadedocontestad | 21.536 | 75 | 02/08/17 | 30/10/17 |
| Universidade do Extremo Sul Catarinense | www.facebook.com/unescoficial | 35.264 | 215 | 01/08/17 | 31/10/17 |
| Universidade Alto Vale do Rio do Peixe | www.facebook.com/uniarp | 13.327 | 108 | 01/08/17 | 31/10/17 |
| Centro Universitário Barriga Verde | www.facebook.com/unibave | 11.973 | 78 | 01/08/17 | 31/10/17 |
| Centro Univ. Desenv. do Alto Vale do Itajaí | www.facebook.com/UniversoUnidavi | 20.113 | 108 | 01/08/17 | 31/10/17 |
| Centro Universitário de Brusque | www.facebook.com/unifebe | 17.267 | 139 | 01/08/17 | 31/10/17 |
| Universidade do Planalto Catarinense | www.facebook.com/uniplaclages | 12.498 | 53 | 02/08/17 | 31/10/17 |
| Universidade do Sul de Santa Catarina | www.facebook.com/unisul.universidade | 70.651 | 217 | 01/08/17 | 31/10/17 |
| Universidade do Vale do Itajaí | www.facebook.com/univali | 84.605 | 141 | 01/08/17 | 31/10/17 |
| Universidade da Região de Joinville | www.facebook.com/univille | 45.332 | 176 | 01/08/17 | 31/10/17 |
| Universidade Comunitária da Região de Chapec | www.facebook.com/unochapeco | 42.992 | 162 | 01/08/17 | 31/10/17 |
| Universidade do Oeste de Santa Catarina | www.facebook.com/unoescoficial | 61.854 | 120 | 01/08/17 | 31/10/17 |
| Centro Universitário Municipal de São José | www.facebook.com/USJ | 4.276 | 59 | 01/08/17 | 15/10/17 |
4.2 Results of the descriptive analysis of measured variables
Table 2presents the descriptive analysis of the independent variables measured. At the time of posting, HEI messages were categorized to be on a business day, or on a weekend. The results show that most posts (88.9%) were made on weekdays (Monday to Friday). The largest percentage of posts on weekdays (100%) corresponds to UNIPLAC, and the lowest (78.4%) to UNIFEBE. Regarding the time of day, 79% of posts were made at the time that extends from 10: 00h to 20: 59h – Brazil’s Internet peak time (Brazil, 2016). The highest percentage of posts in this time slot corresponds to UNIBAVE (98.7%), and the lowest to UNOESC (69.2%). A significant percentage of posts (21%) occurred over the period from 21:00 to 9:59.
| Dimension | Variable | Level | Frequency | percentage | Minimumpercentage(HEI) | Maximumpercentage(HEI) |
| Post moment | day of the week (VI) | 0 = business day 1 = weekend | 1761 220 | 88,9% 11,1% | 78,4% 0,0% | 100,0% 21,6% |
| time of day (VI) | 0 = 10:00 and 20:59 | 1565 | 79,0% | 69,2% | 98,7% | |
| 1 = between 21:00 and 09:59 | 416 | 21,0% | 1,3% | 30,8% | ||
| Media | vividness (VI) | 0 = null | 2 | 0,1% | 0,0% | 0,6% |
| type | 1 = low | 364 | 18,4% | 0,5% | 78,0% | |
| 2 = moderate | 1294 | 65,3% | 22,0% | 87,9% | ||
| 3 = high | 321 | 16,2% | 0,0% | 34,7% | ||
| interactivity | 0 = null | 67 | 3,4% | 0,0% | 45,8% | |
| (VI) | 1 = low | 404 | 20,4% | 7,1% | 72,0% | |
| 2 = moderate | 1176 | 59,4% | 18,7% | 79,2% | ||
| 3 = high | 334 | 16,9% | 0,0% | 37,4% |
Regarding the media type, the posts were categorized in terms of vividness and interactivity, considering the following scale: null; low; moderate; or high. Results show that most posts (65.3%) are moderately vividness; 18.4% of them have low vividness; and only 16.2% of them have high vividness - that is, with image or video formats. The highest percentage of vividness (45.3%) belongs to UNIFEBE, and the lowest (0%) to USJ. Regarding interactivity, most posts (59.4%) had moderate interactivity; 20.4% have low interactivity and only 16.9% have high interactivity. The highest percentage of interactivity (37.4%) belongs to UNIFEBE, and the lowest (0%) to USJ and UnC.
Table 3presents the results of the descriptive analysis of the measured dependent variables (engagement metrics): number of likes, number of comments and number of shares. HEI posts analyzed totaled 110,259 likes, which is an average of 55.6 likes per post. The median is 19 likes, and standard deviation is 150.1. Thus, there is a high dispersion of sample data. There are 10 posts with over 1,000 likes: six from UDESC; one from UNOESC; one from UnC; one from UNESC and one from UNOCHAPECÓ. The UDESC post of September 4, 2017 got the most likes (3,132); HEI with the highest average likes per post is UDESC (333.1) and the one with the lowest average likes is UNISUL (17.0).
| Statistic | Like | Comment | Share |
| Quantity (total) | 110259 | 7302 | 18915 |
| Max Quantity/Post | 3132 | 406 | 1130 |
| Mean | 55,66 | 3,69 | 9,55 |
| Median | 19 | 0 | 1 |
| Standard deviation | 150,15 | 18,31 | 37,87 |
| Minimum Average/HEI | 17,07 | 0,6 | 2,19 |
| Maximum Average/HEI | 333,16 | 29,73 | 56,13 |
Overall, HEI posts total 7,302 comments, with an average of 3.6 comments per post, and a standard deviation of 18.3. Four posts got over 200 comments (two from UDESC, one from UNESC and one from UNIVILLE). The post from UDESC on August 30, 2017 received most comments: 406. UDESC is the institution with the highest average comments (29.7), and UnC got the lowest average (0.6). In turn, the number of shares totaled 18,915 shares per post, with an average of 9.5, a median of 1 and a standard deviation of 37.8. Eight posts got over 200 shares (5 from UDESC, 2 from UNIVALI and 1 from UNISUL). UNIVALI's post of August 14, 2017 had the highest number of shares (1,130). The HEI with the highest average of shares is UDESC (56.1), and the one with the lowest average of shares is CSC (2.1).
4.3 Results of HEI descriptive analysis
Table 4presents the results of the descriptive analysis of the vividness and interactivit y variables by HEI, including the number and percentage of posts (at moderate or high level). Regarding vividness, the results show that the vast majority of HEIs (81.2%) have a high percentage of posts with vividness traits - that is, messages with links that direct the user to an additional text, image or video. Overall, about 78.1% of posts have some vividness trait. The institutions with the highest number of vividness posts are: UNESC (99.5%), UNIVALI (98.6%) and UDESC (97%). HEIs with less vividness posts are: FURB (66.3%), UNIDAVI (59.3%) and USJ (22%).
With regards to the interactivity dimension, the results indicate that 81.2% of HEIs have high interactivity posts; In other words, they have links that encourage the user to interact, whether watching a video, or reading some more detailed content. Overall, 71.8% of HEI posts are interactive. The institutions with the highest interactivity are: UNIVALI (92.9%), UNOCHAPECÓ (92%) and UNIFEBE (89.2%), and those with the fewest interactivity posts are: UNIARP (50%), USJ (23, 7%) and UnC (18.7%).
| HEI | Vividness | Interactivity | ||
| Frequency | Percentage | Frequency | Percentage | |
| CSC | 150 | 83,3% | 145 | 80,6% |
| FURB | 55 | 66,3% | 65 | 78,3% |
| UDESC | 65 | 97,0% | 57 | 85,1% |
| UnC | 54 | 72,0% | 14 | 18,7% |
| UNESC | 214 | 99,5% | 180 | 83,7% |
| UNIARP | 83 | 76,9% | 54 | 50,0% |
| UNIBAVE | 58 | 74,4% | 50 | 64,1% |
| UNIDAVI | 64 | 59,3% | 83 | 76,9% |
| UNIFEBE | 109 | 78,4% | 124 | 89,2% |
| UNIPLAC | 47 | 88,7% | 43 | 81,1% |
| UNISUL | 173 | 79,7% | 168 | 77,4% |
| UNIVALI | 139 | 98,6% | 131 | 92,9% |
| UNIVILLE | 145 | 82,4% | 146 | 83,0% |
| UNOCHAP | 151 | 93,2% | 149 | 92,0% |
| UNOESC | 95 | 79,2% | 87 | 72,5% |
| USJ | 13 | 22,0% | 14 | 23,7% |
Table 5presents the descriptive statistics of HEI performance in terms of user engagement: arithmetic mean, standard deviation and weighted average by number of followers. Regarding the number of likes, the results indicate that, in general, the average likes per post is relatively low (55.6 likes) when we take into account the number of followers (average 35,578 per HEI). The HEIs with the highest likes are: UDESC (M = 333.1; SD = 560.9), UNOESC (M = 100.7; SD = 204.9), UNIVALI (M = 89.1; SD = 117,0) and UNIVILLE (M = 69.3; SD = 92.8). The HEIs with less likes are CSC (M = 17.6; SD = 33.7), USJ (M =
17.5; SD = 19.0) and UNISUL (M = 17.0; SD = 39, 0). The analysis of the followers' likes weighted average shows that the best performing HEIs are: UNOCHAPECÓ (y1 = 0.00485), UNIVILLE (0.00460) and UNIFEBE (0.00458). However, the data show a relatively high standard deviation, which leads us to conclude that there is a high dispersion of values ?? in relation to the mean.
Regarding the number of comments, the results show that the average number of comments per post is low: only 3.6 comments in the period analyzed. The HEI with the highest average of comments are: UDESC (M = 29.7; SD = 69.8), UNIVALI (M = 5.0; SD = 12.0) and UNIVILLE (M = 4.8; SD = 20.4). Those with the lowest averages are: UNIPLAC (M = 1.2; SD = 2.4), UNISUL (M = 0.8; 3.0) and UnC (M = 0.6; SD = 2.7). When we analyze the average number of followers weighted comments, the best performing HEIs are: UNIDAVI (y2 = 0.00030), UNOESC (0.00030) and UNIARP (0.00030).
| HEI | Post frequency | Like | Comment | Share | ||||||
| Mean | SD | y1 | Mean | SD | y2 | Mean | SD | y3 | ||
| CSC | 180 | 17,63 | 33,77 | 0,00081 | 1,36 | 4,11 | 0,00006 | 2,19 | 4,73 | 0,00011 |
| FURB | 83 | 46,61 | 57,9 | 0,00248 | 2,28 | 4,33 | 0,00022 | 10,82 | 19,76 | 0,00054 |
| UDESC | 67 | 333,16 | 560,93 | 0,00171 | 29,73 | 69,85 | 0,00008 | 56,13 | 92,32 | 0,00039 |
| UnC | 75 | 44,80 | 198,64 | 0,00216 | 0,60 | 2,73 | 0,00012 | 7,28 | 22,23 | 0,00046 |
| UNESC | 215 | 44,69 | 104,27 | 0,00393 | 4,22 | 24,1 | 0,0002 | 4,13 | 14,06 | 0,00067 |
| UNIARP | 108 | 34,63 | 61,06 | 0,00346 | 1,42 | 4,9 | 0,0003 | 4,26 | 9,85 | 0,00064 |
| UNIBAVE | 78 | 45,91 | 51,03 | 0,00217 | 2,49 | 5,58 | 0,00013 | 19,26 | 28,53 | 0,00046 |
| UNIDAVI | 108 | 35,44 | 53,92 | 0,00346 | 3,56 | 10,15 | 0,0003 | 5,69 | 10,92 | 0,00064 |
| UNIFEBE | 139 | 31,66 | 30,05 | 0,00458 | 2,76 | 13,29 | 0,00027 | 2,51 | 9,46 | 0,00064 |
| UNIPLAC | 53 | 33,53 | 67,94 | 0,00128 | 1,23 | 2,41 | 0,00006 | 5,68 | 13,36 | 0,00031 |
| UNISUL | 217 | 17,07 | 39,01 | 0,0039 | 0,85 | 3,02 | 0,00019 | 6,06 | 22,84 | 0,00067 |
| UNIVALI | 141 | 89,13 | 117,09 | 0,00454 | 5,06 | 12,08 | 0,00027 | 27,67 | 106,1 | 0,00063 |
| UNIVILLE | 176 | 69,39 | 92,87 | 0,0046 | 4,86 | 20,41 | 0,00023 | 8,27 | 14,11 | 0,00077 |
| UNOCHAPECÓ | 162 | 55,50 | 99,34 | 0,00485 | 3,53 | 9,26 | 0,00025 | 9,62 | 20,32 | 0,00082 |
| UNOESC | 120 | 100,72 | 204,9 | 0,00355 | 2,37 | 9,13 | 0,0003 | 5,48 | 13,76 | 0,00064 |
| USJ | 59 | 17,56 | 19,08 | 0,00122 | 2,25 | 5,16 | 0,00006 | 5,27 | 11,54 | 0,00029 |
Regarding the number of shares, the results indicate that the average share per post is also low: 9.5 shares in the period. The HEI with higher averages are: UDESC (M = 56.1; SD = 92.3), UNIVALI (M = 27.6; SD = 106.1) and UNIBAVE (M = 19.2; SD = 28.5 ), and those HEIs with lower averages are: UNESC (M = 4.1; SD = 14.0); UNIFEBE (M = 2.5; SD = 9.4) and CSC (M = 2.1; SD = 4.7). Inspection of the weighted average shares shows that the best performing HEIs are: UNOCHAPECÓ (y3 = 0.00082), UNIVILLE (0.00077), UNISUL (0.00067) and UNESC (0.00067).
It should also be noted that the results of user’s engagement indicate that there is a negative evolution in the performance of HEI posts in the period (downward trend). The average likes per user varied by 13.2% (in August it was 59.4, in September 56.3 and in October 51.5). Likewise, the average comment per user shows a sharp drop (-33.8%; in August, it was 4.2, in September it was 3.9 and in October it was 2.8). Average shares per user results fell even further (-39.6%; in August it was 12.2, in September it was 9.2 and in October it was 7.4).
4.5 Hypothesis test results
In the light of our research objectives (namely: to analyze the effect of vividness and interactivity on the post on user’s engagement on Facebook), the multiple linear regression technique was used to test the formulated hypotheses. In the use of this analytical technique, Durbin (1970) advocates that the least squares method is efficient for the estimation of the model parameters, as it seeks to obtain the best fit for the analyzed data set.
Table 6presents the results of the multiple regression analysis between the independent variables (vividness and interactivity) and the number of users’ likes (dependent variable). The analysis of variance (ANOVA) results show that the generated statistical model has the appropriate quality: The F value is 14.871 and the p-value is <0.05 (with significance = 0.000). Thus, the endogenous variable (number of likes) can be modeled linearly through the analyzed exogenous variables. Within this model, both variables have significant coefficients (B) with significant contribution: interactivity (sig. = 0.001) and vividness (sig. = 0.000). The variable with the greatest explanatory power is vividness: value t = 3,899, followed by interactivity t =-3,207. The interactivity variable has a negative angular coefficient; this indicates that there is an inverse relationship with the number of likes. For the vividness variable, the angular coefficient is positive (B = 0.092), denoting a direct relationship between vividness and the number of likes.
| Model | NonstandardCoefficients | Standardizedcoefficients | t | Sig. | CollinearityStatistics | ||
| B | Standarderror | Beta | Tolerance | VIF | |||
| Vividness Interactivity | 0,251-0,17 | 0,064 0,054 | 0,092-0,076 | 3,899-3,207 | 0,0000,001 | 0,862 0,857 | 1,160 1,167 |
| Model Statistics | R2= ,050; F= 14,871; Sig.= ,000 | ||||||
Table 7, in turn, presents the results of the multiple regression between the exogenous variables and the amount of comments (second engagement metric). The ANOVA results indicate that the generated model presents an adequate quality, with a value F = 17.057 and the p-value under 0.05 (sig. = 0.000). Both variables of this second model present regression coefficients (B) that significantly contribute for the model performance (sig. = 0.000). The variable with the highest explanation is interactivity (value t = -5.537), followed by vividness (value t = -4.222). Thus, the vividness and interactivity variables present negative angular coefficient, indicating an inverse relationship with the number of comments.
| Model | NonstandardCoefficients | Standardizedcoefficients | t | Sig. | CollinearityStatistics | ||
| B | Standarderror | Beta | Tolerance | VIF | |||
| Vividness Interactivity | -0,794-0,875 | 0,188 0,158 | -0,099-0,131 | -4,222-5,537 | 0,0000,000 | 0,862 0,857 | 1,160 1,167 |
| Model Statistics | R2= ,057; F= 17,057; Sig.= ,000 | ||||||
Table 8presents the regression results between the exogenous variables and the number of shares. The ANOVA results indicate that the generated statistical model presents the appropriate quality. The value of F = 4.875 and the p-value is <0.05 (sig. = 0.000). Only one variable in this third model has a significant contributing angular coefficient: vividness (sig. = 0.019), with an explanatory value of 2.352. Since the vividness variable has a negative angular coefficient, it follows that there is an inverse relationship between vividness and the number of shares.
| Model | NonstandardCoefficients | Standardizedcoefficients | t | Sig. | Collinearity Statistics | ||
| B | Standarderror | Beta | Tolerance | VIF | |||
| Vividness Interactivity | -0,42 -0,199 | 0,176 0,148 | -0,057 -0,032 | -2,35 -1,345 | 0,019 0,179 | 0,862 0,857 | 1,160 1,167 |
| Model Statistics | R2= ,017; F= 4,875; Sig.= ,000 | ||||||
Accordingly, the results show that posts with interactivity have an inverse influence on the amount of user likes and comments. Nevertheless, they have no influence on the number of shares, as the possible predictor variables are not statistically significant. This result may indicate that posts with high interactivity would yield less likes and comments than posts with low or moderate interactivity. Therefore, we found no support for hypothesis H1c, which was rejected. Hypotheses H1a and H1b were accepted.
For vividness, the results indicate a relationship between vividness and posting performance, both in terms of likes, comments and shares. Posts with high vividness have a direct influence on the number of likes, and an inverse effect on the number of comments and shares. In other words, the results suggest that posts with vividness at high levels generate fewer comments and shares, as compared to posts with vividness at low or moderate levels. Thus, we find empirical support to support the hypotheses H2a, H2b and H2c.
4.6 Discussion
The present study presents a set of empirical evidence on the Facebook marketing communication practices of HEIs of Santa Catarina State. The data collected correspond to a sample of 1,981 posts in the period. This number of publications is higher than those reported in previous studies on the them – Chauhan and Pillai (2013), who analyzed 10 brands and found 1,440 publications; Luarn et al. (2015), who investigated 10 brands and found 1,030 publications; De Vries et al. (2012), who analyzed 11 brands and found only 355 publicatio ns.
The results show that all HEIs currently have Facebook pages. This is an improve ment over 2011, when only 38% of them had Facebook pages (Mondini et al., 2012). The study by Sarquis et al. (2016) involving some of the ACAFE HEIs points out that there was a signific ant increase in the number of Facebook followers of UNISUL, UNIVALI and UDESC. Today, ACAFE HEIs have on average 35,578 followers.
Regarding post performance, research shows that 1,981 ACAFE HEI posts produced only 55.6 likes and 3.6 comments per post. In comparison, the companies analyzed by De Vries et al. (2012) featured 189.2 likes and 42.2 comments per post. The results of Mondini et al. (2012) and Sarquis et al. (2016) in the context of ACAFE do not present data on quantity of likes, comments and shares on Facebook. Given the absence of other similar studies in the educational context, it is considered that the multinational manufacturing firms studied by De Vries et al. (2012) may be used to evaluate the relative performance of the HEI posts, considering the number of followers. ACAFE HEIs have less Facebook likes than those found by these authors. However, there is a need to develop new studies regarding the performance of HEI Facebook posts, as stated by Assimakopoulos et al. (2017).
As for the time of posting, the survey results reveal that the analyzed HEIs published more on Wednesdays – different from the 11 brands studied by De Vries et al. (2012), who published more on Thursdays. However, the days with the fewest posts are Saturday and Sunday (this is in line with Brookes’ (2010) findings on the theme). Regarding the time of day, this research shows that ACAFE HEIs published mainly from 11:00 to 11: 59h and from 17:00 to 17: 59h. This is in contrast with the practice of HEIs in India, which publish more between 20:00 and 00:00 (Chauhan & Pillai, 2013). Such fact would be justified by the choice of the HEIs researched, which invest in posts at the peak Internet usage time in Brazil (10: 00-20: 59), as revealed by the Brazilian Media Survey (Brazil, 2016).
The findings of this study also show the effect of interactivity and vividness on Facebook users’ engagement. The hypothesis test suggests that Facebook posts with high level vividness have a direct effect on the number of likes, but this influence is inverse in relation to the number of comments and user shares. Thus, animated gif posts and videos (for example) will encourage users to enjoy publishing, rather than commenting and sharing. The literature suggests that posts with lower level of vividness tend to have faster views, and that they require less mental effort from the social media user (De Vries et al., 2012; Cvijikj & Michahelles, 2013). It is possible that this fact may explain the result found here only for engagement in terms of likes by HEI users analyzed. In the work of Luarn et al. (2015), users expressed preference for posts with vividness at a moderate level; this result differs from the findings of Chua and Banerjee (2015) and Ji et al. (2019). Chua and Banerjee (2015) suggest a positive relationship between vividness and the amount of user comments and sharing; in Ji et al. (2019), the results indicate that there is a positive effect of vividness on the amount of likes and shares. Thus, this relationship needs further empirical investigation to explain its underlying effects, including the investigation of the mechanism which reflects the number of posts observed and the differences in the product category – or sectors – analyzed.
With respect to interactivity, highly interactive posts have a higher degree of synchronized and interactive user communications (Chua & Banerjee, 2015; De Vries et al., 2012). The results of the present study indicate, however, that posts with high interactivity have an inverse influence on the amount of user likes and comments. The results allow us to infer that Facebook posts with strong incentives for user interaction (e.g., questioning users, or an invitation to participate in games or sweepstakes) may discourage engagement in terms of likes and comments. This result is in line with the findings of Ji et al. (2019) on Facebook, which revealed a negative relationship between interactivity and engagement for some users. This author postulates that posts with high interactivity get less likes and shares. One possible explanation is that – on Facebook - some images or videos may have more impact than an explicit request for interaction, which will have more effect on user likes and comments behavior (Sabate et al., 2014).
However, the results of interactivity differ from the findings of Luarn et al. (2015) on the topic. For these authors, posts with high interactivity feature greater user engagement in terms of likes, comments, and shares. Thus, although it is plausible to suppose that too much incent ive can have a negative effect on users’ willingness to interact on Facebook, we conclude that this also needs to be further investigated. The literature proposes some ways to investiga te interactivity posts that could produce more user engagement (Chua & Banerjee, 2015; De Vries et al., 2012). As noted by De Vries et al. (2012), although divergent results may be explained by the cultural differences of the contexts and countries studied, new studies in Brazil may shed some light and corroborate or refute the research findings.
6 Final considerations
The results of this study reveal that most of the HEIs post on Facebook on weekdays and from 10am to 8:59 pm. Most of the posts are moderately vividness and interactivity, i.e., they contain texts, images, links and requests for comments and user interaction (with high intensity). Regarding user engagement, the results also reveal that the likes, comments, and shares per post are relatively low, given the average number of followers per HEI. This may indicate that some HEI social media practices are not producing the expected results and need improvement, as pointed out by Almeida et al. (2015).
Regarding the hypotheses formulated, the study results reveals that Facebook posts with high level interactivity have a negative influence on the amount of user likes and comments – which corroborated the findings of Ji et al. (2019) on the subject-, and no influence on the intensity of sharing. They also reveal that posts with high level vividness have a positive effect on the number of likes, but a negative effect on the amount of user comments and shares, as proposed by De Vries et al. (2012) and Cvijikj and Michahelles (2013).
This article contributes to broaden the understanding of social media marketing communication practices in the context of HEIs, as it presents in detail empirical evidence on the timing of posts and types of media practiced by ACAFE institutions. In the research, it was possible to confirm the effect of the characteristics of Facebook posts (specifically, interactivit y and vividness) on users’ engagement, in terms of likes, comments and shares. This confirms theoretical propositions and empirical findings in the literature (De Vries et al., 2012; Cvijikj & Michahelles, 2013; Ji et al., 2019). Furthermore, unlike previous studies on the topic – which have analyzed the performance of Facebook posts in the context of manufacturing companies (Cvijikj & Michahelles, 2013; De Vries et al., 2012; Luarn et al., 2015) or in developed economies (Chua & Banerjee, 2015; Sabate et al., 2014) -, the present study investigated the theme in the context of the higher education institution, and in a Latin American country.
In terms of management recommendations, this study presents the main Facebook marketing communication practices employed by ACAFE HEIs in the State of Santa Catarina, as well as their effects on user engagement. Along this line, community HEI marketing managers should be able, based on the results herein presented, to evaluate the effectiveness of their Facebook posting practices (with regard to interactivity and vividness). Practitioners may identify opportunities for improvement and best practices in light of users’ engagement. In addition, based on the findings of this research, marketing managers may choose to invest in the practice of moderately interactivity and vividness posts, in order to leverage the amount of likes and comments from users on Facebook pages.
Lastly, there is a need to conduct new research on this subject in the context of HEIs, as suggested by Assimakopoulos et al. (2017). In methodological terms, it is proposed to use more representative sampling procedures, during a longer collection period and observe HEI post practices in other social media (such as Twitter, YouTube and Instagram). It is also suggested that the effects of media type characteristics (such as interactivity and vividness) on user engagement be analyzed using other statistical methods, such as simultaneous equation modeling, as well as to consider that users usually have simultaneous reactions to posts (Sabate et al., 2014; Ji et al., 2019). As the findings so far are still inconclusive, we consider that the scientific knowledge on the subject is not yet consolidated. Accordingly, new studies on the subject may analyze other variables not considered in this research – such as text size, the practice of sponsored (paid) posts, and the posts associated with digital influencers.
References
ACAFE – Associação Catarinense das Fundações Educacionais (2019). Conheça a ACAFE. Recuperado em 28 setembro, 2019, de http://www.new.acafe.org.br/acafe/acafe.
Almeida, R., Figueiredo, K., & Maciel, C. (2015). Proposta de diretrizes para a integração de mídias sociais para instituições de ensino superior. In Proceedings of the 6th Workshop on Human- Computer Interaction Aspects for the Social Web (Vol. 14, pp. 1-9).
Antunes, A. (2011). A utilização de redes sociais como estratégia de Marketing nas instituições de ensino superior público: estudo de caso (Master’s thesis, FEUC).
Araujo, R. (2018). Marketing científico digital e métricas de mídias sociais: indicadores-chave de desempenho de periódicos no Facebook. Informação & Sociedade: Estudos, 28(1).
Assimakopoulos, C., Antoniadis, I., Kayas, O., & Dvizac, D. (2017). Effective social media marketing strategy: Facebook as an opportunity for universities. International Journal of Retail & Distribution Management, 45(5), 532-549.
Bocconcelli, R., Cioppi, M., Fortezza, F., Francioni, B., Pagano, A., Savelli, E., & Splendiani, S. (2018). SMEs and marketing: a systematic literature review. International Journal of Management Reviews, 20(2), 227-254.
Brasil, Presidência da República. Secretaria de Comunicação Social (2016). Pesquisa brasileira de mídia 2015: hábitos de consumo de mídia pela população brasileira. Brasília, Secom.
Brasil, Presidência da República. Casa Civil (2013). Lei nr. 12.881, de 12 de novembro de 2013. Brasília, Secom.
Brookes, E. (2010). The anatomy of a Facebook post: study on post-performance by type, day of the week, and time of day. Vitrue Inc.
Chauhan, K., & Pillai, A. (2013). Role of content strategy in social media brand communities: a case of higher education institutes in India. Journal of Product & Brand Management, 22(1), 40-51
Chua, A., & Banerjee, S. (2015). How businesses draw attention on Facebook through incentives, vividness and interactivity. IAENG International Journal of Computer Science, 42(3), 275-281.
Coviello, N., Milley, R., & Marcolin, B. (2001). Understanding IT-enabled interactivity in contemporary marketing. Journal of interactive marketing, 15(4), 18-33.
Cvijikj, I., & Michahelles, F. (2013). Online engagement factors on Facebook brand pages. Social Network Analysis and Mining, 3(4), 843-861.
Denzin, N., & Lincoln, Y. (Eds.). (2011). The Sage handbook of qualitative research. Sage.
De Vries, L., Gensler, S., & Leeflang, P. (2012). Popularity of brand posts on brand fan pages: An investigation of the effects of social media marketing. Journal of Interactive Marketing, 26(2), 83- 91.
De Vries, L., Gensler, S., & Leeflang, P. S. (2017). Effects of traditional advertising and social messages on brand-building metrics and customer acquisition. Journal of Marketing, 81(5), 1-15.
Duffett, R. (2017). Influence of social media marketing communications on young consumers’ attitudes. Young Consumers, 18(1), 19-39.
Durbin, J. (1970). Testing for serial correlation in least-squares regression when some of the regressors are lagged dependent variables. Econometrica: Journal of the Econometric Society, 38(3), 410-421.
Fagerstrøm, A., & Ghinea, G. (2013). Co-creation of value in higher education: using social network marketing in the recruitment of students. Journal of Higher Education Policy and Management, 35(1), 45-53.
Flick, U. (2018). Designing qualitative research. Sage.
Fujita, M., Harrigan, P., & Soutar, G. (2017). A netnography of a university’s social media brand community: Exploring collaborative co-creation tactics. Journal of Global Scholars of Marketing Science, 27(2), 148-164.
Haneline, M. T., & Young, M. (2009). A review of intraexaminer and interexaminer reliability of static spinal palpation: a literature synthesis. Journal of Manipulative and Physiological Therapeutics, 32(5), 379-386.
Isohella, L., Oikarinen, E., Saarela, M., Muhos, M., & Nikunen, T. (2017). Perceptions of digital marketing tools in new microenterprises. In Management Challenges in a Network Economy: Proceedings of the MakeLearn and TIIM International Conference (pp. 85-95).
Ji, Y., Chen, Z., Tao, W., & Li, Z. (2019). Functional and emotional traits of corporate social media message strategies: Behavioral insights from S&P 500 Facebook data. Public Relations Review, 45(1), 88-103.
Kaplan, A., & Haenlein, M. (2010). Users of the world, unite! The challenges and opportunities of Social Media. Business Horizons, 53(1), 59-68.
Kozinets, R. (2015). Netnography: redefined. London: Sage.
Kumar, A., Bezawada, R., Rishika, R., Janakiraman, R., & Kannan, P. K. (2016). From social to sale: The effects of firm-generated content in social media on customer behavior. Journal of Marketing, 80(1), 7-25.
Luarn, P., Lin, Y., & Chiu, Y. (2015). Influence of Facebook brand-page posts on online engagement. Online Information Review, 39(4), 505-519.
Malhotra, A., Malhotra, C., & See, A. (2013). How to create brand engagement on Facebook. MIT Sloan Management Review, 54(2), 18-20.
Mondini, L., De Souza Domingues, M., Correia, R., & Mondini, V. (2012). Redes sociais digitais: uma análise de utilização pelas instituições de ensino superior do sistema ACAFE de Santa Catarina. Revista Eletrônica de Ciência Administrativa, 11(1), 48-60.
Pereira, D., & Borges, M. (2011). Mídias sociais e instituições de ensino: uma ponte entre a escola e seus públicos. In Brazilian Symposium on Computers in Education (Simpósio Brasileiro de Informática na Educação-SBIE).
Peruta, A., & Shields, A. (2017). Social media in higher education: understanding how colleges and universities use Facebook. Journal of Marketing for Higher Education, 27(1), 131-143.
Ryan, D. (2016). Understanding digital marketing: marketing strategies for engaging the digital generation. Kogan Page Publishers.
Sabate, F., Berbegal-Mirabent, J., Cañabate, A., & Lebherz, P. (2014). Factors influencing popularity of branded content in Facebook fan pages. European Management Journal, 32(6), 1001-1011.
Sarquis, A., Casagrande, J., De Morais, A., Ramos, M., & Monken, S. (2016). Mídias sociais como estratégia de marketing: estudo multicaso em instituições de ensino superior no Brasil. Revista ESPACIOS, 7(15).
Sarquis, A., Hoeckesfeld, L., Soares, J., Dias, A., & De Lima, M. (2017). Posicionamento de marca: estudo de casos em instituições comunitárias de ensino superior. Brazilian Journal of Management & Innovation, 5(1), 125-154.
Shareef, M., Mukerji, B., Dwivedi, Y., Rana, N., & Islam, R. (2019). Social media marketing: Comparative effect of advertisement sources. Journal of Retailing and Consumer Services, 46, 58- 69.
Steuer, J. (1992). Defining virtual reality: Dimensions determining telepresence. Journal of communication, 42(4), 73-93.
Soares, J., Hoeckesfeld, L., Sarquis, A., Casagrande, J., De Lima, M., & Cittadin, J. (2018). Análise da popularidade de conteúdo em mídias sociais. International Journal of Business Marketing, 3(2), 016-030.
Suryawardani, I., & Wiranatha, A. (2017). Digital Marketing in Promoting Events and Festivities. A case of Sanur Village Festival. Journal of Business on Hospitality and Tourism, 2(1), 159-167.
Varadarajan, R., & Yadav, M. (2009). Marketing strategy in an Internet-enabled environment: a retrospective on the first ten years of JIM and a prospective on the next ten years. Journal of Interactive Marketing, 23(1), 11-22.
Appendix A
Observation record form
| HEIName | Page link | CreationTime | N. of followers | ||||||
| Describe the name of the educational institution | Describe the Facebook page link | Note the time of existence (in years) | Write down how many followers (fans) of the page | ||||||
| FACEBOOKPOSTDATA | |||||||||
| Observationdate | Post link | Postdate | Posting Time | Mediatype | Engagement | ||||
| Day of theweek | Timeofday | Interactivity | Vividness | NumberofComments | Numberofshares | Numberof Likes | |||
| Describe the date of observation | Describe the post link | Describe the post date | Describe the day of the week that the post was performed. | Describe the time the post was performed | Describe null (if it contains text only), low (images), moderate (events and messages with text, images and links) or high (gifs and videos) | Describe null (if it contains status and images only), low (links directing to another site, blog or page), moderate (message requesting to visit another page, commenting and participating in contests / awards) or high (Messages containing quizzes or questions) | Describe the amount of comments | Describe the amount of shares | Describe the amount of likes |