Article
Received: 16 November 2022
Accepted: 11 January 2023
DOI: https://doi.org/10.29356/jmcs.v68i1.1906
Funding
Funding source: CONACYT
Contract number: A1-S-9671
Funding statement: The financial support from National Council of Science and Technology, Mexico (CONACYT), project A1-S-9671 is gratefully acknowledged.
Abstract: Microwave plasma - atomic emission spectrometry with multi-energy calibration (MP-AES-MEC) was used for the determination of four major elements in urine. In the family of atomic emission spectrometry, the distinctive features of MP-AES are: (i) nitrogen-based toroidal-shape plasma; (ii) good plasma tolerance to total solids; (iii) exceptionally low operating cost. On the other hand, due to relatively low plasma temperature, this technique is susceptible to spectral interferences and sample-to-sample fluctuating baseline is typical limitation, if previous acid digestion is not performed. MEC is a non-conventional quantification method, not requiring baseline correction and it has been selected in this work to achieve reliable determination of Na, K, Ca and Mg in simply diluted urine. The principle underlying MEC is the proportionality between signal intensity and analyte concentration, occurring at any emission line for given element. Accordingly, for each sample, only two solutions were prepared likewise in the one-point standard addition and two analytical runs were performed, yet four experimental points were generated for calibration according with the number of emission lines utilized. Based on the results obtained by analyzing urines from different subjects, the sample dilution fold was selected to adjust the analyte concentration below half of the calibration range (150 for K, 200 for Na, 50 for Ca and 25 for Mg), while the addition of standard was done roughly doubling natural concentration in the diluted sample. The evaluated instrumental limits of detection were: 0.009 ± 0.005 mg L-1 for K, 0.131 ± 0.011 mg L-1 for Na, 0.050 ± 0.014 mg L-1 for Ca and 0.059 ± 0.010 mg L-1 for Mg (five replicates in different days). Each analysis was performed in triplicate yielding percentage relative standard deviation ( 11 %. The percentage recoveries calculated taking the results obtained in acid-digested samples by external calibration as reference values were in the range: 83.3-102 % for K, 88.4-110 % for Na, 82.9-113 % for Ca and 85.8-108 % for Mg. The capability of the proposed MP-AES-MEC procedure for monitoring four elements in different clinical conditions was demonstrated by analyzing ten urines from diabetic patients and ten from non-diabetic control subjects; statistical differences between these two groups was found for Na and K.
Keywords: Microwave plasma - atomic emission spectrometry (MP-AES), multi-energy calibration (MEC), urine, diabetes.
Resumen: La espectrometría de emisión atómica con excitación en plasma de microondas y con el método de calibración multi-energéa (MP-AES-MEC) fueron empleados para la determinación de cuatro elementos mayoritarios en orina. Dentro de la familia de técnicas de espectrometría de emisión atómica, las características distintivas de MP-AES son las siguientes: (i) uso de plasma de nitrógeno con geometría toroidal; (ii) buena tolerancia del plasma a sólidos totales; (iii) excepcionalmente bajo costo de operación. Por otra parte, debido a la relativamente baja temperatura del plasma, una típica limitación de esta técnica es que es susceptible a interferencias espectrales y la fluctuación de línea base entre muestras si estas no son digeridas previamente. El método MEC es un método de cuantificación no-convencional, el cual no requiere corrección de linea base y fue seleccionado en este trabajo para lograr la determinación confiable de Na, K, Ca and Mg después de una simple dilución de orina. MEC se sustenta en la proporcionalidad entre intensidad de la señal y la concentración del analito existente en cualquier linea de emisión de un elemento dado. Para cada una de las muestras, se prepararon dos soluciones, igual que en el método de un punto de adición de estándar y se realizaron dos corridas analíticas, pero se generaron cuatro puntos experimentales para la calibración, correspondientes a cuatro líneas de emisión seleccionadas por elemento. Con base en los resultados obtenidos analizando orinas de diferentes sujetos, el factor de dilución de la muestra fue seleccionado para ajustar la concentración del analito por debajo de la mitad del rango de calibración (150 para K, 200 para Na, 50 para Ca, 25 para Mg), mientras que la adición de estándar se realizó subiendo aproximadamente al doble la concentración natural en la muestra diluida. Los límites de detección instrumentales fueron: 0.009 ± 0.005 mg L-1 para K, 0.131 ± 0.011 mg L-1 para Na, 0.050 ± 0.014 mg L-1 para Ca, 0.059 ± 0.010 mg L-1 para Mg (con base en cinco réplicas realizadas en diferentes días). Cada análisis se realizó por triplicado, obteniéndose valores de desviación estándar relativa ( 11 %. Los porcentajes de recuperación calculados considerando los resultados obtenidos en muestras digeridas con ácido mediante calibración externa convencional como valores de referencia fueron los siguientes: 83.3-102 % para K, 88.4-110 % para Na, 82.9-113 % para Ca, 85.8-108 % para Mg. La capacidad del procedimiento MP-AES-MEC para monitorear cuatro elementos en diferentes condiciones clínicas se demostró analizando orinas de pacientes diabéticos y orinas de sujetos en un grupo control, encontrándose diferencias estadísticamente significativas para Na y K.
Palabras clave: Espectrometría de emisión atómica con excitación en plasma de microondas (MP-AES), calibración multi-energía (MEC), orina, diabetes.
Introduction
Sodium, potassium, calcium, and magnesium are major cationic urinary electrolytes; their monitoring serves for dietary intake control and as a diagnostic tool in many clinical conditions associated with osmotic balance, renal, muscle and heart functions, among others [1,2]. Given the importance of the four metals in human health and disease, their determination is performed in both, clinical and research laboratories. In routine practice, colourimetric assays, emission flame photometry, flame atomic absorption spectrometry or ion-selective electrodes are in use [3]. Despite meeting the requirements of simplicity, easy implementation, and automation in the analysis of a long series of samples, each of these assays has certain limitations mainly related to the lack of selectivity. For spectrophotometric determination of Ca and Mg, chelating agents such as EDTA, ortho-cresol phthalein or Arsenazo 3 are used; nevertheless, potential interferences must be eliminated by adding masking agents or by the application of multivariate analysis algorithms [4-6]. In the case of ion-selective electrodes, the test provides quantitative data on free ions (“ionized” Ca, Mg); however, the electrodes have a short lifetime, and the measurement is susceptible to interference from organic compounds and/or other ions present in the sample. As to flame emission photometry, it is used only for Na and K with the mandatory installation of interference filters, while the limitation of atomic absorption spectrometry is that only one signal can be acquired per analytical run. In the research laboratories, there is a clear preference for using advanced atomic spectrometry techniques since these are characterized by much greater selectivity, sensitivity and high detection power and are practically free of chemical interferences. Although low limits of quantification are not required for the determination of Na, K, Mg and Ca in clinical samples, the task remains challenging due to spectral and/or ionization interferences. Inductively coupled plasma ionization mass spectrometry (ICP-MS) is considered the gold standard in the determination of metals/metalloids, but it requires a complete mineralization of the sample and an efficient control of spectral interference (40Ar1H+ for K , 40Ar+ for Ca, 12C2+ for Mg, among many others)[7]. Another technique of interest in the analysis of the four metals is inductively coupled plasma - atomic emission spectrometry (ICP-OES); in this case, sample mineralization is also preferable since the plasma has a low tolerance to total solids and high loads of organic carbon; other obstacles include spectral interference [8].
Among the different types of atomic emission spectrometers available, the one using in-torch generated microwave plasma (MP-AES) is an interesting option for the determination of major and trace elements in biological samples [9-11]. The important features of MP-AES include: (i) low cost due to the use of nitrogen as a plasma gas; (ii) toroidal-shape plasma; (iii) better plasma tolerance to total solids and organic solvents as compared to ICP; (iv) similar detection power as ICP-AES [9]. On the other hand, due to the lower temperature of microwave plasma, spectral interferences and noisy baseline are typical inconveniences in MP-AES [10,12]. To avoid analytical errors due to the baseline fluctuations often occurring between the samples, acid digestion is highly recommended prior to instrumental analysis. It is noteworthy however that few non-conventional quantification methods, such as multi-energy calibration (MEC) [13] or standard dilution analysis (SDA) [14], do not require baseline correction and provided interference-free results in the analysis of simply diluted samples [10,15].
MEC can be performed in any analytical technique, in which one analyte produces various signals in a single analytical run and several studies informed its successful applications in atomic emission spectrometry [10,13,15,16]. Nonetheless, to the best of our knowledge, there has been only one application of MEC in MP-AES reported so far, in which the determination of Na, K, Mg and Ca in wine was achieved [10]. The rationale underlying MEC in AES is that the relative distribution of spectral lines intensities for given element is constant, independently of element concentration and is determined by specific transition energy, transition probability and excited-state degeneracy related with each line. On the other hand, for each emission line, its intensity is proportional to the analyte concentration in the analyzed sample; therefore, when the sample is prepared as for one-point standard addition, ratios between signals magnitudes acquired at each wavelength are different yet always proportional to the ratio of analyte concentrations in two solutions (sample without and with standard addition). In practice, quantification is performed based on the concentration of added standard and using the slope of the linear regression function, which relates signals intensities acquired in the spiked and non-spiked sample at different wavelengths [13] (respective mathematical equations Eq1S-5S are presented in Supporting Information, SI). It should be stressed that with only two solutions prepared per sample, the number of experimental points used to compute the linear regression function corresponds to the number of emission lines where the signals were acquired [10,13,17]. An additional advantage of MEC is its ability for the detection of wavelengths affected by spectral interferences, since the respective experimental points would present deviation from the linearity of the calibration curve relating intensities of the analyte signals in the spiked and non-spiked samples.
In this work, the interference-free determination of Na, K, Ca, and Mg in urine is proposed, using MP-AES and multi-energy calibration eliminating the requirement for sample digestion and baseline correction.
Experimental
Reagents and samples
All chemicals were of analytical reagent grade. Deionized water (18.2 M( cm, Labconco) was used throughout; ultrapure concentrated nitric acid was from Fluka. The standard solutions of Na, K, Ca (1000 mg L-1 each) and Mg (1015 mg L-1) were from Sigma.
The first morning urine samples from ten diabetic patients (D1-D10) and from ten non-diabetic control subjects (C1-C10) were kindly provided by Dra. Ma. E. Garay-Sevilla from the Department of Medical Sciences, University of Guanajuato. The samples were collected in acid-washed 50 mL Falcon tubes; after acidification with ultrapure nitric acid (final concentration 2 % v/v), the tubes were stored at -20 °C. Prior to the analysis, urine samples were thawed and centrifuged (13 000 g, 10 min). Urine from four volunteers (V1-V4) was used for setting the experimental and instrument operating parameters.
Instrumentation and operating conditions
An Agilent 4100 MP-AES atomic emission spectrometer equipped with autosampler SPS3, concentric nebulizer for 4100 MP-AES, a single-pass glass cyclonic spray chamber and controlled by Agilent MP Expert Software (actualized from MP-AES 4200) was used.
For univariate calibration, the instrumental operating conditions were as follows: pump rate of 15 rpm, nitrogen pressure of 140 kPa for Na, K, 200 kPa for Mg and 240 kPa for Ca; plasma viewing position set at 10 for K, Ca, Mg and -5 for Na; stabilization time of 15 s and integration time of 5 s; wavelengths: Na 589.592 nm, K 766.491 nm, Ca 422.673 nm, Mg 285.213 nm. Auto background correction was applied, and for each element, the analytical signal was acquired as peak height (instrumental conditions given in the previous section).
For multi-energy calibration (MEC), the instrumental conditions were not modified except that no baseline correction was applied. The spectral lines were: 330.237 nm, 568.820; nm, 588.995 nm, and 589.592 nm for Na; 693.877 nm, 766.491 nm, 769.897 nm and 344.738 nm for K; 393.366 nm, 396.847 nm, 422.673 nm, and 430.253 nm for Ca; 279.553 nm, 280.271 nm, 285.213 nm and 518.360 nm for Mg. For each diluted sample, all analytical signals corresponding to different wavelengths were acquired in a single run.
Sample digestion and quantification by external calibration (MP-AES-EC)
Multielement standard solutions were prepared in 2 % v/v nitric acid, which was also used as a blank. Six-point calibration covered the concentration ranges: 1.0 - 15 mg L-1 for Na and K; 0.2 - 2.5 mg L-1 for Ca and Mg.
Sample digestion was performed by heating 0.5 mL aliquot of thawed urine with 0.5 mL of nitric acid (90 °C, 2h) and leaving the samples to reach room temperature. The volume was brought to 5 mL in a volumetric flask. An aliquot of each digest was centrifuged in a new 2 mL Eppendorf tube (13 000 g, 10 min) and appropriately diluted with 2 % v/v nitric acid: 10 - 100 times for Na, 10 - 50 times for K, up to 20 times for Ca and Mg.
Each sample were analyzed in triplicate.
Sample dilution and quantification by multi-energy calibration (MP-AES-MEC)
Each urine sample was appropriately diluted and then, the solutions M and M+S were prepared. To do so, 2 mL aliquot of initially diluted sample was mixed with 2 mL of with nitric acid 2 % v/v (solution M) whereas another 2 mL aliquot of diluted sample was mixed with 2 mL of nitric acid containing analyte standard (solution M+S). The total dilution fold was selected to adjust the analyte concentration approximately below the middle of the calibration range and standard addition was performed roughly doubling the natural concentration in the diluted sample. Using four wavelengths per element and instrument operating conditions listed in section of Instrumentation and operating conditions, spectra for M and for M+S were acquired without background correction. Linear regression equation was computed for each analyte, relating the signals obtained for two solutions at each selected wavelength. The analyte concentration in the sample (cA,s ) was calculated as explained in SI (Equations 1S-5S) [13,15,16,18], according with the following equation:
where cA,std is the concentration of analyte standard added (solution M+S) and m’ is the slope of the linear regression function mentioned above.
Each sample were analyzed in triplicate.
Statistical analysis
The determination results are means obtained for three independent replicates with respective standard deviations. Statistical unpaired t-test for independent samples was used to compare the concentrations of four elements in urines from diabetic patients against non-diabetic control subjects. To ensure normal data distribution, the concentration values were transformed to natural logarithms for Na, K and Mg and to square roots for Ca. The software used was Microsoft Excel 2010 and statistical significancy was set at p <0.05.
Results and discussion
In the preliminary experiments it was observed that diluted samples could not be used for elements determination using conventional external calibration; even setting manually background correction individually per each sample, the results were inconsistent with those obtained after acid digestion. The goal of this work was to demonstrate the feasibility of multi-energy calibration (MEC) for interference-free determination of four major elements in urine by MP-AES, avoiding sample digestion and troublesome baseline correction. The attractiveness of such approach lies in the procedural simplicity: only two solutions per sample need to be prepared and two instrumental runs are performed, yet the number of experimental points obtained for computing linear regression function is higher compared to typical one-point standard addition and corresponds to the number of spectral wavelengths selected per given element. It should also be stressed that the same chemical environment of the analyte is preserved in each measurement likewise in the method of standard addition; further, spectral lines affected by interferences can be detected and removed, based on the deviation of corresponding experimental point from the linear regression fit [10,13,15]. In setting-up the MP-AES-MEC procedure, several parameters had to be established; among them, the dilution factor, the concentration of standard added to the sample, the spectral lines and instrument operating conditions. In the next step, analytical performance of the proposed procedure was evaluated, and the results obtained by MP-AES-MEC in diluted urine samples were compared against those attained after acid digestion using typical external calibration (MP-AES-EC). Finally, to demonstrate the procedure utility in the real-world scenarios, the determination of four elements in urines from diabetic patients and non-diabetic control subjects was performed. In the following sections, the above-mentioned points are described in detail.
Setting-up the MP-AES-MEC procedure
The emission lines for K, Na, Mg and Ca were adopted from previous studies [10,15] and these lines are listed in the Experimental section. The selection criteria were: (i) sufficiently high sensitivity enabling for acquisition of analyte signals in M and M+S solutions and (ii) lack of spectral interferences. Instrument operating parameters were not modified from those used for external calibration; however, no baseline correction was applied. As already mentioned before, the dilution factor and the concentration of added standard had to be selected for each element. The assumption was to lower natural analyte concentration upon sample dilution to fit in the lower part of the calibration range and to double this concentration after standard addition. To verify the correctness of this proposal, four urines from volunteers (V1-V4) were acid-digested and the elements were determined by external calibration (analytical parameters evaluated in the calibration process are presented in Table 1S, SI). The results obtained for V1-V4 samples are presented in Table 1 together with the dilution factors proposed for multi-energy calibration. Accordingly, the analyte concentrations in any diluted sample (M) corresponded to about 4 mg L-1 for Na and K; 0.4 mg L-1 for Ca and 0.25 mg L-1 for Mg. The final concentrations of standard added to prepare solutions M+S were set at 8.0 mg L-1 for Na, 6.5 mg L-1 for K, 1.5 mg L-1 for Ca and 0.8 mg L-1 for Mg. Using the above-selected variables, MEC was performed, and the results obtained are included in Table 1. Large differences among concentrations found in four samples, especially for Na and K, should be ascribed to their recent dietary intake; indeed, the samples were randomly obtained from healthy volunteers and did not correspond to the first morning urine. On the other hand, it can be observed in Table 1 that linear regression functions relating analyte signal intensities acquired for M and M+S solutions at different spectral lines presented excellent linearity (R2 ( 0.999); the slope of this function (m’) was used to compute analyte concentration in the sample (Eq. 1 and Eq.1S-5S in SI). Most importantly, considering the results obtained by EC as reference values, the percentage error of those attained by MEC with respect to EC was in the range (-1.6) - 11 % for K, 7.0 - 19 % for Na, (-6.7) - (-17) % for Ca and (-7.1) - 18 % for Mg; such consistency is indicative of acceptable accuracy of the proposed procedure consisting on simple sample dilution and MP-AES-MEC. It is noteworthy that errors of ( 20% were reported in the study by Barros et al., where Na, K, Ca and Mg were determined in urine by MEC, but the analytical technique was inductively coupled plplasma-atomicmission spectrometry (ICP-AES) and not MP-AES [15]. As emphasized in the Introduction, nitrogen plasma is used in MP-AES, which makes this technique much cheaper with respect to any other atomic spectrometry technique; however, lower plasma temperature causes higher susceptibility of MP-AES to interferences compared to inductively coupled argon plasma. Therefore, achieving reliable quantification in simply diluted biological samples is more challenging and the results presented in Table 1 confirm the feasibility of MEC for such purpose.
Concentrations of four elements in urine from volunteers (V1-V4), determined in acid-digested samples using external calibration (MP-AES-EC) and in diluted samples using multi-energy calibration (MP-AES-MEC). Means and standard deviations are presented, based on three replicates.
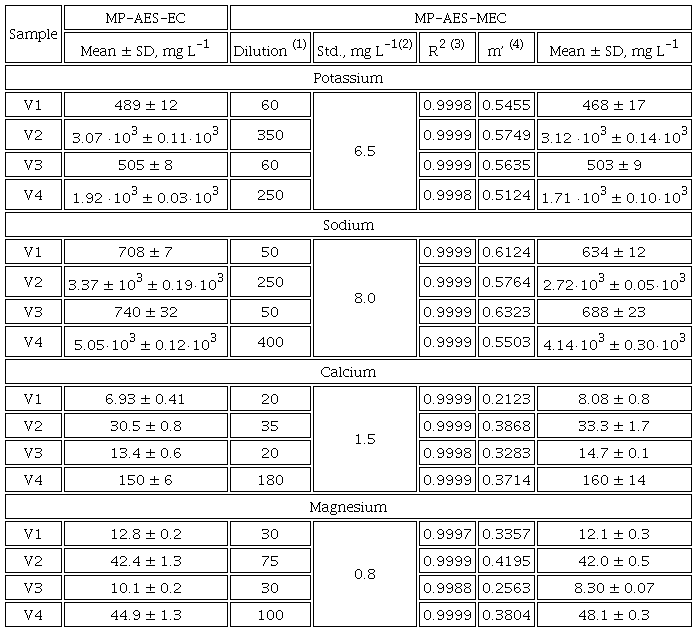
(1)urine dilution factor corresponds to the final solution prepared for multi-energy calibration (solution M); (2) concentration of the added standard in the final solution used in MEC (M+S); (3)regression coefficient on the above function; (4)slope of linear regression relating signal intensities in M and M+S solutions at different spectral lines, the presented value is a mean from three replicates (Eq. 1).
The limits of detection (LOD) for MP-AES-MEC were assessed as reported elsewhere [19,20]. Specifically, blank equivalent concentrations (BEC) were evaluated by taking blank solution as a sample and performing MEC; according with IUPAC's recommendations, limit of detection (LOD) corresponded to three-times multiplied BEC. In five replicates, the obtained LOD values were: 0.009 ± 0.005 mg L-1 for K, 0.131 ± 0.011 mg L-1 for Na, 0.050 ± 0.014 mg L-1 for Ca and 0.059 ± 0.010 mg L-1 for Mg. Comparing with external calibration, LOD values for MEC were lower for Na and K and similar for Ca and Mg (Table 1S, SI). On the other hand, LOD obtained for MP-AES-MEC were similar to those previously reported for ICP-AES-MEC (0.070 mg L-1 K, 0.120 mg L-1 Na, 0.015 mg L-1 Ca and 0.043 mg L-1 Mg) [15].
Analysis of the real-world samples
To explore the capability of the proposed MP-AES-MEC procedure in monitoring urine levels of four major elements in different clinical conditions, ten samples from diabetic patients and ten from non-diabetic control group were analyzed. In the first place, the samples were acid-digested, and the determination was carried out by external calibration. Based on the obtained data, dilution factors were set and MEC was performed using already established standard additions (8.0 mg L-1 Na, 6.5 mg L-1 K, 1.5 mg L-1 Ca and 0.8 mg L-1 Mg). In Table 2S (SI), dilution factors, m’ and R2 values are provided for each sample whereas in Figures 1 and 2, linear regression functions relating intensities acquired in M and M+S for K, Na, Ca and Mg in sample C1 are presented together with spectra registered for both solutions at different spectral lines. The concentrations of four analytes found in urine samples by MP-AES-EC and MP-AES-MEC are given in Table 3S (SI). It should be stressed that precision, evaluated as percentage relative standard deviation in three replicates, did not exceed 5 % for Ca, 6 % for K and Mg, 9 % for Na using external calibration. For MEC, slightly poorer precision was obtained, yet percentage RSD was always below 11 % (Table 3S, SI). Further, percentage recoveries were calculated for MEC, taking the results obtained in acid-digested samples by MP-AES-EC as “reference” values. As can be observed in Table 3S (SI), the obtained recoveries were in the range 83.3-102 % for K, 88.4-110 % for Na, 82.9-113 % for Ca and 85.8-108 % for Mg. In this part of the study, MEC was performed adjusting dilution factors individually for each sample, based on the concentration determined previously by EC. Such approach is of no use when large number of samples need be analyzed; however, more uniform dilution factors can be proposed based on the obtained results, namely 150 for K, 200 for Na, 50 for Ca and 25 for Mg. With such uniformized dilution rates, practically for all samples the analyte concentration falls in the lower range of the calibration and still, the proposed standard additions are adequate.
Concentrations of four elements determined by proposed MP-AES-MEC procedure in urine from diabetic patients (D1-D10) and from non-diabetic control subjects (C1-C10). Mean values based of three replicates of each sample are presented (respective standard deviations are provided in Table 3S, SI), means and median per group and the results of unpaired t-test comparing two groups are included in the bottom rows.
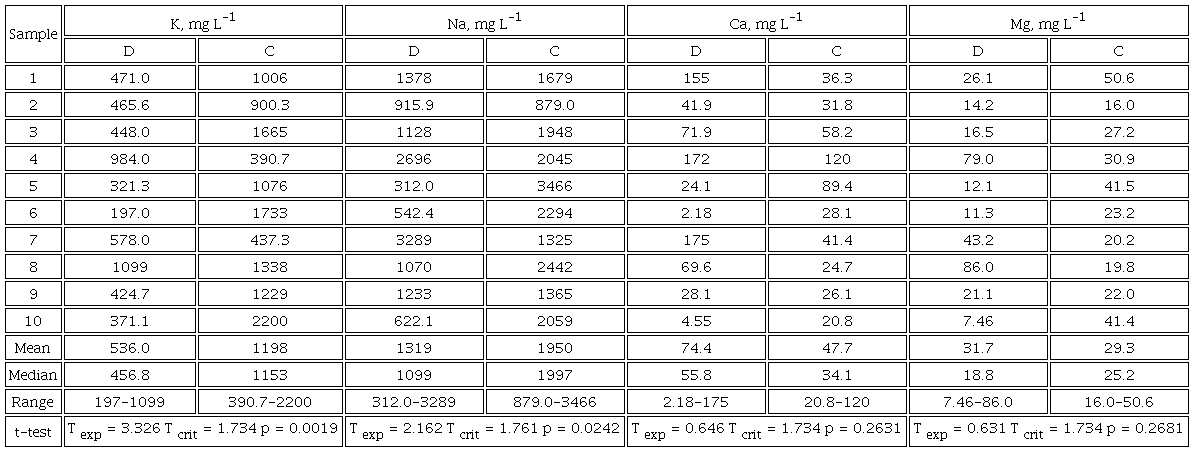
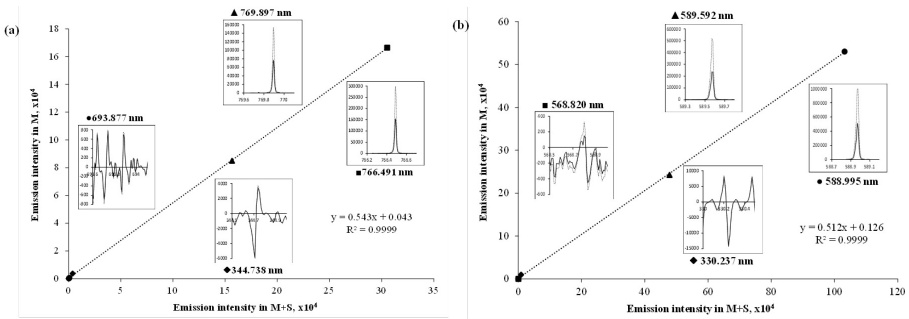
Fig. 1
Linear regression functions relating intensities acquired in solutions M and M+S prepared for sample C1; inserts show emission spectra registered for both solutions at different spectral lines: (a) potassium; (b) sodium.
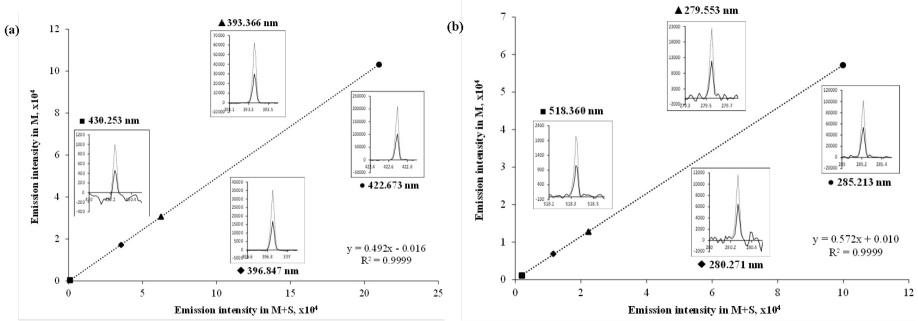
Fig. 2
Linear regression functions relating intensities acquired in solutions M and M+S prepared for sample C1; inserts show emission spectra registered for both solutions at different spectral lines: (a) calcium; (b) magnesium.
Mean urine concentrations of four elements in diabetic and in control samples are presented in Table 2 together with means, medians and ranges calculated for each group. Noteworthy is that the almost all results fall within the reference ranges set for random healthy individuals considering different ages and genders yet without restriction of dietary intake: 460 - 4600 mg L-1 for Na, 430 - 6000 mg L-1 for K, 5.0 - 380 mg L-1 for Ca and 6.0 - 230 mg L-1 for Mg [3]. Further, the concentrations determined in this work for control group (Table 2) are consistent with the ranges reported in healthy Pakistan adults for Ca and Mg (39.6 - 78.2 mg L-1 and 42.9 - 82.1 mg L-1, respectively [21]) whereas a tendency toward lower values in this study can be noted for Na and K (3155 - 4039 mg L-1, 1124 - 2068 mg L-1 K, respectively [21]). On the other hand, while comparing the values obtained for diabetic patients against control subjects, means and medians presented in Table 2 are lower for K and Na and higher for Ca in diabetic urines with no apparent change observed for Mg. In the bottom raw of Table 2, the results of unpaired t-test are shown, indicating that differences for Na and K were statistically significant. In line with the above observations, dysregulation of the major electrolytes urinary excretion has been reported in diabetes, cardiovascular and renal disorders [22]. In particular, the decrease of urinary K levels is well-documented in diabetes, as well as in chronic kidney disease and in cardiovascular diseases [23,24]. In turn, lower sodium concentrations might be indicative of reduced dietary intake in diabetic as compared to healthy subjects [25]; despite clear advantage of lowering blood pressure, several adverse effects of restricted sodium intake and its low urinary levels were discussed, including the increased LDL cholesterol and reduced peripheral insulin sensitivity, among others [25]. When urine electrolytes are monitored, sodium-to-potassium ratio is often reported in relation to dietary intake and blood pressure control [26]; direct association between this parameter and diabetes and renal failure incidence has also been informed [27,28]. In this work, mean sodium-to-potassium ratio was evaluated as 2.5 in diabetic patients and 2.1 in the control group, which is consistent with the above-mentioned effects. Finally, a tendency toward higher urine concentrations of Ca in diabetic urines seems to confirm previously reported loss of Ca due to deterioration of skeletal system and due to dysregulation of the vitamin D pathway, both associated with diabetes [29]. Within the context of the present work, the obtained results and the above discussion support the capability of the proposed procedure for detecting concentration differences of major urine elements in different clinical conditions hence its suitability for routine monitoring purposes.
Conclusions
In this work, the feasibility of multi-energy calibration for the determination of Na, K, Ca and Mg in urine by microwave plasma - atomic emission spectrometry has been demonstrated. Specific benefits of the proposed MP-AES-MEC procedure are as follows: (i) simple sample pretreatment consisting of urine dilution with nitric acid 2% v/v; (ii) no need for baseline correction; (iii) chemical matrix of the sample present in all measurements; (iv) two solutions per sample prepared as in one-point standard addition (M and M+S, respectively) and two analytical runs performed, yet four experimental points generated for linear regression function enhancing the quality of linear fit. Four emission lines were selected for each element, the dilution factors were proposed (150 for K, 200 for Na, 50 for Ca, 25 for Mg) to adjust analyte concentration in solution M corresponding to the lower part of calibration range and standard additions used to prepare solution M+S roughly doubled the natural analyte concentration (8.0 mg L-1 Na, 6.5 mg L-1 K, 1.5 mg L-1 Ca, 0.8 mg L-1 Mg). The instrumental limits of detection were similar as those evaluated for conventional external calibration and acceptable precision was obtained for the real-world samples (RSD ( 11% based on triplicate analysis). The results obtained by the proposed procedure in urine samples did not present statistical differences as compared to the concentrations determined in acid-digested sample using conventional external calibration (ANOVA, p < 0.05). In application of the proposed procedure to the analysis of urine from diabetic patients and from non-diabetic control subjects, statistically lower K and Na concentrations were found in diabetic samples confirming that the sensitivity of MP-AES-MEC allows for detecting differences of major urine electrolytes in different clinical conditions.
Acknowledgements
The financial support from National Council of Science and Technology, Mexico (CONACYT), project A1-S-9671 is gratefully acknowledged.
References
Maciel, A. T.; Vitorio, D.; Osawa, E. A. Front. Med. 2022, 9, 2186. DOI: https://doi.org/10.3389/fmed.2022.912877.
Moulin, F.; Ponte, B.; Pruijm, M.; Ackermann, D.; Bouatou, Y.; Guessous, I.; Ehret, G.; Bonny, O.; Pechère-Bertschi, A.; Staessen, J. A.; Paccaud, F.; Pierre-Yves, M.; Burnier, M.; Vogt, B.; Devuyst, O.; Bochud, M. Kidney Int. 2017, 92, 1536-1543.
Tietz, N. W. Tietz Clinical Guide to Laboratory. Elsevier, St. Louis MO, 1995.
Bazydlo, L. A.; Needham, M.; Harris, N. S. Lab. Med. 2014, 45, e44-e50.
Wróbel, K.; Wróbel, K.; López-de-Alba, P. L.; López-Martínez, L. Anal. Lett. 1997, 30, 717-737.
Parentoni, L. S.; Pozeti, R. C. S.; Figueiredo, J. F.; Faria, E. C. D. J. Braz. Patol. Med. Lab. 2001, 37, 235-238.
Agatemor, C.; Beauchemin, D. Anal. Chim. Acta 2011, 706, 66-83.
Krejcova, A.; Cernohorsky, T.; Curdova, E. J. Anal. At. Spectrom. 2001, 16, 1002-1005.
Balaram, V. Microchem. J. 2020, 159, 105483.
Espinoza Cruz, T. L.; Guerrero Esperanza, M.; Wrobel, K.; Barrientos, E. Y.; Acevedo-Aguilar, F. J.; Wrobel, K. Spectrochim. Acta Part B. 2020, 164, 105754.
Gonzalez Ibarra, A. A.; Yanez Barrientos, E.; Wrobel, K.; Corrales Escobosa, A. R.; Wrobel, K. J Plant Nutr. 2022, 1-17. DOI: https://doi.org/10.1080/01904167.2022.2071733.
Jung, M. Y.; Kang, J. H.; Choi, Y. S.; Lee, J. Y.; Park, J. S. Food Chem. 2019, 274, 20-25.
Virgilio, A.; Gonçalves, D. A.; McSweeney, T.; Neto, J. A. G.; Nóbrega, J. A.; Donati, G. L. Anal. Chim. Acta. 2017, 982, 31-36.
Jones, W. B.; Donati, G. L.; Calloway Jr, C. P.; Jones, B. T. Anal. Chem. 2015, 87, 2321-2327.
Barros, A. I.; Pinheiro, F. C.; Nóbrega, J. A. Anal. Methods. 2019, 11, 3401-3409.
Machado, R. C.; Silva, A. B. S.; Donati, G. L.; Nogueira, A. R. A. J. Anal. At. Spectrom. 2018, 33, 1168-1172.
Donati, G. L.; Amais, R. S. J. Anal. At. Spectrom. 2019, 34, 2353-2369.
Tognoni, E.; Hidalgo, M.; Canals, A.; Cristoforetti, G.; Legnaioli, S.; Salvettia, A.; Palleschi, V. Spectrochim. Acta Part B. 2007, 62, 435-443.
Virgilio, A.; Gonçalves, D. A.; McSweeney, T.; Neto, J. A. G.; Nóbrega, J. A.; Donati, G. L. Anal. Chim. Acta. 2017, 982, 31-36.
Guerrero-Esperanza, M.; Wrobel, K.; Wrobel, K.; Ordaz-Ortiz, J. J. J. Food Compos. Anal. 2023, 115, 104963.
Afridi, H. I.; Kazi, T. G.; Kazi, N.; Jamali, M. K.; Arain, M. B.; Jalbani, N.; Sarfaraz, R. A.; Shah, A.; Kandhro, G. A.; Shah, A. Q.; Baig, J. A. Biol. Tr. Elem. Res. 2008, 124, 206-224.
Liamis, G.; Evangelos, L.; Fotios, B.; Moses, E. World J. Clin. Cases. 2014, 2, 488-496.
Kim, H. W.; Park, J. T.; Yoo, T. H.; Lee, J.; Chung, W.; Lee, K. B.; Chae, D. W.; Ahn, C.; Kang, S. W.; Choi, K. H.; Han, S. H. Clin. J. Am. Soc. Nephrol. 2019, 14, 330-340.
Araki, S.; Haneda, M.; Koya, D.; Kondo, K.; Tanaka, S.; Arima, H.; Kume, S.; Nakazawa, J.; Chin-Kanasaki, M.; Ugi, S.; Kawai, H.; Araki, H.; Uzu, T.; Maegawa, H. Clin. J. Am. Soc. Nephrol. 2015, 10, 2152-2158.
Ekinci, E. I.; Clarke, S.; Thomas, M. C.; Moran, J. L.; Cheong, K.; MacIsaac, R. J.; Jerums, G. Diabetes Care 2011, 34, 703-709.
Perez, V.; Chang, E. T. Adv. Nutr. 2014, 5, 712-741.
Siddiqui, K.; Nahla, B.; Scaria Joy, S. The Scientific World Journal 2014, ID 461591. DOI: http://dx.doi.org/10.1155/2014/461591.
Hattori, H.; Hirata, A.; Kubo, S.; Nishida, Y.; Nozawa, M.; Kawamura, K.; Hirata, T.; Kubota, Y.; Sata, M.; Kuwabara, K.; Higashiyama, A.; Kadota, A.; Sugiyama, D.; Miyamatsu, N.; Miyamoto, Y.; Okamura, T. Int. J. Environ. Pub. Health 2020, 17, 5811. DOI: https://doi.org/10.3390/ijerph17165811.
Carnevale, V.; Romagnoli, E.; D'Erasmo, E. Diabetes/Metab. Res. Rev. 2004, 20, 196-204.
Author notes
*Corresponding author: katarzyn@ugto.mx; Phone: +52 473 7327555.
