Industrial and Systems Engineering
Cellular manufacturing system selection with multi-lean criteria, optimization and simulation
Selección de sistemas de manufactura celular con múltiples criterios lean, optimización y simulación
Cellular manufacturing system selection with multi-lean criteria, optimization and simulation
Ingeniería y Universidad, vol. 21, no. 1, pp. 1-16, 2017
Pontificia Universidad Javeriana

This work is licensed under Creative Commons Attribution 4.0 International.
Abstract: This study proposes a method to design and balance a cellular manufacturing system of a typical industrial company to obtain an optimal configuration in terms of the process, total cost, idle time and reliability criteria. The developed method has three phases. The first phase obtains candidate solutions using optimization models to minimize the cycle time and total cost. In the second phase, the performance measures for the remaining criteria of each candidate solution are found using discrete-event simulation. In the last phase, the optimal configuration is selected using the analytic network process (ANP). The proposed method was validated with a practical case, where the optimal configuration had the best reliability with a zero-smoothness index, which minimized the wasted time and excess inventory. However, it was not the configuration with the lowest cost. This method has two contributing elements: multiple lean criteria and the approach, which combines different solution strategies to select the best configuration in an integral manner.
Keywords: cellular manufacturing, optimization, discrete-event simulation, analytic network process-ANP.
Resumen: Esta investigación propone una metodología para diseñar y balancear un sistema de manufactura celular de una empresa industrial típica con el propósito de obtener una configuración óptima bajo los criterios de, proceso, costo total, tiempo ocioso y confiabilidad. La métodología desarrollada tiene tres fases. La primera fase consiste en obtener soluciones candidatas usando modelos de optimización para minimizar tiempo de ciclo y costo total. En la segunda fase se encuentran las medidas de desempeño de los demás criterios para cada solución candidata utilizando simulación de eventos discretos. En la última fase, se escoge la configuración óptima utilizando el análisis de decisión multi-criterio ANP. La metodología propuesta fue validada en un caso práctico donde la mejor configuración encontrada tiene la mayor confiabilidad, un índice de suavidad de cero que minimiza el desperdicio de tiempo y el exceso de inventario, aunque no fue la configuración con menor costo. Esta metodología tiene dos elementos de contribución, el primero es que involucra multiples criterios lean y el segundo es el enfoque que combina diferentes estrategias de solución para la selección de la mejor configuración de una manera integral.
Palabras clave: Manufactura celular, optimización, simulación de eventos discretos, proceso de redes jerárquico-ANP.
1. Introduction
Lean manufacturing (LM) is a production philosophy that aims to reduce waste in a continuous improvement process, which involves principles, techniques, tools and measures [1]. Waste is an activity that does not aggregate value from the customer perspective [2]–[4]. The design of a cellular manufacturing system is notably important to LM because it increases the process flexibility and decreases the work in-process inventory (WIP) and flow time [5].
Cellular manufacturing is a system of different processes and resources that respond to a grouping principle. When a group of cells produces the same subproduct and it is delivered to another process, the resulting configuration can be considered an assembly line (AL) with parallel cells.
An assembly line is a manufacturing process, where the total amount of work is divided into tasks. The task area is organized into stations, which are usually arranged along a conveyor belt to form a line. Jobs are consecutively sent and moved from one station to another. At each station, the tasks are repeatedly performed [6]. Assembly lines are typically used in industrial companies with standardized customized products. One of the problems in this context is the assembly line balancing (ALBP), which consists of assigning tasks to an ordered sequence of stations so that the precedence relations of the tasks are satisfied and optimized under any performance measure [7], [8].
The ALBP can have different objective criteria. Ghosg and Gagnon [9] classified the objective criteria into two main categories: technical and economical. In the technical category, minimizing the number of stations for a required cycle time has been the most popular criterion. For the economical category, minimizing the labor cost or idleness cost has been the most selected criterion [10]. Most studies have focused on a solo criterion [11].
The ALBP with multiple objectives is called the MOALBP [12]. The objectives to balance a manufacturing system are frequently in conflict among themselves when different user requirements are considered [13]. Bukchin and Masin [14] designed a multi-objective assembly system using a Branch and Bound algorithm. Esmaeilbeigi et al. [15] formulated a mixed integer linear program for a simple ALBP to minimize different objectives. These studies [16]–[18] considered worker allocation with the balancing problem in their multi-objective model. Other techniques have been used for MOALBP, such as fuzzy programming [19],[20], evolutionary models [21]–[23], neural networks [24] and different metaheuristics [25]–[28].
The research works [29]–[32] used different lean measures to design manufacturing systems. Deif [33] developed a dynamic model for a lean manufacturing cell to study the leveled production performance. The authors [34] state that the flow time, cycle time, and work-in-process inventory level (WIP) are important measures. Their relationship in a production line is captured by Little’s Law.
The simulation technique enables one to capture the complexity of an actual system; thus, it is combined with optimization techniques to complement the analysis. Kabir and Tabucanon [35] used an analytic hierarchy process (AHP) and simulation to determine a specific configuration for a batch-model assembly system. Studies such as [36]–[39] used discrete-event simulation to analyze the scenarios of a manufacturing system and select a specific solution. Tiacci [40] developed an event simulator for different assembly line configurations. Mendes et al. [41] presented a mixed-model of an ALB case study using simulation models and heuristic procedures. Cappanera et al. [42] developed a mixed-integer programming model for surgical scheduling with respect to three performance criteria; then, its strength was evaluated with a discrete-event simulation model.
Both authors [43] [44] agree that the NP-Hard complexity of the parallel assembly line balancing problem makes its solution almost impossible using traditional techniques and if another criterion is considered. In this sense, this paper focuses on developing a method to design a cellular manufacturing system with parallel cells considering multi-lean measures, i.e., it is framed into an MOALBP. This approach is based on the optimization, simulation and multi-criteria decision analysis. Therefore, the method can be used in assembly industries to obtain an optimal configuration in an integral manner.
2. Proposed methodology approach
This study focuses on developing a methodology for a cellular manufacturing system with parallel cells, where the best configuration is selected among different types of cells and system balancing. The study focuses on an arrangement where there are a specific number of tasks with trained workers who accomplish the tasks in a required cycle time, which is set according to demand. It is desirable to know how to set each cell and how many cells for each type to use. The cycle time is the time between product outputs from two consecutive production lines, which represents the maximum amount of work processed by each station.
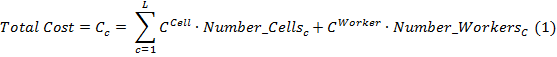
This approach must considers multiple objectives, which become the total cost. The total cost is defined as the cost of all workers and cells (See Ecuation1).
 [Ecuation1]
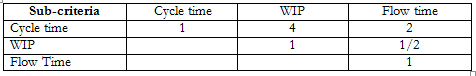
The multi-lean measures enable one to quantify the LM impact and guide the development of lean systems [45]. They are the process, idle time percentage and reliability. For the process, Little’s Law measures were selected (WIP, flow time and cycle time) because they enable an analysis of the process performance. The idle time percentage was used as a criterion because it is a measure of waste time. The reliability criterion was selected because having more cells mitigates the risk created by damages in a cell or defects in the materials and increases the process flexibility [46]. The reliability was measured as the number of cells, where 1 is the lower value, and the total number of cells is the maximum value.
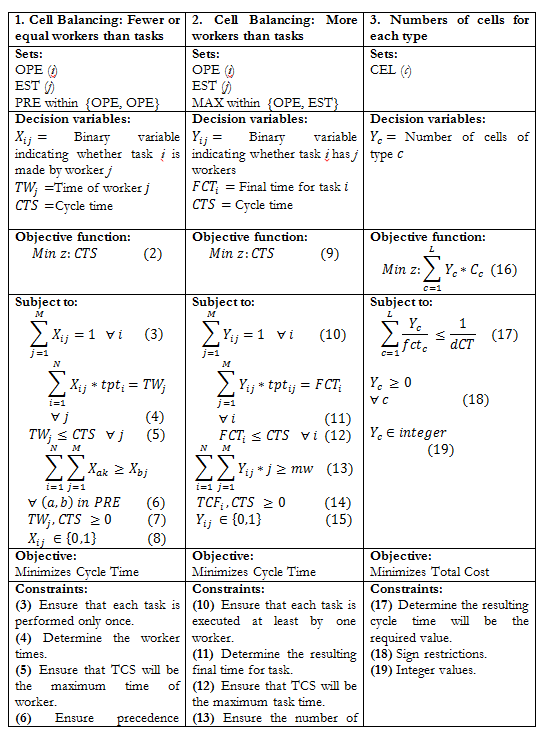
The methodological formulation consists of three phases (See Figure 1). The first phase is made of two integer linear programming models and one linear programming model to obtain candidate solutions to satisfy the required cycle time and minimize the total cost. In the second phase, a discrete-event simulation model is developed for each candidate solution, where the WIP, flow time and idle time percentage of each candidate solution are found. In the third and last phase, the multi-criteria decision analysis called Analytic Network Process (ANP) is applied to select the optimal solution. The phases are explained in detail below.
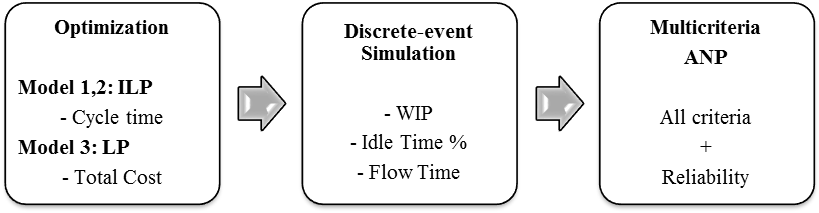
Figure 1
Criteria in the methodological phases
authors’ own elaboration
2.1 Phase 1. Mathematical optimization
In this phase, three mixed integer linear programming models were developed based on [47] [48] [49] and written in AMPL. The assumptions of the models are as follows:
-
The workers are multi-functional.
· The demand is known and constant over time.
· The task process times are known and constant over time for every worker.
· The movement times are known and constant over time.
Table 1 shows each model formulation. The first two models minimize the cycle time, and the third aims to minimize the cost. The first model considers fewer or equal number of workers than tasks to determine the task set for each worker to do to minimize the cycle time, assuming that there is at most one worker per task. For n tasks, the model is run for 1 to n workers to obtain n candidate solutions.
The second model eliminates the assumption of the first model to assign parallel workers to each task. This model is run for a different number of workers from n to nw and obtains nw-n+1 candidate solutions. The third model takes the candidate solutions from the first two models, which provide the possible types of cells. This model combines different cell types to minimize the total cost and ensure the required cycle time.
2.2 Phase 2. Discrete-event simulation
A discrete-event simulation model was developed to estimate the other performance measures: WIP, Flow Time and Idle time percentage. The production plant is assumed to be continuously working during the shift. The Microsoft Excelâ spreadsheet application was used. Figure 2 shows the flow diagram of the assembly process, where TM is the clock time of the simulation, AT is the scheduled time of the next arrival, DT is the scheduled time of the next departure, WLi is the length of the ith task waiting in line, IT is the inter-arrival time, and MX is the required demand. There are two types of events: arrival and departure; a departure is also the arrival for the next task until the process is finished, and a final product (FP) with a flow time (FTFP) is obtained.
authors’ own elaboration
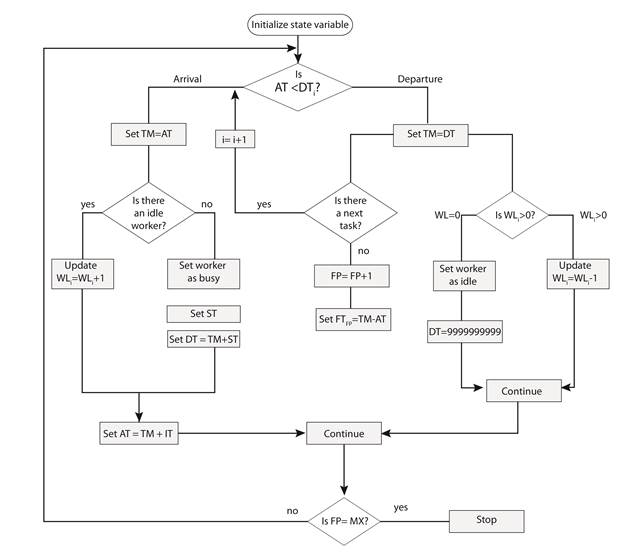
Figure 2
Flow diagram of the discrete-event simulation
Authors’ own creation
2.3 Phase 3. Multi-criteria decision analysis
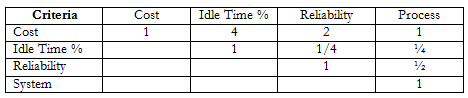
The multi-criteria decision analysis is a theory and a set of techniques to choose alternatives according to attributes and criteria. ANP is one of those multi-criteria techniques, which captures the dependence among different elements [50]. The paired comparison scale is 1-9, where 1 is equal to the importance, and 9 is the extreme importance [51]. The paired comparisons are used to derive the priority function of the network criteria.
3. Application Case
There is an analysis of an application to demonstrate the use of the developed methodology. This application case was obtained from Sempere et al. [52]. A company produces an assembly product with a daily demand of 7.000 units. The shop works 7 hours daily. The assembly consists of 8 tasks as shown in Figure 3. A worker can move from one workbench to another with a transportation time of 0.05 min, and many workers can work in the same task. Annually, the cost of every single installed cell is three times the worker cost.
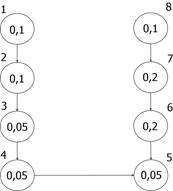
Figure 3
Task times of the case
Modified from Sempere et al. (2008)
3.1 Computational results of phase 1
Model 1 shows 8 optimal solutions; however, the cases with 7 and 8 workers have the identical maximum cycle time as the case with 6 workers but at a higher cost; thus, they were not selected as candidate solutions. In the set of candidate solutions, the minimum cost (40) is found when there are five cells with five workers in each cell. For model 2, the necessary maximum number of workers was calculated to obtain the required cycle time with one cell. The new processing times for different numbers of workers who are in one parallel task were previously found. The results were 17 possible solutions, where a cell type with a single cell and 24 workers has a minimum cost of 27 and a cycle time of 0.05 min. However, model 3 enables one to mix different cell types in models 1 and 2. Model 3 provided the same optimal solution as model 2.
Figure 4 shows the cost behavior for each cell type. The number outside the parentheses is the number of cells, and the number inside the parentheses is the number of workers. The idle time percentage depends on the bottleneck position and whether the calculated number of cells is an exact integer value. For identical numbers of cells, there are multiple configurations with different numbers of workers, where the total cost linearly increases with the number of workers. The total cost behavior is oscillatory. The flat line shows that for a total cost, there are different cell types. If the reliability criterion is added, it is better to have 8 cells with three workers than the remaining options. Therefore, other criteria must be analyzed to select the best solution.
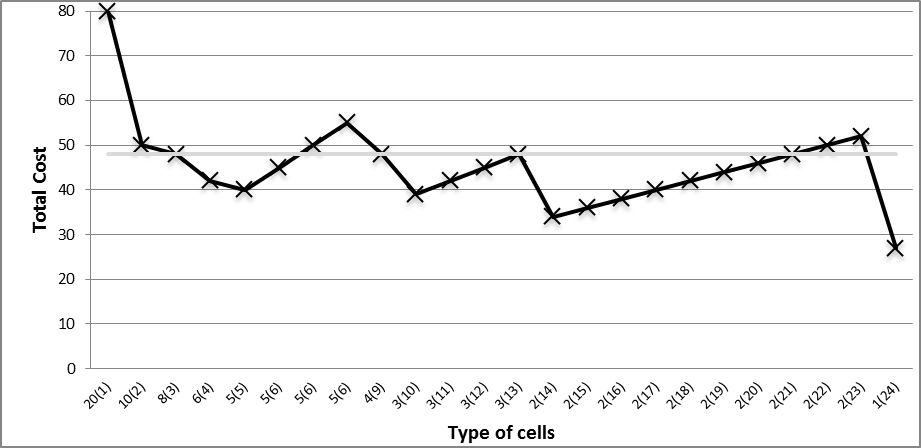
Figure 4
Total cost for each type of cell
Authors’ own elaboration
To validate the simulation model, the WIP and flow time were compared to the theoretical values obtained with Little’s Law, which show that the results were similar. Figure 5 shows that the WIP and flow time results are classified into two categories. The first category occurs when the cell has the bottleneck in the first task, and the second category includes other cases. The first category has less WIP and a shorter flow time than the second one.
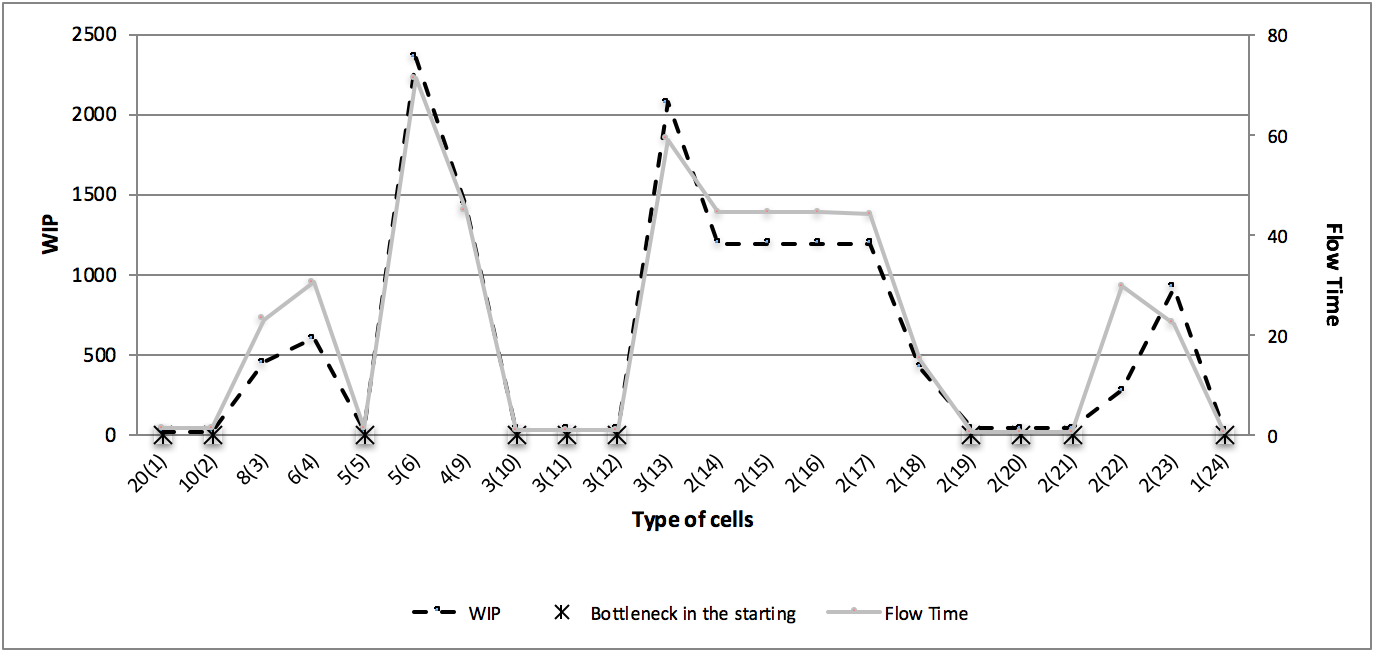
Figure 5
Summary of WIP and flow time results with the simulations
Authors’ own elaboration
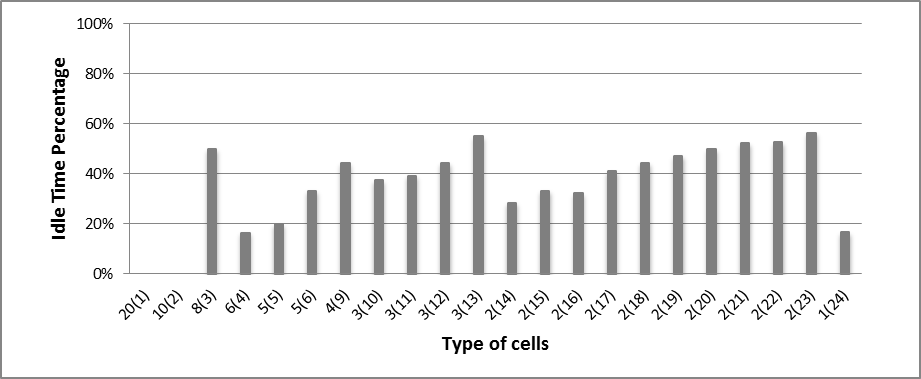
Figure 6
Idle time percentage for different types of cells
Authors’ own elaboration
The idle time percentage mainly depends on the position of the bottleneck, and the number of cells was rounded up. Figure 6 shows the average Idle time percentage for different types of cells. 20(1) and 10(2) have an idle time percentage of 0%.
3.3 Computational results of phase 3
The criteria pairwise comparison for the ANP technique according to a previous analysis is shown in Tables 2 and 3. The ranking of the alternatives for each criterion is provided for the identical simulation results. The consistency indices of the matrices [53] offer an acceptable estimation.
Authors’ own elaboration
Authors’ own elaboration
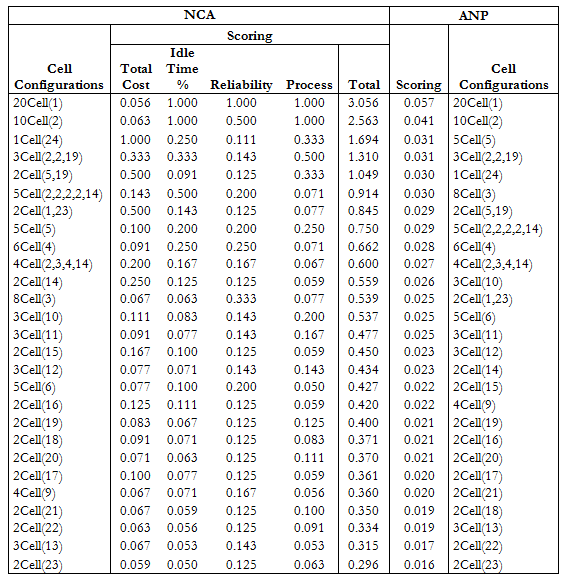
New constraints were added to optimization model 3 to find additional solutions between cells two and five for the multi-criteria decision analysis. These solutions are more expensive but may be better for all combined criteria. The new solutions were analyzed with the existing solutions for the ANP. Furthermore, ANP results were compared to a non-compensating analysis (NCA). Table 4 has two parts: NCA ranking and ANP ranking. In relation to NCA, the scoring of the alternative cell configurations was measured for each criterion, and the scores were normalized by criteria. When only the process criterion was considered, all best solution configurations had the bottleneck at the beginning. The 20-cell configuration with one worker 20(1) is the best for both analyses. The configuration of one cell with 24 workers 1(24) shows the lowest cost but is not reliable, so it was discarded. It is important to highlight that changing the criteria weights will change the score of each configuration and consequently its ranking in the results.
To analyze the results, the smoothness index is measured to know the process synchronization (See Equation 20), i.e., the load leveling among the workers. The perfect balance is indicated by a zero (0) value [54][55]. The k station time is identical in for model 1 and for model 2. The best two alternatives have zero (0) smoothness indices.
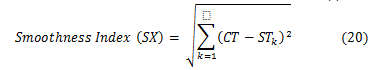 [Ecuation 2]
A zero (0) smoothness index implies a perfect synchronization among the tasks, which is notably important for the process because it decreases the wasted time and excess WIP.
4. Conclusions
The methodology developed for the MOALBP enables us to select the best configuration of parallel cells in a cellular manufacturing system, which involves the multi-criteria selection to enrich the problem solution. The method considers the economic criteria, total cost, multi-lean measures, cycle time, WIP, flow time and reliability to make decisions in an integral manner.
The methodology developed for the MOALBP enables us to select the best configuration of parallel cells in a cellular manufacturing system, which involves the multi-criteria selection to enrich the problem solution. The method considers the economic criteria, total cost, multi-lean measures, cycle time, WIP, flow time and reliability to make decisions in an integral manner.
Furthermore, the method combines different solution strategies when the solution is broken down into several phases and sub-models, which handle the procedure in a simple manner without advance tools or long computing processing time.
The optimization models enable us to find the best solution, but simplifying the actual system and the simulation do not optimize. However, it considers the interrelations and complexity, so it is important to combine them. In addition, the ANP selects the best alternative among multiple possible solutions.
The presented method is notably different than those in the literature. The method is useful in practical cases. The multi-lean criteria focus on eliminating idle time and excess inventory and synchronizing the manufacturing system. In the best configuration, there is a bottleneck at the beginning of the process with a zero-smoothness index, which generates a perfect load balancing; thus, there is no idle time. Although this configuration is optimal under multiple criteria, it is not the configuration with the lowest cost, which would be selected in a traditional approach.
For future study, a larger application should be considered because this problem is a combinatorial problem to analyze the use of metaheuristics to solve optimization models.
Authors’ own elaboration
References
R. Shah and P. T. Ward, “Defining and developing measures of lean production,” vol. 25, pp. 785–805, 2007
M. Dora and D. Van Goubergen, “Application of lean practices in small and medium-sized food enterprises,” vol. 116, no. 1, pp. 125–141, 2012.
A. Azadegan, P. C. Patel, A. Zangoueinezhad, and K. Linderman, “The effect of environmental complexity and environmental dynamism on lean practices,” J. Oper. Manag., vol. 31, no. 4, pp. 193–212, 2013.
M. D. Regan, The Kaizen Revolution How to use kaizen events to double your profits. Raleigh, North Carolina: Holden Press, 2000.
L. Rivera and F. Frank Chen, “Measuring the impact of Lean tools on the cost–time investment of a product using cost–time profiles,” Robot. Comput. Integr. Manuf., vol. 23, no. 6, pp. 684–689, 2007.
A. Scholl and C. Becker, “State-of-the-art exact and heuristic solution procedures for simple assembly line balancing,” Eur. J. Oper. Res., vol. 168, no. 3, pp. 666–693, 2006.
U. Saif, Z. Guan, B. Wang, J. Mirza, and S. Huang, “A survey on assembly lines and its types,” Front. Mech. Eng., vol. 9, no. 2, pp. 95–105, 2014.
N. Kriengkorakot and N. Pianthong, “The assembly line balancing problem: Review Problem,” J. Ind. Eng., vol. 6, no. 3, pp. 18–25, 1955.
S. Ghosg and R. J. Gagnon, “A comprehensive literature review and analysis of the design, balancing and scheduling of assembly systems,” Int. J. Prod. Res., vol. 24, no. 4, pp. 637–670, 1989.
A. Arroyo and O. Rubiano, “Solving a Two-Sided Assembly Line Balancing Problem using Memetic,” vol. 13, no. 2, pp. 267–280, 2009.
C. Becker and A. Scholl, “A survey on problems and methods in generalized assembly line balancing,” Eur. J. Oper. Res., vol. 168, no. 3, pp. 694–715, 2006.
W.-M. Chow, Assembly Line Design: Methodology and Applications (Manufacturing Engineering and Materials Processing). New York: Marcell Decker, Inc. Manufacturing Engineering and Mateirial, 1990.
B. Rekiek and A. Delchambre, Assembly line design the balancing of mixed-model hybrid assembly lines with genetic algortithms. Springer, 2006.
J. Bukchin and M. Masin, “Multi-objective design of team oriented assembly systems,” Eur. J. Oper. Res., vol. 156, no. 2, pp. 326–352, 2004.
R. Esmaeilbeigi, B. Naderi, and P. Charkhgard, “The type E simple assembly line balancing problem: A mixed integer linear programming formulation,” Comput. Oper. Res., vol. 64, pp. 168–177, 2015.
R. Ramezanian and A. Ezzatpanah, “Modeling and solving multi-objective mixed-model assembly line balancing and worker assignment problem,” Comput. Ind. Eng., vol. 87, pp. 74–80, 2015.
I. Mahdavi, A. Aalaei, M. M. Paydar, and M. Solimanpur, “Designing a mathematical model for dynamic cellular manufacturing systems considering production planning and worker assignment,” Comput. Math. with Appl., vol. 60, no. 4, pp. 1014–1025, 2010.
P. T. Zacharia and A. C. Nearchou, “A population-based algorithm for the bi-objective assembly line worker assignment and balancing problem,” Eng. Appl. Artif. Intell., vol. 49, pp. 1–9, 2016.
M. H. Alavidoost, H. Babazadeh, and S. T. Sayyari, “An interactive fuzzy programming approach for bi-objective straight and U-shaped assembly line balancing problem,” Appl. Soft Comput. J., vol. 40, pp. 221–235, 2016.
P. Samouei, P. Fattahi, J. Ashayeri, and S. Ghazinoory, “Bottleneck easing-based assignment of work and product mixture determination: Fuzzy assembly line balancing approach,” Appl. Math. Model., vol. 40, no. 7–8, pp. 4323–4340, 2016.
W. Zhang, W. Xu, and M. Gen, “Hybrid Multiobjective Evolutionary Algorithm for Assembly Line Balancing Problem with Stochastic Processing Time,” Procedia Comput. Sci., vol. 36, no. 3, pp. 587–592, 2014.
M. Chica, J. Bautista, Ó. Cordón, and S. Damas, “A multiobjective model and evolutionary algorithms for robust time and space assembly line balancing under uncertain demand,” Omega, vol. 58, pp. 55–68, 2016.
C. R. Shiyas and V. Madhusudanan Pillai, “A mathematical programming model for manufacturing cell formation to develop multiple configurations,” J. Manuf. Syst., vol. 33, no. 1, pp. 149–158, 2014.
J. Rezaeian, N. Javadian, R. Tavakkoli-Moghaddam, and F. Jolai, “A hybrid approach based on the genetic algorithm and neural network to design an incremental cellular manufacturing system,” Appl. Soft Comput. J., vol. 11, no. 6, pp. 4195–4202, 2011.
P. Chutima and P. Chimklai, “Multi-objective two-sided mixed-model assembly line balancing using particle swarm optimisation with negative knowledge,” Comput. Ind. Eng., vol. 62, no. 1, pp. 39–55, 2012.
Z. Yuguang, A. Bo, and Z. Yong, “A PSO algorithm for multi-objective hull assembly line balancing using the stratified optimization strategy,” Comput. Ind. Eng., vol. 98, pp. 53–62, 2016.
B. Bootaki, I. Mahdavi, and M. M. Paydar, “New criteria for configuration of cellular manufacturing considering product mix variation,” Comput. Ind. Eng., vol. 98, pp. 413–426, 2016.
A. Delgoshaei and C. Gomes, “A multi-layer perceptron for scheduling cellular manufacturing systems in the presence of unreliable machines and uncertain cost,” Appl. Soft Comput., vol. 49, pp. 27–55, 2016.
G. W. Evans and S. M. Alexander, “Proceedings of the 2007 Winter Simulation Conference S. G. Henderson, B. Biller, M.-H. Hsieh, J. Shortle, J. D. Tew, and R. R. Barton, eds.,” pp. 1615–1623, 2007.
R. Al-Aomar, “Handling multi-lean measures with simulation and simulated annealing,” J. Franklin Inst., vol. 348, no. 7, pp. 1506–1522, 2011.
S. Seifermann, J. Böllhoff, J. Metternich, and A. Bellaghnach, “Evaluation of work measurement concepts for a cellular manufacturing reference line to enable low cost automation for lean machining,” Procedia CIRP, vol. 17, pp. 588–593, 2014.
N. Manavizadeh, N. S. Hosseini, M. Rabbani, and F. Jolai, “A Simulated Annealing algorithm for a mixed model assembly U-line balancing type-I problem considering human efficiency and Just-In-Time approach,” Comput. Ind. Eng., vol. 64, no. 2, pp. 669–685, 2013.
A. M. Deif, “Dynamic analysis of a lean cell under uncertainty,” Int. J. Prod. Res., vol. 50, no. 4, pp. 1127–1139, 2012.
W. J. Hopp and M. L. Spearman, Factort Physics, 2nd ed. MacGraw-Hill, 2001
M. A. Kabir and M. T. Tabucanon, “Batch-model assembly line balancing: A multiattribute decision making approach,” Int. J. Prod. Econ., vol. 41, no. 1–3, pp. 193–201, 1995.
N. Suresh Kumar and R. Sridharan, “Simulation modelling and analysis of part and tool flow control decisions in a flexible manufacturing system,” Robot. Comput. Integr. Manuf., vol. 25, no. 4–5, pp. 829–838, 2009
G. Shambu and N. C. Suresh, “Performance of hybrid cellular manufacturing systems: a computer simulation investigation,” Eur. J. Oper. Res., vol. 120, no. 2, pp. 436–458, 2000.
F. Al-Mubarak, C. Canel, and B. M. Khumawala, “A simulation study of focused cellular manufacturing as an alternative batch-processing layout,” Int. J. Prod. Econ., vol. 83, no. 2, pp. 123–138, 2003.
A. R. Pitombeira Neto and E. V. Gonçalves Filho, “A simulation-based evolutionary multiobjective approach to manufacturing cell formation,” Comput. Ind. Eng., vol. 59, no. 1, pp. 64–74, 2010.
L. Tiacci, “Event and object oriented simulation to fast evaluate operational objectives of mixed model assembly lines problems,” Simul. Model. Pract. Theory, vol. 24, pp. 35–48, 2012.
A. R. Mendes, A. L. Ramos, A. S. Simaria, and P. M. Vilarinho, “Combining heuristic procedures and simulation models for balancing a PC camera assembly line,” Comput. Ind. Eng., vol. 49, no. 3, pp. 413–431, 2005.
P. Cappanera, F. Visintin, and C. Banditori, “Comparing resource balancing criteria in master surgical scheduling: A combined optimisation-simulation approach,” Int. J. Prod. Econ., vol. 158, pp. 179–196, 2014.
I. Kucukkoc and D. Z. Zhang, “Balancing of parallel U-shaped assembly lines,” Comput. Oper. Res., vol. 64, pp. 233–244, 2015.
H. Goken, K. Agpak, and R. Benzer, “Balancing of parallel assembly lines,” Int. J. Prod. Econ., vol. 103, no. 2, pp. 600–609, 2006.
Black J.T and D. T. Phillips, Lean Engineering The Future Has Arrived, 1st ed. College Station TX US: Virtualbookworm, 2014.
A. Aghajani, S. A. Didehbani, M. Zadahmad, M. H. Seyedrezaei, and O. Mohsenian, “A multi-objective mathematical model for cellular manufacturing systems design with probabilistic demand and machine reliability analysis,” Int. J. Adv. Manuf. Technol., vol. 75, no. 5, pp. 755–770, 2014.
U. Bahalke, K. Dolatkhahi, H. Dehghani, E. Jahani, V. Yazdanparast, and H. Hajihosseini, “Formulation and heuristic algorithm for flow time minimization in a simple assembly line,” Proc. Inst. Mech. Eng. Part B J. Eng. Manuf., vol. 226, no. 3, pp. 512–526, 2012.
R. E. Gunther, G. D. Johnson, and R. S. Peterson, “Currently practiced formulations for the assembly line balance problem,” J. Oper. Manag., vol. 3, no. 4, pp. 209–221, 1983.
J. Bukchin and J. Rubinovitz;, “A weighted approach for assembly line design with station paralleling and equipment selection,” IIE Trans., vol. 35, no. 1, pp. 73–85, 2003.
T. L. Saaty, “Fundamentals of the analytic network process,” Kobe, Japan, p. 14, Aug-1999.
T. L. Saaty, “Decision making with the analytic hierarchy process,” Int. J. Serv. Sci., vol. 1, no. 1, p. 83, 2008.
F. R. Sempere, C. I. Miralles, C. A. Romano, and E. V. Salort, Tiempos, Aplicación de mejora de métodos de trabajo y medición de tiempos. Limusa, 2008.
T. L. Saaty, “How to make a decision: The analytic hierarchy process,” Eur. J. Oper. Res., vol. 48, no. 1, pp. 9–26, 1990.
W. Grzechca, “METHODOLOGY FOR COST ORIENTED Introduction of assembly line balancing problem Basic assumption of assembly line balancing problem,” Total Logist. Manag., no. 4, pp. 57–67, 2011.
W. Grzechca, “Assembly Line Balancing Problem with Reduced Number of Workstations,” in 19th World Congress The International Federation of Automatic Control, 2014, pp. 6180–6185.
Notes