Civil and environmental engineering
Effect of different geographic altitudes on the performance of a conventional solar still with arsenic and boron removal efficiency in an arid zone1
Efecto de la altura geográfica sobre el desempeño de un destilador solar convencional con su eficiencia de remoción de arsénico y boro en una zona árida
Effect of different geographic altitudes on the performance of a conventional solar still with arsenic and boron removal efficiency in an arid zone1
Ingeniería y Universidad, vol. 22, no. 2, pp. 1-21, 2018
Pontificia Universidad Javeriana

This work is licensed under Creative Commons Attribution 4.0 International.
Received: 10 May 2017
Accepted: 23 January 2018
Abstract: Objectives: Report the exploratory study results of the performance of a conventional solar still prototype using seawater and brackish water (river and well) at three locations in northern Chile at different geographical heights. Materials and methods: A solar still with an effective distillation area of 0.54 m2 was used. Three tests were performed with seawater, 1 with river water and 1 with well water. The temperatures and environmental parameters were measured every 10 minutes for 36 continuous hours. The efficiency was evaluated in terms of seawater and the capacity to remove natural contaminants from brackish water. Results and discussion: The productivity in the three selected areas was 3 and 4 L/m2 for seawater and brackish water, respectively. The removal of boron and arsenic complies with the regulations of the country. Conclusion: The results obtained are of exploratory character for the zones, where the geographic height and the total dissolved solids are factors that determine the performance of a passive solar still, which is higher when water is used with low concentrations of solids.
Keywords: Conventional solar still, arsenic removal, boron removal.
Resumen: Objetivos: Reportar los resultados del estudio exploratorio del rendimiento de un prototipo de destilador solar convencional utilizando agua de mar y agua salobre (río y pozo), en tres ubicaciones en el norte de Chile a diferentes alturas geográficas. Materiales y métodos: Se utilizó un destilador solar con un área de destilación efectiva de 0,54 m2. Se realizaron 3 pruebas con agua de mar, 1 con agua de río y 1 con agua de pozo. Las temperaturas y los parámetros ambientales se midieron cada 10 minutos durante 36 horas continuas. La eficiencia se evaluó con agua de mar y la capacidad de eliminar contaminantes naturales con agua salobre. Resultados y discusión: La productividad en las tres áreas seleccionadas fue de 3 y 4 L/m2 aproximadamente (agua de mar y agua salobre, respectivamente). La eliminación de boro y arsénico cumple con las regulaciones del país. Conclusión: Los resultados obtenidos son de carácter exploratorio para las zonas, donde la altura geográfica y los sólidos disueltos totales son factores que determinan el rendimiento de un destilador solar pasivo, que es mayor cuando se utiliza agua en bajas concentraciones de sólidos.
Palabras clave: Destilador solar convencional, remoción de arsénico, remoción de boro.
1. Introduction
The Atacama Desert is one of the most arid and largest deserts in the world. The desert is located in the north of Chile and spans from the Pacific Ocean at the west border to the Andes at the east border. Figure 1 shows the geographical formations that can be distinguished across the study area: coastal headland, coastal mountains, Tamarugal Plateau, valleys, Andean Plateau and Andes Mountains. The altitude increases from west to east, from 0 meters above sea level (m.a.s.l.) to 5577 m.a.s.l. in the Andes. The population in north Chile is distributed in urban settlements located in the coastal headlands, Tamarugal Plateau, valleys and Andean Plateau. The water for human activities is obtained from the few existing rivers and underground aquifers. Chemical analysis performed in natural sources of water in the region have shown that some areas have high concentrations of arsenic (As) and boron (B) [1, 2], which restrict the use for human consumption and crop irrigation. The small rural settlements with populations from 10 to 1500 inhabitants are located principally in the coastal headland, Tamarugal Plateau, valleys and Andean Plateau; these regions lack direct access to drinkable water, which must be provided by water trucks coming from hundreds of kilometers away. The population density of the rural settlements mentioned above does not exceed 0.8 inhabitants per km2. The low population density, geographical conditions (high mountains with deep valleys), long distances and extreme weather conditions make the urbanization of the territory a difficult task because the previous factors cause high costs for installing distribution lines of electric energy and drinking water.
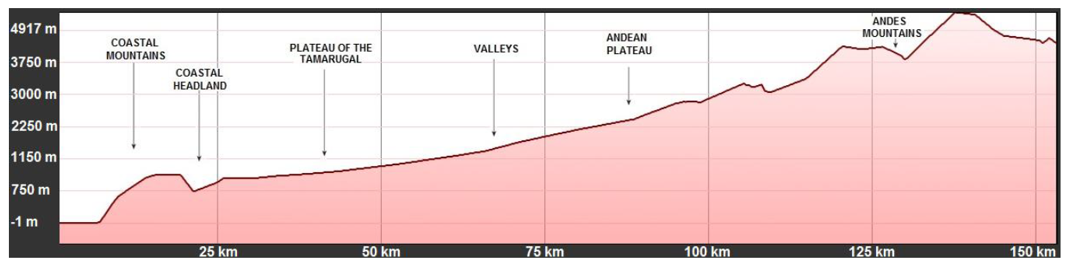
Figure 1.
Transversal cut between 19º and 20º South Latitude of the North of Chile
Google Earth Pro
The region receive approximately 8000 MJ/m2-year of average annual solar irradiation [3]. Figure 2 shows the registered isolines of annual global irradiance, which are suitable for the development of systems that use solar energy (see Figure 2).
![Annual Global Irradiance Map (MJ / m2) of
north of Chile [2]](../47758868006_gf4.png)
Figure 2.
Annual Global Irradiance Map (MJ / m2) of north of Chile [2]
Prepared 4 by the authors, image base in NatGeo World map
In this context, the use of solar stills is a convenient alternative for remote areas of the region with small rural settlements, based on two main points: abundant solar energy resource and available desert plains [4]. The above conditions provide an opportunity to implement low cost treatment systems to obtain water for human consumption in these rural settlements.
Solar distillation has been used for many centuries to obtain drinkable water using either seawater or brackish water, such as that found in desert locations. This technology is easy to design and implement, has low maintenance costs and does not require monetary investments in energy supply systems. The first large-scale solar distillation plant was built in Chile in 1982 [5] using conventional stills. The literature review revealed that many designs for solar stills have been proposed around the world to improve the yield, ranging from conventional ones to complex improved models [6,7, 8, 9,10, 11, 12, 13] that are based on calculations, suitable mathematical models and efficient computational simulations [14, 15,16]. The evaluation of a solar still performance requires knowledge of the environmental characteristics of the zone where the still is to be installed. The distillation process of water with contents of salt has been studied in Algeria [17]. The studies showed that low solid contents in the water, i.e., between 2 and 5 g/L, together with a limited and intermittent shading process allow a higher distilled water than that obtained in conventional stills [18]. Using the ambient relevant parameters in distilling water, the following processes can be found: the available solar incoming radiation, the wind speed, and the ambient temperature [19]. It is important to establish a distance between the stills and the surrounding structures to avoid an energy imbalance. Recent studies have shown that solar distillation can remove 99.9% of the bacteria contained in low quality water and eliminate 99% of the non-volatiles contaminants, some of which affect human beings [20].
This paper shows the experimental results obtained using a passive conventional solar still implemented in the Region of Tarapacá in the North of Chile. The experiments were performed using the same experimental equipment at three selected locations at different altitudes above sea level. The aforementioned approach is necessary because the weather conditions of the coastal areas are meteorologically different from the Tamarugal Plateau, valleys, Andean Plateau and Andes Mountains; therefore, the performance of the solar still must be studied in each different environmental condition. The first location was defined at 27 m.a.s.l. at Campus Huayquique`s coastal area; the second one at 995 m.a.s.l. at Canchones (Tamarugal Plateau); and the third one at 2420 m.a.s.l. at Camiña. In each of the selected locations, experiments were performed using seawater to establish a common pattern of performance; moreover, in Canchones and Camiña, brackish water was also used to evaluate the ability of the solar still to remove As and B from the natural sources. Therefore, three experiments were performed using seawater, and the other two experiments were performed with brackish water obtained from the natural water sources.
2. Materials and methods
To perform the present study, a conventional passive solar still was built. This solar still was used at the three selected locations mentioned above. Figure 3 depicts the geometry and dimensions of the still.
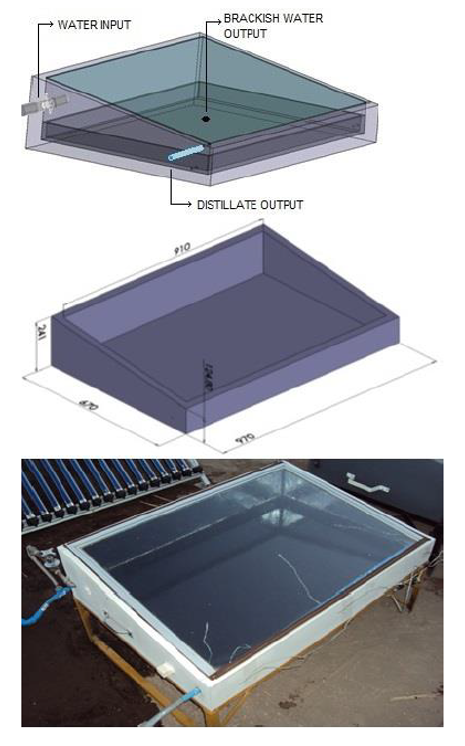
Figure 3.
Design and dimensions of the solar still used for the study
Authors’ own creation
2.1. Solar still features
The walls and base of the still were custom-made of fiberglass of 3 cm in thickness to ensure its thermal insulation, durability and light weight. The useful area for the distillation process was 0.54 m2. The surfaces in contact with the water were painted in black using chemical-free paint to avoid affecting the composition of the water and improve the solar energy collection. An inclined gutter was placed along the lower corner of the condenser cover for the distill recollection process. Reflecting mirrors were installed in the inner walls of the still, and external handles were attached to facilitate the manipulation and transportation of the experimental equipment. The still was supported by a galvanized steel structure.
The feeding was conducted through copper piping installed in one of the borders of the still, a passive valve was used to control the water volume. The inclination of the glass cover is 12° with respect to the horizontal; this parameter was within the optimal ranges reported in the literature [21]. The condensing glass cover was 3 mm thick to improve the radiation transmission and to avoid the heat loss inside the still [22].
2.2 Instrumentation
The weather conditions of the environment were measured by an autonomous meteorological station located 5 m from where the experimental unit was located. The weather station registered the variation of the following parameters on an hourly basis: environmental temperature, average solar radiation, relative environment humidity, direction and wind speed. The parameters of the water quality were measured using the multiparametric equipment HI 9828. For recording the temperature inside the still, four type K thermocouples were installed. Figure 4 schematically shows the position of each thermocouple inside the still: Tp1, inner glass (condenser); Tp2, floor (basin base); Tp3, ambient (chamber); and Tp4, water surface (basin). The thermocouples were linked to a data collection system, “Personal Daq/56, 22-bit, USB”, that was connected to a laptop to store the data obtained every 10 minutes.
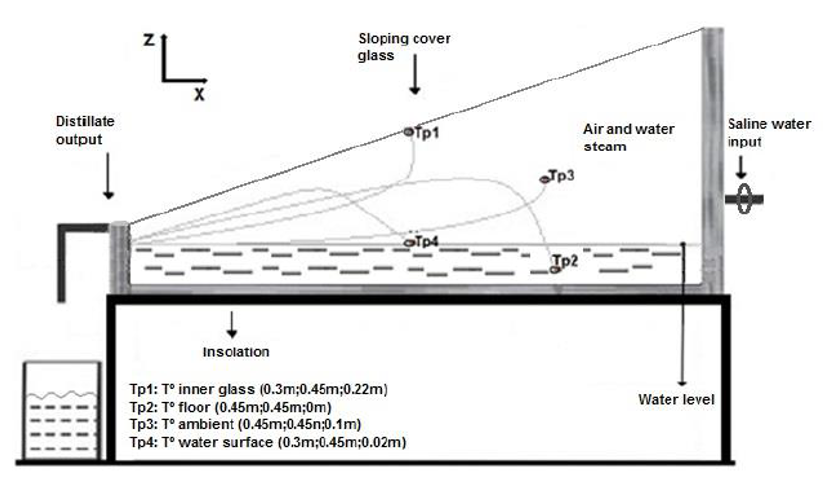
Figure 4.
Scheme of a conventional still with 4 thermocouples installed inside
Authors’ own creation
In addition, the productivity and quality of the distilled water from Camiña’s river were studied to determine the variations in the concentrations of B and As in the water. The measurements were conducted at the Chemistry Laboratory of the University of Arturo Prat. The UV-visible molecular spectroscopy equipment based on the azomethine method was used for the quantification of the B content, and the atomic absorption spectroscopy with hydride generation (HG-AAS) apparatus was used for the determination of As concentration in the water.
2.3 Experimental Assembly
For the assembly of each experimental setup at the different locations, the same conventional solar still was used. All experiments were completed in autumn of 2012 (south hemisphere) to determine the still performance in the less favorable weather conditions. Three selected locations of the north of Chile were chosen because of their water differences in terms of their geographical height and ambient conditions. The first selected location was at the coast at the following UTM coordinates of 381.904 mE and 7.758.157 mN at 27 m.a.s.l. at the Campus of Huayquique Universidad Arturo Prat. This location was chosen because of the geographical and weather similarities with most of the coastal settlements of the North of Chile. The study was performed between March 26th and March 30th. The second selected location was Tamarugal Plateau at UTM coordinates of 444.205 mE and 7.739.406 mN at an altitude of 995 m.a.s.l. at the “Estación Experimental Canchones del Tamarugal”, which belongs to Universidad Arturo Prat. The study was performed between April 9th and 13th. The third location was the commune of Camiña, at UTM coordinates of 455.216 mE and 7.864.550 mN at an altitude of 2.420 m.a.s.l. in the high school of the Camiña district area, performed between May 1st and May 5th. As comparison variables, the pH, electric conductivity (EC), and total dissolved solids (TDS) parameters were used in each of the locations. Moreover, depending on the geographical location, the solar still could receive a lower or higher amount of solar radiation; therefore, in the southern hemisphere, the still had to be placed facing north, following the path of the solar arc to receive more solar radiation during the day [23,24]. The water depth level of the basin used for each of the performed experiments was 2 cm to optimize the process performance [25,26,27,28].
Each experiment was performed over 36 hours, with the objective of obtaining a complete day and night cycle; the great climatic stability of the North of Chile establishes a correlation with other months of the year. A longer data recollection period in the environment and the still performance were not considered in this study. The main objective of this work is to study the behavior of the solar distillation process in three representative zones of the “North of Chile”, with each having different geographical and environmental characteristics. This approach allows the effect of particular environmental variables to be evaluated at each location during the study. Furthermore, the analysis of the distillation process allows linking the geographical height to environmental parameters, such as temperature, radiation, wind speed and daylight hours, and to the quality and quantity of the distilled water produced.
2.4 Efficiency for a conventional solar still
The energy balance for the conventional still allows us to determine the temperature variations and, through analogy, the mass of the theoretical distilled water. In general, these equations incorporate radiation, temperature and wind speed data. For further information, see J. Duffie and W. Beckman, 1980 [29]. The instantaneous efficiency , of a conventional still at any time is defined as the ratio of the heat transfer by the evaporation–condensation process (qe) and the radiation (G) incident on the still.
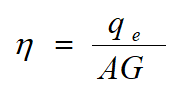 (1)
(1)Equation 1 is usually integrated over an extended period (e.g., a day or month) to indicate its long-term performance. If there is any loss of product water back into the still (by dripping from the over or by evaporation or leakage from collecting troughs), then less of the product is available, and the theoretical efficiency is more representative of the process. Moreover, the experimental efficiency defined in equation 2 considers the experimental measurement thus provides a more realistic overview of the process [28, 29]:
 (2)
(2)where is the average daily mass flux of the produced distill (kg/s), is the latent heat of the vaporization (J/kg) from the average temperature of the water surface in the basin, A is the effective area of the vaporization (m2) and Gm is the average solar radiation (W/m2). Furthermore, analogous to the approach of Duffie and Beckman and Radwan et al., 2009, to maximize qe and , which are both proportional to the vapor pressure difference between the basin and the cover [30], the pressure variation with the height can be determined through the following equation:
 (3)
(3)where p(z), is the atmospheric pressure to the altitude z, p0 is the atmospheric pressure at the sea level (101325 Pa) and α is a constant (1.19x10⁻⁴ m-1, 2.21x10⁻⁴ m-1 and 2.25x10⁻⁴ m-1) [31]
3. Results and discussions
In the Tarapaca region, environmental information is scarce; only in the last decade were a series of weather stations installed in strategic locations. At Canchones, the records start in 2007, and at Camiña, the records begin in 2010. Figure 5 summarizes the behaviors of temperature, relative humidity and wind speed during autumn in Canchones and Camiña from the origin date of the weather stations to the date of this study. Figures 5, A, B and C present the minimum, maximum and average behaviors of Canchones, respectively, for the three mentioned variables and D, E and F show those of Camiña.
In the five monitoring years for Canchones, the behaviors of the three variables were similar. The temperature was not superior to 36°C, and the minimum was reached in 2010 (-4°C). The relative humidity average was not higher than 60%; however, the maximum reached 95% in the night period (Figure 5, A, Band C).
From the information obtained in three years of monitoring at Camiña, it can be observed that the temperature does not have a clear tendency, unlike what is found for the wind speed and relative humidity, which are similar between the years 2011 and 2013 (Figure 5 D,E and F). Nevertheless, the maximum temperatures do not exceed 21°C, and the minimum temperatures are close to 11°C.
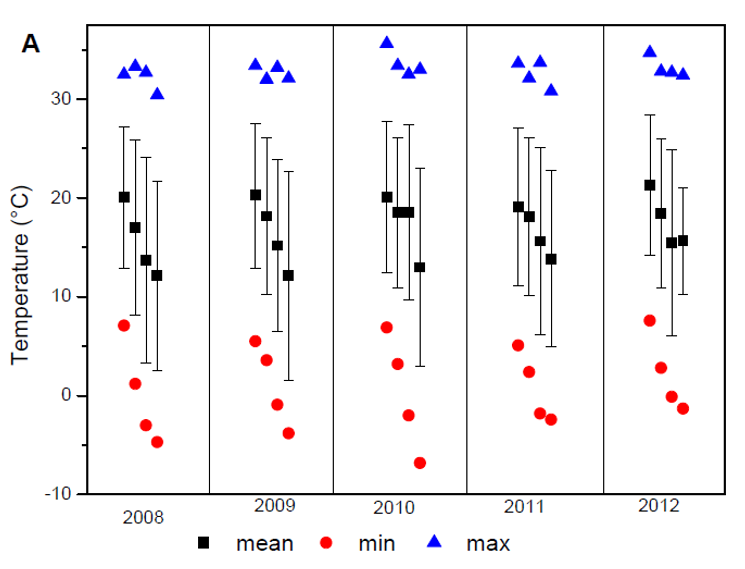
Figure 5. A
Weather behavior of temperature, relative humidity and wind speed during autumn in Canchones
Authors’ own creation
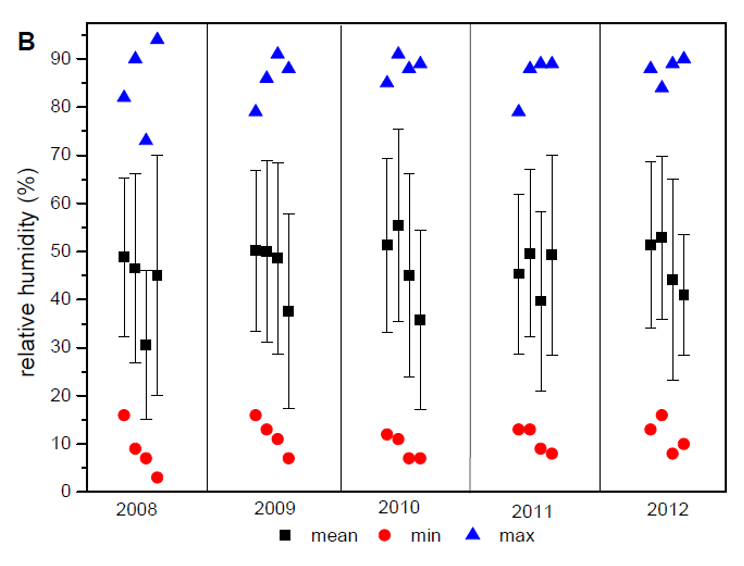
Figure 5. B
Weather behavior of temperature, relative humidity and wind speed during autumn in Canchones
Authors’ own creation
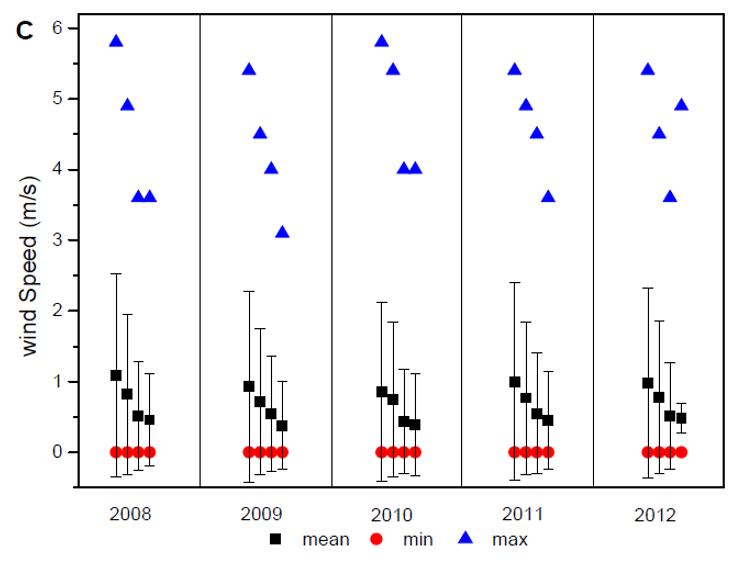
Figure 5. C
Weather behavior of temperature, relative humidity and wind speed during autumn in Canchones
Authors’ own creation
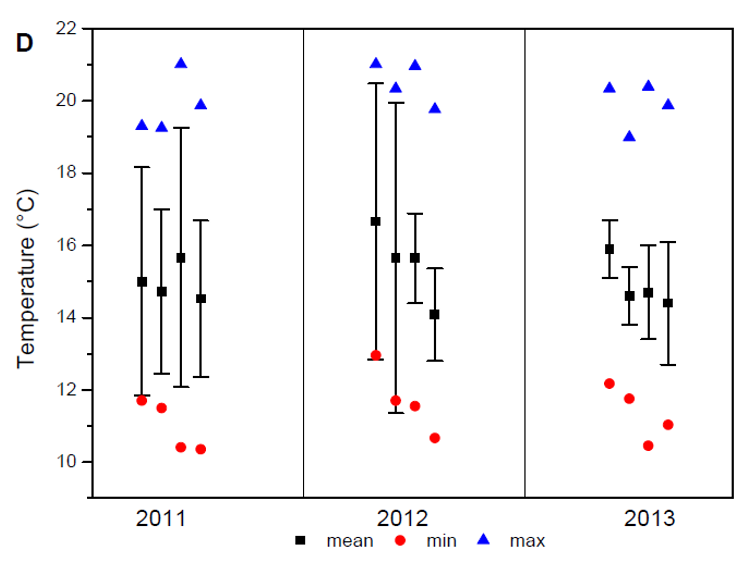
Figure 5. D
Weather behavior of temperature, relative humidity and wind speed during autumn in Camiña
Authors’ own creation
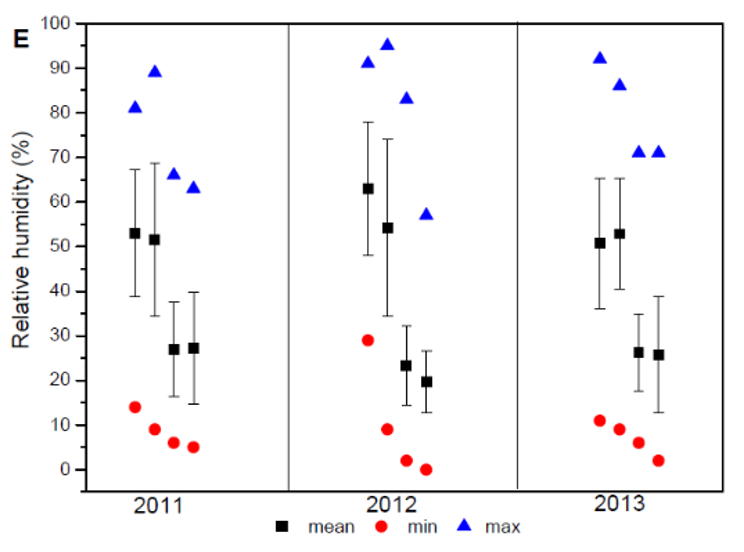
Figure 5. E
Weather behavior of temperature, relative humidity and wind speed during autumn in Camiña
Authors’ own creation
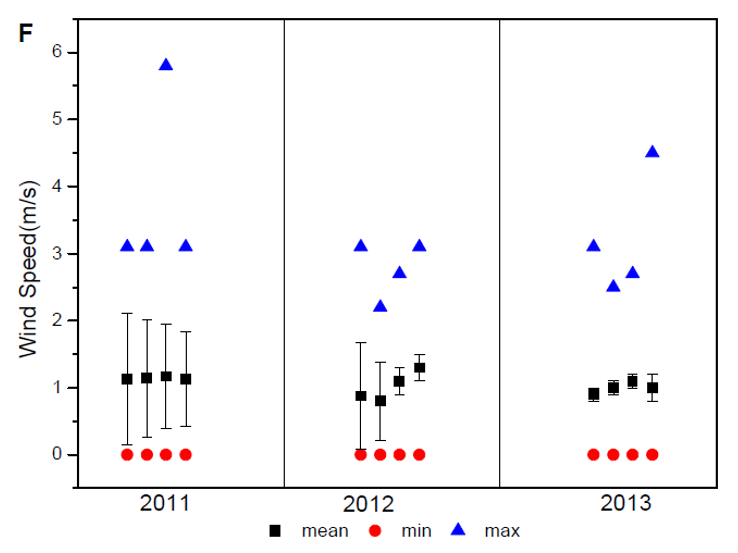
Figure 5. F
Weather behavior of temperature, relative humidity and wind speed during autumn in Camiña
Authors’ own creation
Figure 6 A, B,C, shows the environmental variations in temperature, solar radiation and wind speed for the three selected locations during the experimental study. The recording data were obtained on the same dates on which the experimental studies were performed. Figure 5A shows the variations of the environment temperature for each location. The high variations between the maximum and minimum temperatures are characteristic of the Atacama Desert; that behavior is clearly reflected on the recorded data of Canchones station, where the maximum temperature was 32°C and the minimum was 12°C. The lowest environmental temperatures of the three locations were registered in Camiña, being close to 10°C for the minimum and 23°C for the maximum. In the case of Huayquique, the weather station was located near the sea, in the coastal area of the Southern Pacific Ocean; the curve of temperature showed the typical behavior of the zone in autumn, with gaps between maximum and minimum temperatures that do not exceed 5°C. These results are in accordance with those reported by Cereceda et al. (2008); i.e., over 30 years of meteorological records, the thermal gradient in the coastal zone did not exceed 5°C in annual average (at a location close to the selected location used in this study) and exhibited a remarkable spatial homogeneity in terms of interannual variability. This behavior is a reflection of the strong ocean influence and the homogenizing effect of the cold Humboldt Current [32, 33]

Figure 6. A.
Electrical conductivity in natural waters of Camiña and Canchones
Authors’ own creation
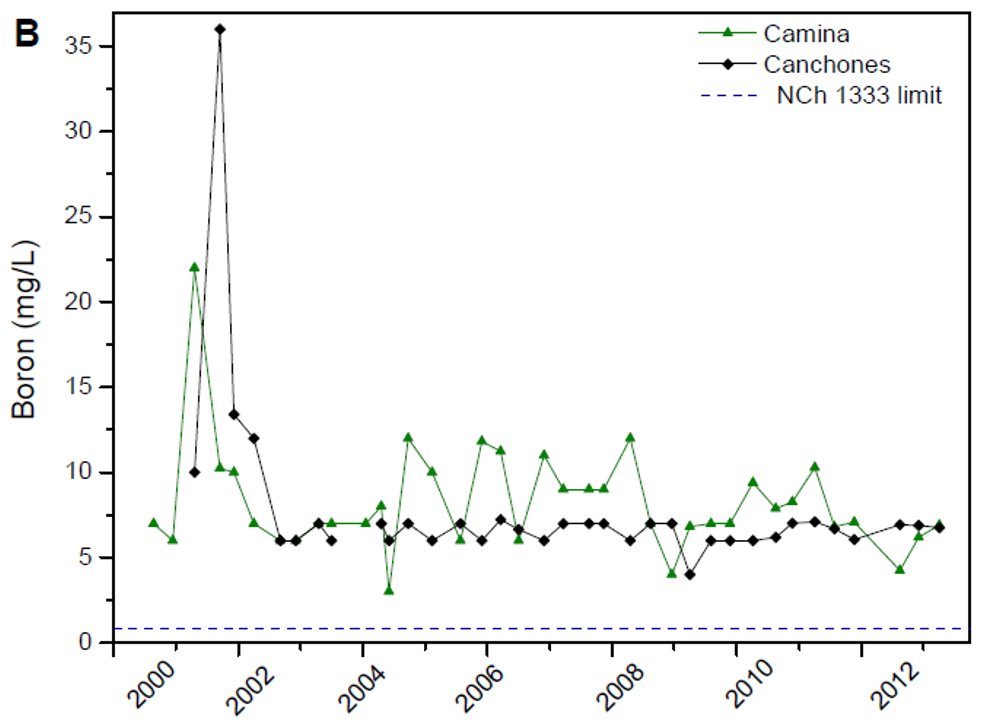
Figure 6. B.
Boron concentrations in natural waters of Camiña and Canchones
Authors’ own creation
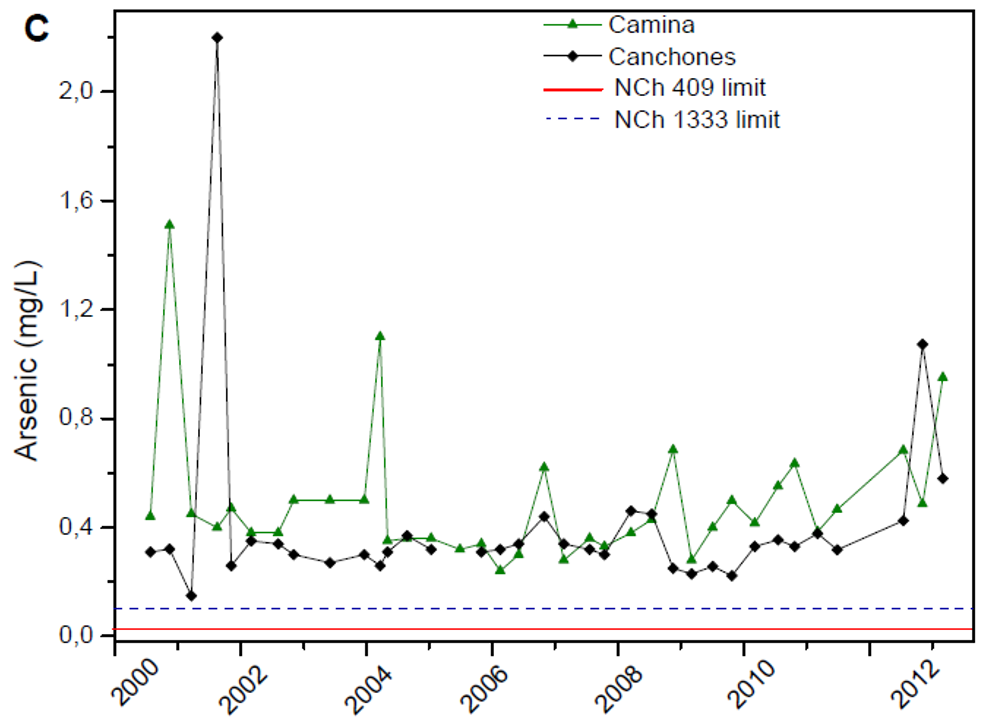
Figure 6. C.
Arsenic concentration in natural waters of Camiña and Canchones
Authors’ own creation
The curves of solar radiation of all the selected locations are shown in Figure 5B during the 36 hours of experimental study at each location. The behavior of the solar radiation curve is characteristic of the Tarapacá region, which poses a high climatic stability with scarce cloudiness, having an annual average Direct Normal Irradiation (DNI) of 9–10 kWh/m2/day [34, 35]. In the present study, the highest values of solar radiation registered were close to 870 W/m2 and corresponded to the Huayquique location. In this case, the still and weather station were placed a few meters from the sea in a zone of dunes without vegetation and far from buildings to avoid obstructions and the generation of shadows. The solar radiation curve implies that in the Coastal zone, the sky is very clear with few clouds, thus explaining the high values of measured radiation [18]. The above observations differ from those obtained at Canchones, whose the discontinuous pattern of solar radiation is indicative of a cloudy sky; in this location, the registered values of solar radiation were near 860 W/m2, which was slightly less than those at Huayquique. In relation to the Camiña location, the values for the solar radiation were lower than those registered in the other two cases mentioned above, reaching a maximum of 760 W/m2. This location has the fewest daylight hours of the three selected locations, which affects the temperature and solar radiation patterns at Camiña. Therefore, to corroborate the above discussion, the weather station was moved to different locations in the commune of Camiña; the average solar radiation registered was above 500 W/m2, and the solar still received approximately six hours of direct sunlight at all locations. Figure 5c depicts the wind speed in the three different locations of the experimental study. The highest values in the wind speed were observed at Huayquique (Figure 5 C1) during the afternoon of the second solar period in the study, reaching approximately 4.8 m/s; however, for the same location, during the first period, the maximum values did not rise above 2.5 m/s. This behavior proves the high variability of the wind speed on this zone; moreover, the wind speed pattern reveals that the higher wind speed is concentrated during the afternoon hours. In Camiña (Figure 5 C3), the maximum wind speeds registered were close to 3.8 m/s between 12:00 pm and 5:00 pm. At this location, during the day, the wind speed values were above 1.5 m/s, and at night, they reached 1.7 m/s (4 AM). At Canchones (Figure 5 C2), the wind speeds did not rise above 3.2 m/s; in particular, this location presented the lowest average wind speed of the three selected zones considered in this study. Note that this experimental study corresponds to the autumn season (south hemisphere); i.e., the values of wind speed, temperature and radiation were within the average range of those registered in the corresponding area during the year.
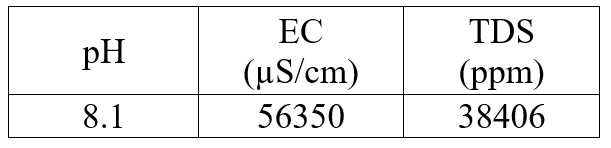
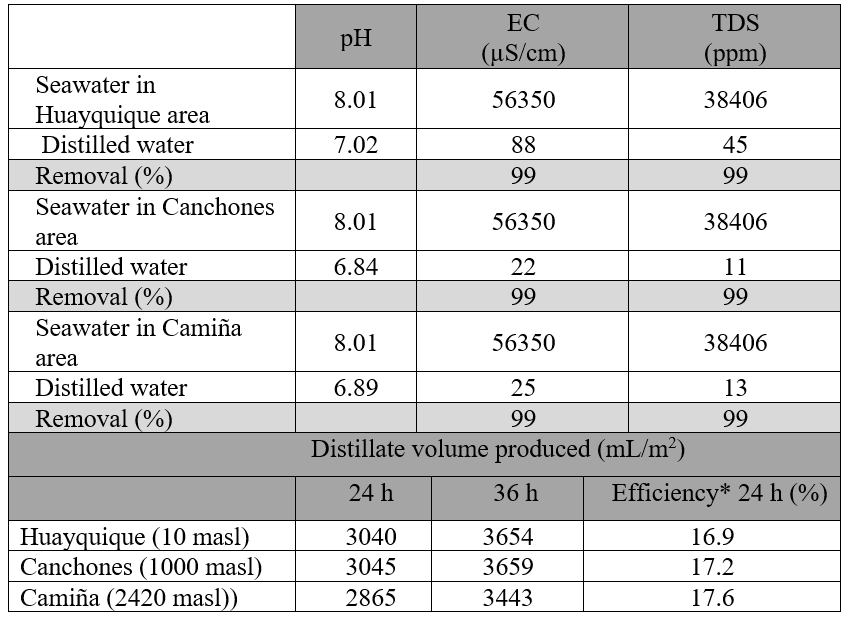
In Table 1, the values for pH, EC and TDS obtained from physicochemical analysis of the seawater used in the three selected locations of this study are presented.
Authors’ own creation
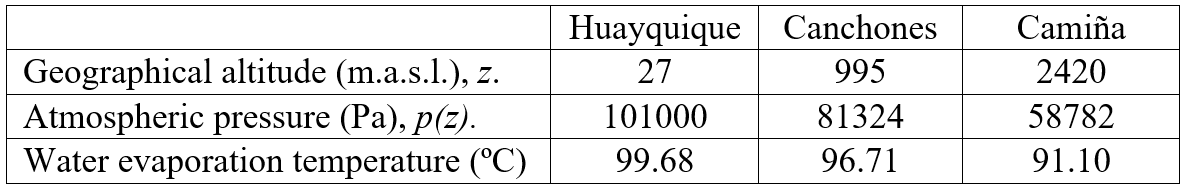
The results of the atmospheric pressure are shown in Table 2 for the three different locations. These results were obtained from the mathematical model expressed by equation (3), as previously defined.
Authors’ own creation
Table 2 shows decreases in the atmospheric pressure and the temperature of the evaporation of the water with increasing geographical altitude. This is revealed in the evaporation temperature of the water at Camiña, which is 9°C lower that that at Huayquique. This behavior favors the distilling process at Camiña because a lower temperature inside the solar still is required to evaporate the seawater is needed, unlike at Huayquique. Furthermore, to compare the volume of distilled water of the three locations in study, from Table 3, it is possible to infer that Camiña produces the most distilled water.
Authors’ own creation
In Table 3, the volume produced of distilled water at 24 and 36 hours along with the efficiency of the still in each location are shown. In each of the selected locations, the experimental measures started at 9 o’clock in the morning. Although the volumes of the produced distilled water at Huayquique and Canchones over 24 hours are very similar, close to 3040 mL/m2, the efficiency obtained at Canchones was higher than that at Huayquique. The main explanation for this difference is the altitude differences of both locations: the vapor temperature decreases with the increase of altitude, thereby affecting the enthalpy value, which is related to the efficiency of the solar stills. The case of Camiña presents the highest volume of distilled water of the three zones in the study, even though this location presents the lowest values of radiation, temperature and daylight hours of the three locations studied. The above result is related with the evaporation enthalpy (hfg), which has a direct dependence on the pressure; thus, according to equation (2), the best results of efficiency were obtained in Camiña. The decrease in the evaporation temperature with geographical altitude has a buffering effect on the decrease in volume of distilled water produced due to the disadvantageous environmental conditions at Camiña.
The volume of distilled water produced by the system over a period of 24 hours is in agreement with the productivities obtained by other researchers [36, 37]. Projecting these results to an area of 10 m2, one could produce the water required to supply a family of four people, considering the minimum water requirement suggested by the WHO for the consumption and preparation of food [38].
Figure 7 A,B,C1,C2,C3 shows the results for the temperatures measured inside the conventional solar still with the four thermocouples positioned, as indicated in Figure 4, at the three different locations studied for approximately 24 hours. From the plots, it is possible to infer that the temperature inside the solar still increased from 9:00 am to 4:00 pm, reaching a maximum value close to 55°C and a minimum of 35°C between 6:00 am to 8:00 pm. The temperatures of the thermocouple placed in the inner glass (Tp1) rose slowly compared with those of the fluids (Tp4); it is possible to observe this behavior in the solar still placed at Huayquique and Camiña. The temperature difference of approximately 8°C favors the production of distilled water in the condenser cover (inner glass) and coincides with the hours of larger production of distilled water. In relation to the measurements performed in Canchones, the difference in the temperatures of the thermocouples placed in the positions Tp1 and Tp4 is minimal. Even though Canchones presents better environmental conditions of radiation, temperature and wind speed than Huayquique does, the production of distilled water is not much higher than that produced at Huayquique.
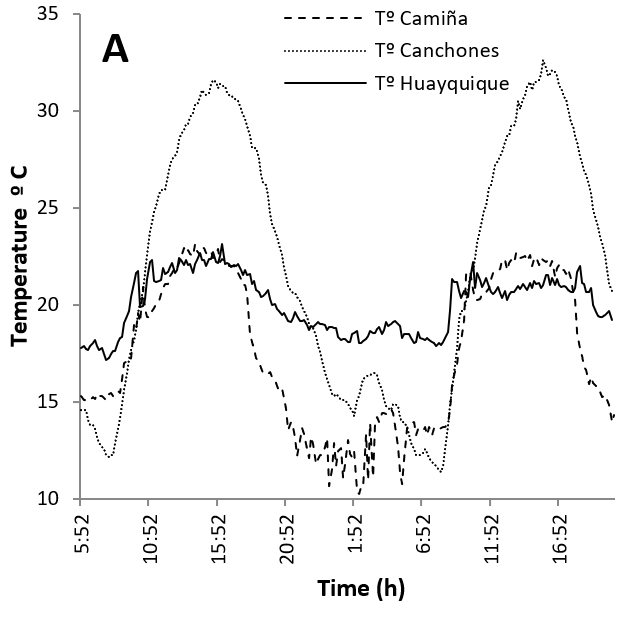
Figure 7. A
Environmental variables for 36 hours in three locations in the Region of Tarapacá at the same period of experimental measures.
Authors’ own creation
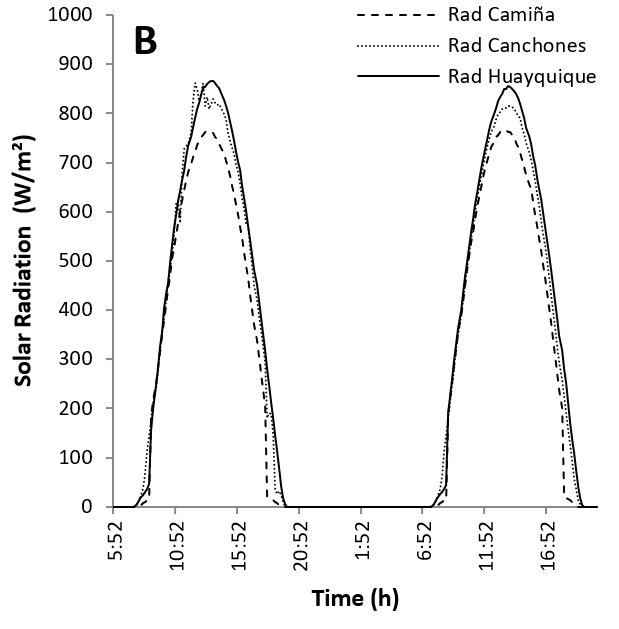
Figure 7. B.
Environmental variables for 36 hours in three locations in the Region of Tarapacá at the same period of experimental measures.
Authors’ own creation
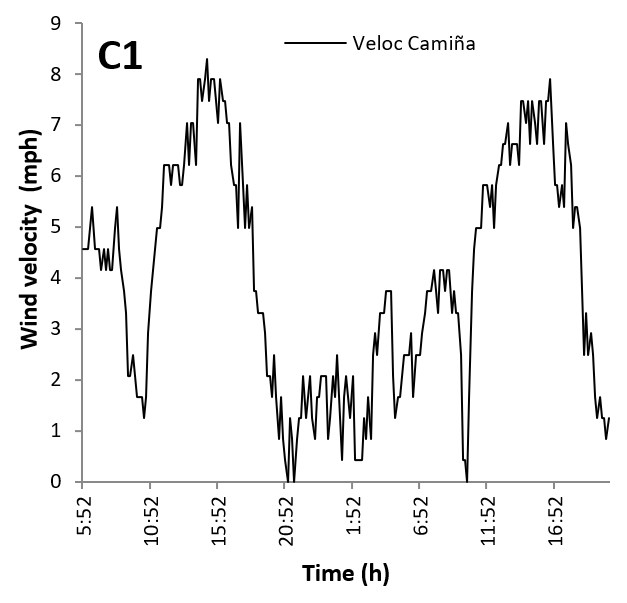
Figure 7. C1
Environmental variables for 36 hours in three locations in the Region of Tarapacá at the same period of experimental measures.
Authors’ own creation
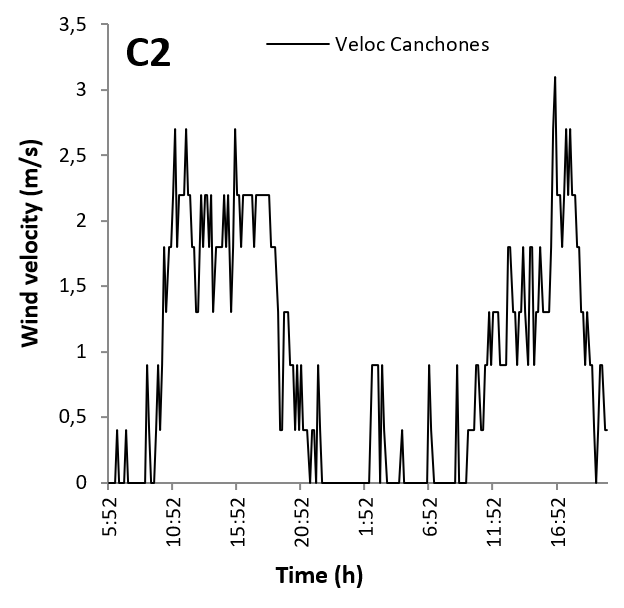
Figure 7. C2
Environmental variables for 36 hours in three locations in the Region of Tarapacá at the same period of experimental measures.
Authors’ own creation
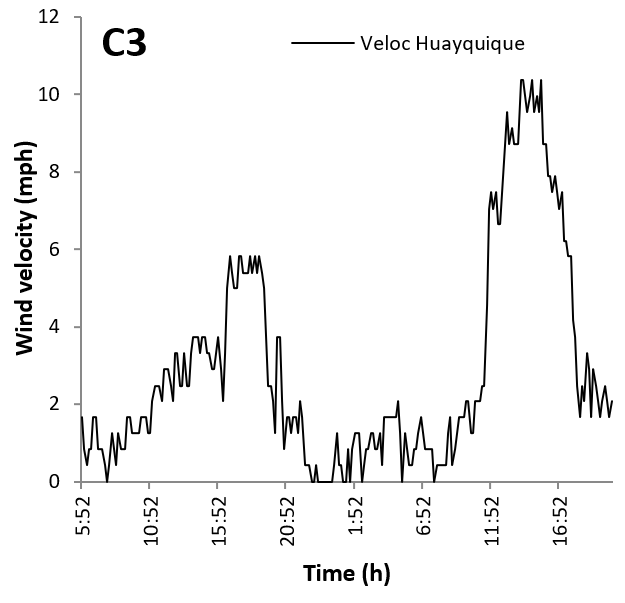
Figure 7. C3
Environmental variables for 36 hours in three locations in the Region of Tarapacá at the same period of experimental measures.
Authors’ own creation
Figure 8 A, B,C shows the graphs of EC, B and As concentration in the natural water of Canchones and Camiña between 2000 and 2012. Figure 8A shows that the electrical conductivity of Canchones is higher than that of Camiña; however, in both cases, the natural waters are considered brackish water according to Davis and Wiest (1967) classification. Figure 8B shows the B concentration; in this case, the concentration exceeds the limits established by the Chilean irrigation norm, NCH 1333. Although the concentration of As in natural waters varies seasonally, Figure 8C shows that at both locations, the As concentration exceeds the limits established for human consumption and for irrigation, NCh 409 and 1333, respectively, for ten consecutive years.
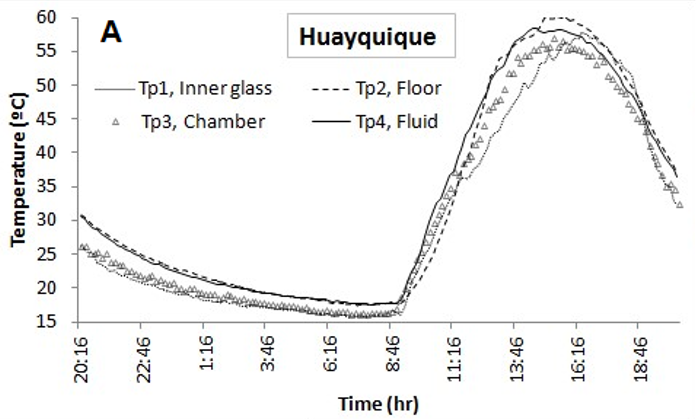
Figure 8. A
Temperature variations inside of the solar still, according with the positions of thermocouples described in the Fig. 4
Authors’ own creation
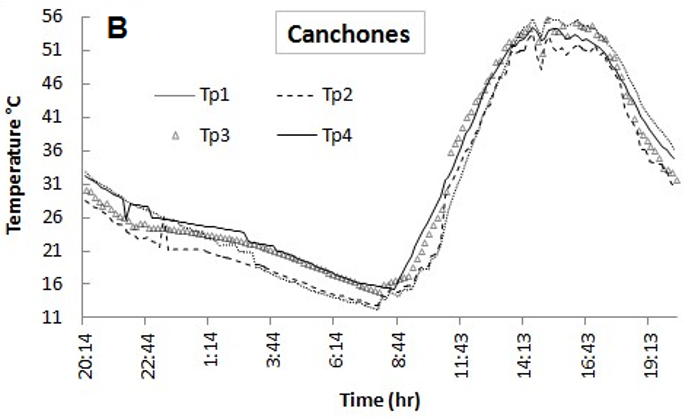
Figure 8. B.
Temperature variations inside of the solar still, according with the positions of thermocouples described in the Fig. 4
Authors’ own creation
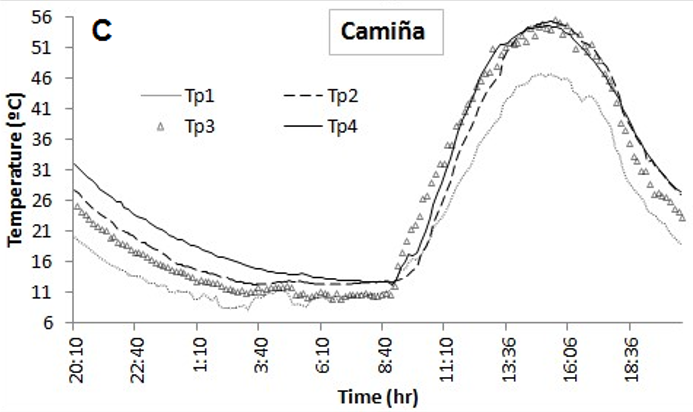
Figure 8. C.
Temperature variations inside of the solar still, according with the positions of thermocouples described in the Fig. 4
Authors’ own creation
Table 4 presents the experimental the results obtained from the physicochemical analysis of the brackish water from Camiña’s river and from the wells at Canchones; these results, in terms of their sample number, are exploratory. Additionally, the table presents the amounts of distilled water produced using the previously mentioned natural water sources. The natural waters of both locations contain high concentrations of TDS, B and As. These waters are used for human and animal consumption and for crop irrigation. The above water condition represents a risk for the population affecting the quality life. For the As concentration, the WHO sets a maximum concentration of 0.05 mg/L in water for human consumption based on the carcinogenic capacity [39], and the NCh 1333 sets a limit of 0.1 mg/L for water for crop irrigation because As inhibits the crop growth [40]. Alternatively, B is considered a micronutrient for crops; however, concentrations higher than 0.075 mg/L generate toxic effects, reducing plant growth as well as number and size of the fruit [41]. For water intended for human consumption, the WHO has set a provisional limit of 0.5 mg/L because more scientific evidence of the effects on health is required [39]. As shown in Table 4, the physicochemical analysis of the produced distilled water showed an important decrease in the TDS, B and As concentrations of 97%, 99% and 99.6%, respectively. The B concentrations in the produced distilled water were within the optimal recommended range for crop irrigations and human consumption. Similarly, the As concentrations in the produced distilled water obtained from the solar still were adequate for human consumption and crop irrigation. This result complies with the Chilean quality water requirements NCh 409 [42] and NCh 1333 [40], which establish 10 ppb and 100 ppb as the maximum concentrations of this element in water intended for human consumption and crop irrigation, respectively. Part of this larger production of distilled water could be caused by the lower salt content in the brackish water with respect to salt concentration in the seawater. The final part of Table 4 presents the volumes of produced distilled water from the two locations studied over 24 and 36 hours. In both locations, an important contribution to the distillation process occurred during the hours without daylight. More than 800 mL/m2 of distilled water was produced. The larger night productions can be associated with the lower environmental temperatures, the increase in wind speeds, and the good heat retention inside the solar still. According to the results obtained in this study, the TDS concentrations from the water used in the distillation process must be considered along with geographical altitude and environmental factors because these affect the productivity of the solar distillation process and the removal percentage of the elements.
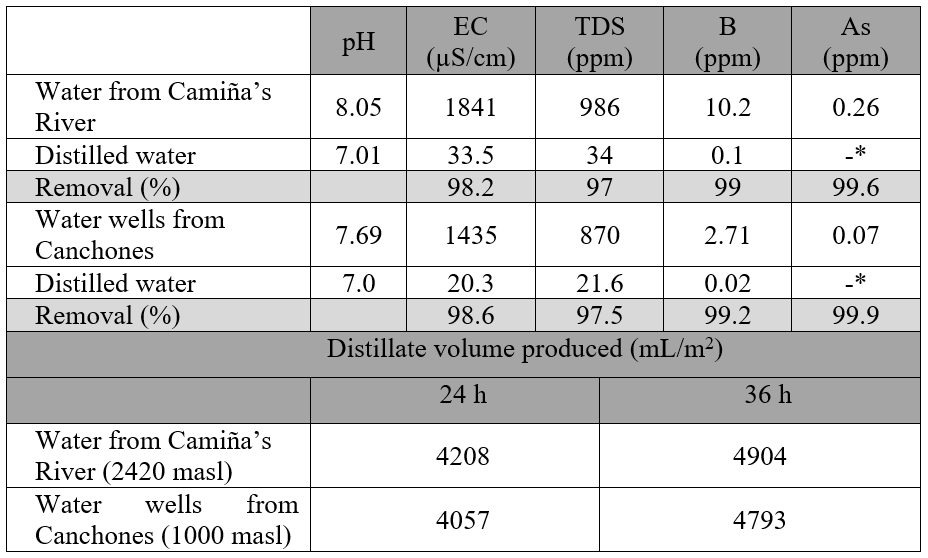
Authors’ own creation* Under the detection limit of the laboratory method used (2.0 x 10⁻³ or 0,002 mg/L for As).
4. Conclusion
The results obtained are of exploratory character for the selected locations. A study of the distillation process was performed at three selected locations with different environmental and geographical conditions in “Northern Chile”. The volumes of the produced distilled water in the three locations are very similar, despite the differences in the environmental temperatures and the total radiation measured. The geographical altitude positively affects the produced distilled water volume, provided that, under different environmental conditions, it does not decrease greatly. The volume of water produced by the solar still increased by approximately 1 L/m2 in all the experimental zones when water with low concentration of TDS is used. The results of this study show that when installing solar stills in “Northern Chile”, in addition to the environmental conditions of temperature, solar radiation and wind speed, both the geographical altitude and the concentrations of dissolved solids in the water used for desalination should be considered.
These results highlighted the potential of passive solar stills to remove hazardous contaminants from the water and identified the requirement of evaluating the efficiency of the removal of pollutants in marginal water sources, which could be alternative sources for the inhabitants of small towns in the Tarapacá region, given the serious water scarcity condition.
References
[1] Ayala, Cabrera y Asociados Ltda., “Análisis redes de vigilancia calidad aguas terrestres estadística hidroquímica nacional. Etapa I. Región Metropolitana,” Ministerio de Obras Públicas, Dirección Nacional de Aguas (DGA), Santiago de Chile, 1994. [Online]. Available: http://bibliotecadigital.ciren.cl/bitstream/handle/123456789/2582/DGA088.pdf?sequence=1&isAllowed=y
[2] V. Herrera, C. Carrasco, P. Sandoval, and C. Cortés, “Transferencia de arsénico en el sistema aguasuelo- maíz de zea mays l. cultivados en la quebrada de Camiña, norte de Chile,” Rev. Soc. Quím. Perú, vol 83, no. 1, 2017. [Online]. Available: http://www.scielo.org.pe/scielo.php?script=sci_arttext&pid=S1810-634X2017000100006
[3] CNE, PNUD, UTFSM. (2008). Irradiancia Solar en Territorios de la República de Chile, Santiago de Chile, 2008. [Online]. Available: http://www.plataformacaldera.cl/biblioteca/589/articles-64683_documento.pdf
[4] Pr.K. Abdenacer, and S. Nafila, “Impact of temperature difference (water-solar collector) on solar still global efficiency,” Desalination, vol. 209, no. 1-3, pp. 298-305, 2007. [Online]. Available: https://doi.org/10.1016/j.desal.2007.04.043
[5] J.G. Hirschman, “A solar energy pilot plant for northern Chile,” Solar Energy, vol. 5, no.2, pp. 37-43, Apr-Jun 1961. [Online]. Available: https://doi.org/10.1016/0038-092X(61)90001-9
[6] A. K. Kaviti, A. Yadav, and A. Shukla, “Inclined solar still designs: A review,” Renew. Sustain. Energy Rev., Vol. 54, pp. 429-451, 2016. [Online]. Available: https://doi.org/10.1016/j.rser.2015.10.027
[7] D. W. Rufuss, S. Iniyan, L. Suganthi, and P.A. Davies, “Solar stills: A comprehensive review of designs, performance and material advances,” Renew. Sustain. Energy Rev., Vol. 63, pp. 464-496, 2016. [Online]. Available: https://doi.org/10.1016/j.rser.2016.05.068
[8] K. Kalidasa Murugavela, Kn.K.S.K. Chockalingam, and K. Srithar, “Progresses in improving the effectiveness of the single basin passive solar still,” Desalination, Vol. 220, No. 1-3, pp. 677-686, Mar 2008. [Online]. Available: https://doi.org/10.1016/j.desal.2007.01.062
[9] Z. M. Omara, A. E. Kabeel, and M. M. Younes, “Enhancing the stepped solar still performance using internal reflectors,” Desalination, Vol. 314, No. 2, pp. 67–72, Apr 2013. [Online]. Available: https://doi.org/10.1016/j.desal.2013.01.007
[10] C-D. Park, B-J. Lim, K-Y. Chung, S-S. Lee, and Y-M. Kim, “Experimental evaluation of hybrid solar still using waste heat,” Desalination, Vol. 379, No. 1, pp. 1-9, 2006. [Online]. Available: https://doi.org/10.1016/j.desal.2015.10.004
[11] S. Abdallaha, O. Badranb, and M. Abu-Khader, “Performance evaluation of a modified design of a single slope solar still,” Desalination, Vol. 219, No. 1–3, pp. 222-230, Jan 2008. [Online]. Available: https://doi.org/10.1016/j.desal.2007.05.015
[12] K.V. Kumar, and R.K. Bai, “Performance study on solar still with enhanced condensation,” Desalination, Vol. 230, No. 1-3, pp. 51-61, Sep 2008. [Online]. Available: https://doi.org/10.1016/j.desal.2007.11.015
[13] R. Samuel Hansen, and K. Kalidasa Murugavel, “Enhancement of integrated solar still using different new absorber configurations: An experimental approach,” Desalination, Vol. 422, pp. 59-67, Nov 2017. [Online]. Available: https://doi.org/10.1016/j.desal.2017.08.015
[14] O. Ansari, M. Asbik, A. Bah, A. Arbaoui, and A. Khmou, “Desalination of the brackish water using a passive solar still with a heat energy storage system,” Desalination, Vol. 324, pp. 10-20, Sep 2013. [Online]. Available: https://doi.org/10.1016/j.desal.2013.05.017
[15] M. Abu-Arabi, and Y. Zurigat, “Year-round comparative study of three types of solar desalination units,” Desalination, Vol. 172, No. 2, pp. 137-143, Feb 2005. [Online]. Available: https://doi.org/10.1016/j.desal.2004.05.011
[16] T. Abderachid, and K. Abdenacer, “Effect of orientation on the performance of a symmetric solar still with a double effect solar still (comparison study),” Desalination, Vol. 329, pp. 68–77, Nov 2013. [Online] Available: https://doi.org/10.1016/j.desal.2013.09.011
[17] B. Bouchekima, “A small solar desalination plant for the production of drinking water in remote arid areas of southern Algeria,” Desalination, Vol. 159, No. 2, pp. 197-204, Oct 2003. [Online]. Available: https://doi.org/10.1016/S0011-9164(03)90071-3
[18] D. Bechki, H. Bouguettaia, J. Blanco-Galvez, S. Babay, B. Bouchekima, S. Boughali, and H. Mahcene, “Effect of partial intermittent shading on the performance of a simple basin solar still in south Algeria,” Desalination, Vol. 260, No.1-3, pp. 65–69, Sep 2010. [Online]. Available: https://doi.org/10.1016/j.desal.2010.04.066
[19] A.A. El-Sebaii, “Effect of wind speed on some designs of solar stills,” Energy Convers. Manage, Vol. 41, No. 6, pp. 523-538, Apr 2000. [Online]. Available: https://doi.org/10.1016/S0196-8904(99)00119-3
[20] A. Hanson, W. Zachritz, K. Stevens, L. Mimbela, R. Polka, and L. Cisneros, “Distillate water quality of a single-basin solar still: laboratory and field studies,” Solar Energy Vol. 76, No. 5, pp. 635-645, 2004. [Online]. Available: https://doi.org/10.1016/j.solener.2003.11.010
[21] S. Aboul-Enein, A.A. El-Sebaii, and E. El-Bialy, “Investigation of a single-basin solar still with deep basins,” Renew. Energy, Vol. 14, No. 1-4, pp. 299–305, May-Aug 1998. [Online]. Available: https://doi.org/10.1016/S0960-1481(98)00081-0
[22] J. Karlsson, and A. Roos, “Modelling the angular behavior of the total solar energy transmittance of windows,” Solar Energy, Vol. 69, No. 4, pp. 321-329, 2000. [Online] Available: https://doi.org/10.1016/S0038-092X(00)00083-9
[23] G.N. Tiwari, J.M. Thomas, and E. Khan, “Optimisation of glass cover inclination for maximum yield in a solar still,” Heat Recov. Syst. CHP, Vol. 14, No. 4, pp. 447-455, Jul 1994. [Online]. Available: https://doi.org/10.1016/0890-4332(94)90048-5
[24] A.K. Singh, G.N. Tiwari, P.B. Sharma, and E. Khan, “Optimization of orientation for higher yield of solar still for a given location,” Energy Convers. Manage., Vol. 36, No. 3, pp. 175-181, Mar 1995. [Online]. Available: https://doi.org/10.1016/0196-8904(94)00045-2
[25] A.K Tiwari, and G.N. Tiwari, “Effect of water depths on heat and mass transfer in a passive solar still: in summer climatic condition,” Desalination, Vol. 195, No. 1-3, pp. 78-94, Aug 2006. [Online]. Available: https://doi.org/10.1016/j.desal.2005.11.014
[26] R. Tripathi, and G.N Tiwari, “Thermal modeling of passive and active solar stills for different depths of water by using the concept of solar fraction,” Solar Energy, Vol. 80, No. 8, pp. 956-967, Aug 2006. [Online]. Available: https://doi.org/10.1016/j.solener.2005.08.002
[27] N.H.A. Rahim, “Utilisation of new technique to improve the efficiency of horizontal solar desalination still,” Desalination, Vol. 138, No. 1-3, pp. 121-128, Sep 2001. [Online]. Available: https://doi.org/10.1016/S0011-9164(01)00253-3
[28] M. K. Phadatare, and S. K. Verma, “Influence of water depth on internal heat and mass transfer in a plastic solar still,” Desalination, Vol. 217, No. 1-3, pp. 267-275, Nov 2007. [Online]. Available: https://doi.org/10.1016/j.desal.2007.03.006
[29] J. Duffie, and W. Beckman, “Available solar radiation,” in Solar Engineering of Thermal Processes, Madison, WI, US: John Wiley & Sons, Inc., 1980, pp. 3-147.
[30] S. M. Radwan, A. A. Hassanain, and M. A. Abu-Zeid, “Single slope solar still for seawater distillation,” World App. Sci. J. Vol. 7, No. 4, pp. 485-497, 2009. [Online]. Available: http://www.idosi.org/wasj/wasj7(4)/13.pdf
[31] National Oceanic and Atmospheric Administration, National Aeronautics And Space Administration, United States Air Force, U.S. Standard Atmosphere, U.S.A , Washington D.C., 1976.
[32] N. Schulz, J. P. Boisier, and P. Aceituno, “Climate change along the arid coast of northern Chile,” Int. J. Climatol., Vol. 32, pp. 1803-1814, 2011. [Online]. Available: https://doi.org/10.1002/joc.2395
[33] P. Cereceda, H. Larrain, P. Osses, M. Farías, I. Egaña, 2008. “The climate of the coast and fog zone in the Tarapacá Region, Atacama Desert, Chile,” Atmos. Res. Vol.87, No. 3-4, pp 301-311, Mar 2008. [Online]. Available: https://doi.org/10.1016/j.atmosres.2007.11.011
[34] F. del Sol, and E. Sauma, “Economic impacts of installing solar power plants in northern Chile,” Renew. Sustain. Energy Rev. Vol.19, pp. 489-498, Mar 2013. [Online]. Available: https://doi.org/10.1016/j.rser.2012.11.038
[35] S. Davis, R. de Wiest, Hidrogeologia, Barcelona: Ariel, 1967.
[36] R. Arun Kumar, G. Esakkimuthu, and K. Kalidasa Murugavel, “Performance enhancement of a single basin single slope solar still using agitation effect and external condenser,” Desalination, Vol. 399, pp. 198-202, Dec 2016. [Online]. Available: https://doi.org/10.1016/j.desal.2016.09.006
[37] N. Rahbar, J. A. Esfahani, and A. Asadi, “An experimental investigation on productivity and performance of a new improved design portable asymmetrical solar still utilizing thermoelectric modules,” Energy Convers. Manage., Vol. 118, pp. 55-62, Jun 2016. [Online]. Available: https://doi.org/10.1016/j.enconman.2016.03.052
[38] G. Howard, and J. Bartram, “Domestic Water Quantity, Service, Level and Health”. Geneva, Switzerland: WHO, 2003, p. 9. [Online]. Available: http://www.who.int/water_sanitation_health/diseases/WSH03.02.pdf
[39] WHO, “Guías para la calidad del agua potable”, 3a ed. Geneva, Switzerland: WHO, 2004, p. 255-267. [Online]. Available: https://www.who.int/water_sanitation_health/dwq/gdwq3_es_fulll_lowsres.pdf?ua=1
[40] Requisitos de la calidad del agua para diferentes usos, NCh 1333/ of 78, 1987.
[41] R.O. Nable, G. S. Bañuelos, and J. G. Paull, “Boron toxicity,” Plant and Soil, Vol. 193, No. 1-2, pp. 181-198, 1997
[42] Agua Potable - Parte 1: Requisitos, que establece los requisitos de calidad que debe cumplir el agua potable en todo el territorio nacional, NCh 409/1.Of., 2005.
Notes
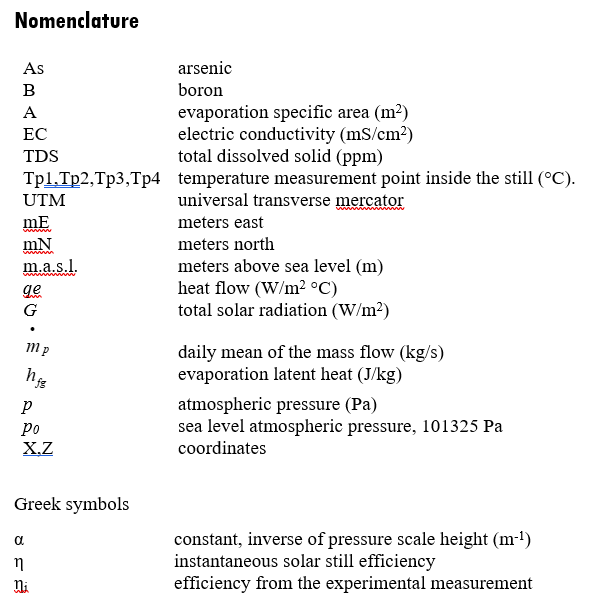
Nomenclatura
Nomenclatura
Autor
Author notes