010 Trabajo Científico
Developing NIR spectroscopy models for a breeding programme of Eucalyptus grandis for timber production
Desarrollo de modelos de espectroscopia del infrarrojo cercano para un programa de mejoramiento genético de Eucalyptus grandis orientado a la producción de madera
Developing NIR spectroscopy models for a breeding programme of Eucalyptus grandis for timber production
Quebracho - Revista de Ciencias Forestales, vol. 27, núm. 2, pp. 76-85, 2019
Universidad Nacional de Santiago del Estero

Esta obra está bajo una Licencia Creative Commons Atribución 4.0 Internacional.
Recepción: 01 Octubre 2018
Aprobación: 01 Marzo 2019
Abstract: In order to screen genotypes of Eucalyptus grandis, near infrared spectroscopy models were developed to estimate physical and mechanical wood properties for a breeding programme aimed at producing solid wood products. For this purpose, 60 twelve-year-old trees from three progeny trials were felled to obtain wood samples. One hundred samples, which represented the species wood variability, were used to make the physical and mechanical measurements. The physical variables measured were basic and air-dried density, while mechanical variables included the flexural properties modulus of elasticity and modulus of rupture as well as wood hardness. Modulus of elasticity and modulus of rupture were measured through a universal testing machine in static bending, whereas wood hardness was determined on tangential and radial faces by means of Janka hardness test. Partial least squares regression was the technique used to predict wood properties. The NIR spectroscopy models yielded similar errors for calibration and validation sets. These models had coefficient of determination (R2.) ranging from 0.74 to 0.93, while their ratio of performance to deviation (RPD) fluctuated from 2.0 to 3.7. The most reliable models were those developed for basic and air-dried wood density, because their RPD values were the highest; in contrast, the models for modulus of elasticity, modulus of rupture and hardness had lower RPD than the models for wood density, making them suitable for rough screening. Near infrared spectroscopy estimated physical and mechanical wood properties accurately, enabling the breeding programme of Eucalyptus grandis to ease and speed up measurements.
Keywords: hardness, near infrared spectroscopy, static bending test, tree selection, wood quality.
Resumen: El objetivo de la investigación fue ajustar modelos de espectroscopia del infrarrojo cercano para estimar propiedades físicas y mecánicas de la madera en un programa de mejoramiento genético de Eucalyptus grandis orientado a la obtención de productos sólidos. Con este propósito se apearon 60 árboles de 12 años de edad en tres ensayos de progenies a partir de los cuales se obtuvo las muestras de madera. Se utilizaron cien probetas para hacer mediciones de propiedades físicas y mecánicas. Las propiedades evaluadas fueron densidad básica, densidad seca al aire, módulo de elasticidad, módulo de rotura y dureza. Se utilizó una máquina universal para medir módulo de elasticidad, módulo de rotura y dureza Janka sobre caras tangenciales y radiales. Se usó la regresión por mínimos cuadrados parciales para ajustar los modelos predictivos. Los errores estadísticos de los modelos fueron similares para los conjuntos de datos de calibración y de validación. Valores del coeficiente de determinación (R2) variaron de 0,74 a 0,93; mientras la relación de la desviación de la predicción (RPD) varió de 2,0 a 3,7. Los modelos de densidad básica y densidad seca al aire fueron los más precisos, con valores más altos de RPD; mientras que los modelos para módulo de elasticidad, módulo de rotura y dureza presentaron valores más bajos de RPD. La espectroscopia del infrarrojo cercano fue exitosa para estimar propiedades físicas y mecánicas de la madera. Estos modelos facilitarán y acelerarán las mediciones en el programa de mejoramiento genético de la especie.
Palabras clave: dureza, espectroscopia NIR, ensayo de flexión estática, selección genética, calidad de madera.
1. INTRODUCTION
Eucalyptus grandis (Hill) Maiden is the main Eucalyptus species established in Argentina. The Northeast of the country has around 250,000 ha planted with this species (SAGyP, 2018), mainly used for a wide range of solid wood products, such as poles, pallets, structural timber, floors, boards and furniture (Sánchez Acosta, 1995). Forest plantations have traditionally been managed to clear-cut at about age 12 for producing sawn boards, but the emergence of new genetic materials with higher growth and the production of other final products are significantly reducing the time for felling. To satisfy the local demand of genetic material for planting, the Instituto Nacional de Tecnología Agropecuaria (INTA) carries out a breeding programme of E. grandis, aimed to improve not only growth, but also wood quality (Harrand et al., 2009).
Because it is widely used as a measure of wood quality, wood density is the most common wood property included in tree breeding programmes (Zhang and Morgenstern, 1995; Zobel and Jett, 2012). Wood density is currently assessed by INTA in standing trees, through devices such as pilodyn, resistograph or increment borer (López, 2005). However, these instruments do not allow researchers to evaluate other features of wood, such as mechanical properties. As frequent applications of eucalypt wood in Argentina involve using the material as joists and floors, the ability to resist loads and indentation has become an important consideration. Characterization of hardness and flexural properties of INTA’s breeding population of E. grandis might add new information about the suitability of some genotypes for timber production. In addition, characterization of wood properties has become imperative as eucalyptus clonal plantation increases, because large areas of clonal plantations imply the same good or bad features of wood quality for supplying the industry.
Near infrared (NIR) spectroscopy has been broadly applied to the rapid and non-destructive analysis of physical and mechanical wood properties over the last years, showing great potential in the analysis of solid wood in lab tests (Fujimoto et al., 2008). Several successful NIR spectroscopy models have been developed around the world to predict wood density under laboratory conditions in Eucalyptus spp. (Schimleck et al., 1999; Hein et al., 2009a; Inagaki et al., 2012), whereas others have been developed for predicting the flexural properties modulus of elasticity and modulus of rupture (Esteves and Pereira, 2008; Kothiyal and Raturi, 2011). However, no information is available about the feasibility of developing NIR spectroscopy models to predict wood hardness. Although it is well known that wood hardness is highly correlated with wood density (Holmberg, 2000), this does not necessarily apply to NIR spectroscopy models, which may not have a similar performance for these variables.
Setting up NIR spectroscopy models for predicting physical and mechanical wood properties would enable INTA’s breeding programme of E. grandis to evaluate a large number of genotypes and measure different features simultaneously and quickly. In the light of these considerations, the aim of this study was to develop NIR spectroscopy models to predict wood density, modulus of elasticity, modulus of rupture and hardness of E. grandis wood for tree selection.
2. MATERIALS AND METHODS
Sample preparation and measurement of physical and mechanical properties
The samples for the study were obtained from 12 year old Eucalyptus grandis trees belonging to three progeny trials located in the provinces of Corrientes and Misiones, Northeastern Argentina. For each trial, 20 trees were sampled, totaling 60 trees. Diameter at breast height (1.3 m) was measured with a caliper on trees selected by growth and form, having an average value of 34.3 (±4.13) cm. Trees were then felled with a chainsaw and 1 m long billets were cut from each downed tree at breast height. A 100 mm thick board was sawn from each billet centred on the pith in a north-south direction. Boards were transported to facilities where they naturally dried to the equilibrium moisture content. A total of 356 defect-free samples measuring 20 mm x 20 mm x 360 mm (radial [R], tangential [T] and longitudinal [L] directions, respectively) were sawn from pith to bark for each dried board. To work with only the most representative samples of the species wood variability, all samples were ordered from the lowest to the highest value of air-dried wood density, which had been previously measured by determining mass and volume with a scale and small caliper, respectively. One hundred samples (n = 100) were then systematically selected from the total, following all the range of variation of the property. These samples were hereafter used to make the experiment.
First, values of the variables modulus of elasticity (MOE) and modulus of rupture (MOR) were obtained through static bending tests. Second, three small clear specimens were generated from each single sample after the static bending test was conducted. These wood samples were used as follows: a 20 (R) x 20 (T) x 150 (L) sample for Janka hardness determination, a 20 (R) x 20 (T) x 20 (L) mm sample to calculate moisture content and wood density, and a 20 (R) x 20 (T) x 50 (L) mm sample for NIR measurements (Figure 1).
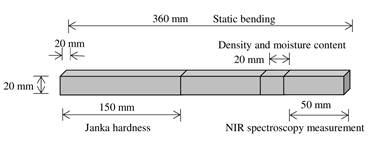
Figure 1
Sample used for physical and mechanical tests
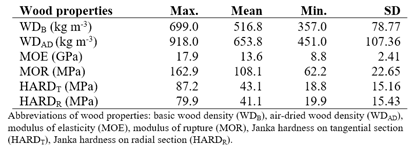
A universal testing machine (50 kN load) was used to determine mechanical properties. A three-point static bending test according to the DIN 52186 standard (1992) was performed to determine MOE and MOR values for each clear sample. The Janka hardness determination was done to obtain two measurements per sample on tangential (HARDT) and radial (HARDR) sections, using the machine with a constant and equal speed of 5 mm/min. To measure wood density on 20 mm x 20 mm x 20 mm samples, the procedures of the IRAM 9544 standard (1985) were followed, but replacing the health-hazardous mercury of the pycnometer with distilled water, as described by Coronel (1994). Two different measurements of wood density were made on the same single sample: Air-dried wood density (WDAD) and basic wood density (WDB). The former was measured at atmospheric conditions, while the latter was measured after assessing WDAD, rehydrating the sample in water during 164 h to obtain green volume and drying in oven at 103 ±2 ºC to obtain dried mass. According to the difference in weights between air-dried samples and oven-dried samples, the average moisture content was 14.2 %. Statistical descriptors for physical and mechanical properties of the study are shown in Table 1.
NIR measurements and data analysis
Radial sections of wood samples were sanded with a P100 sand paper grade. Thereafter, samples were conditioned in a chamber at 22 °C and 50 % relative humidity for 48 h before NIR measurement. The NIR spectra were acquired with a Bruker spectrophotometer, model MPA, with the integer sphere in direct contact with one radial section of the sample. A mask with a 20x20 mm window was used to ensure analysing an area of constant size. NIR measurements were made with 64 scans per position, over the wavelength range 11500-3825 cm-1 and with a resolution of 8 cm-1. The spectral patterns of wood samples are shown in Figure 2.
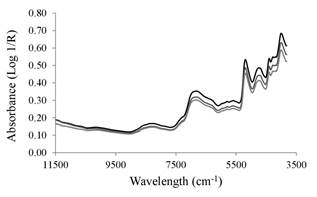
Figure 2
The NIR diffuse reflectance of wood samples from three radial positions
In order to show the effect of radial position on the spectra of samples and make a preliminary exploration of the data, a principal component analysis (PCA) was carried out. Next, the partial least squares regression (PLS-R) technique was used for estimating wood properties of Eucalyptus grandis. To adjust PLS-R models, the data were randomly split into two independent, equally sized sets. One half was used to develop a calibration model, while the other was used for validation. The calibration set was the basis to select the best band combination and the best pre-processing method by automatic optimization. The pre-processing methods used on the raw spectrum were offset elimination, straight line subtraction, vector normalization, multiple scattering correction, 1st derivative and 2nd derivative. The leave-one-out cross-validation procedure was used to adjust the calibration set. Estimations were made with a maximum of 10 latent variables (rank) and detected outliers were removed from the models. The lowest statistical error and the lowest number of latent variables were the criteria used to select the models. Calibration and validation were compared for each wood property by the coefficient of determination (R2), the ratio performance to deviation (RPD), the root mean square of cross-validation (RMSCV) and the root mean square of prediction (RMSEP). The Opus Quant software package vs 6.5 (Bruker Optics, Germany) was used for the multivariate analyses used in the study.
3. RESULTS AND DISCUSSION
The principal component analysis (Figure 3) showed that 91 % of the data variation was explained by principal component 1 (PC1), while 8.1 % was explained by principal component 2 (PC2). Samples from three radial positions were gathered in three groups; Group 1 represents the samples collected near the bark, while Group 3 represents the samples collected near the pith. The samples from Group 2 occupied a position in between the other two groups. Each of the three ellipses at a 95 % confidence interval included most samples taken from the same radial position. The PCA was able to sort samples quite well according to their position within the radius using spectral data.
Figure 3
The Principal component analysis of the spectral information from wood samples of three radial positions Squares circles and triangles indicate radial positions 1 2 and 3 respectively
Different spectrum ranges were reached for wood properties by automatic optimization. Derivate plus straight line subtraction, second derivative and no pre-process of the signal were the pre-processing methods chosen. PLS-R models yielded quite strong relationships between measured and predicted values with coefficient of determination ranging from 0.74 to 0.93. In addition, RMSECV and RMSEP values did not show large differences for each wood property. The number of latent variables (rank) was always the same for calibration and validation sets. They were equal to 1 for all variables but modulus of elasticity, whose rank was 3. The RPD ranged from 2.0 to 3.7, while the number of outliers varied from 1 to 5. Table 2 shows the pre-processing method, the wavelength and statistics of PLS-R models for calibration and validation for each wood property.
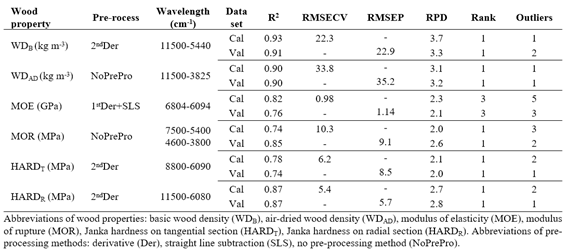
The best NIR models were achieved for wood density. The highest values of R2 (0.90 and 0.93) and RPD (3.1 and 3.7) were obtained for basic and air-dried wood density. Since values of RPD higher than 3 can be considered satisfactory for screening (Baillères et al., 2002), these models can be definitely used for plant breeding. Table 2 shows that values of R2 and RPD were slightly better for basic wood density than for air-dried wood density. The reason for this behaviour may be that basic wood density is not affected by environmental humidity, resulting in more accurate models with lesser variation than models of air-dried wood density. Figure 4 shows the relationship between measured data and predicted values by NIR spectroscopy for basic and air-dried wood density. For both variables, calibration and validation sets seemed to have a relatively small dispersion around the tendency line adjusted.
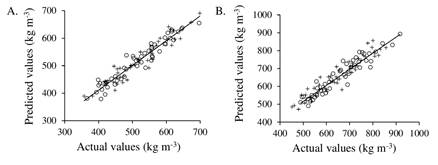
Figure 4
Plots of measured versus predicted values for the variables (A) basic wood density (WDB); (B) air-dried wood density (WDAD). Circles indicate the calibration set and plus signs indicate the validation set. The tendency line was adjusted on the calibration set.
The present study shows that statistical errors RMSECV and RMSEP of the variable basic wood density were lower than the outcomes obtained by Hein et al. (2009b), who estimated that statistical errors of NIR spectroscopy models ranged from 25 kg m-1to 32 kg m-1in a mix of samples of E. grandis and E. urophylla. These authors also found that maximum values of R2 and RPD were 0.87 and 2.6, respectively (lower than those of the present study). As regards air-dried wood density, Schimleck et al. (2001) adjusted a NIR spectroscopy model in E. delegatensis, giving R2 and statistical error of 0.91 kg m-1and 19 kg m-1, respectively. Another study showed a NIR spectroscopy model for E. camaldulensis, whose R2 and statistical error were 0.93 kg m-1and 26 kg m-1, respectively (Inagaki et al. 2012). These previous studies showed higher R2 and lower errors than the present study, but they also used a higher number of latent variables (7 for the former and 8 for the latter).
Flexural properties modulus of elasticity and modulus of rupture yielded relatively good models, most likely suitable for rough screening, since values of RPD varied from a minimum of 2.0 to a maximum of 2.6 (Table 2). Values of R2 ranged from 0.76 to 0.82 for modulus of elasticity, while the corresponding values for modulus of rupture varied from 0.74 to 0.85. Besides, modulus of rupture provided better statistical values (statistical error, R2 and RPD) for validation than calibration. Figure 5 shows the relationship between measured data and predicted values by NIR spectroscopy for modulus of elasticity and modulus of rupture. For both variables, the dispersion shown in the graphs was higher than that presented above for wood density.
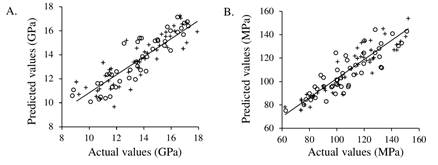
Figure 5
Plots of measured versus predicted values for the variables (A) modulus of elasticity (MOE); (B) modulus of rupture (MOR). Circles indicate the calibration set and plus signs indicate the validation set. The tendency line was adjusted on the calibration set.
The results of the present study were similar to those of Kothiyal and Raturi (2011), who made calibrations for E. tereticornis wood in static bending tests. They adjusted models for modulus of elasticity, whose R2 and RPD were 0.82 and 2.29 respectively, whereas their models for modulus of rupture had R. and RPD equal to 0.83 and 2.13, correspondingly. On the other hand, Esteves and Pereira (2008) found good models for modulus of rupture (R2 = 0.75), but poor quality in models for modulus of elasticity (R2 = 0.47), when wood of E. globulus was tested in static bending. The literature also reports on the use of SilviScan and resonance methods to calibrate NIR models for both flexural properties in several eucalypt species, giving R2 from 0.74 to 0.90 (Schimleck et al., 2001; Hein et al., 2010; Wentzel-Vietheer et al., 2013).
As regards the Janka hardness measurement, both radial and tangential sections yielded good NIR models. Their R2 ranged from 0.74 to 0.87, whereas their RPD varied from 2 to 2.8, making the models useful for predicting and screening. NIR spectroscopy models of Janka hardness showed different performance between both surfaces: models for tangential sections showed higher errors (up to 49 %) than models for radial sections, while models for radial sections showed higher R2 and RPD (up to 18 and 40 %, respectively) than those for tangential sections. This behaviour can be easily explained by the fact that NIR measurements were taken only on radial sections. Because wood is a heterogeneous and anisotropic material, wood properties have been better explained in terms of the side where measurements were taken. As no previous studies on near infrared spectroscopy in wood hardness are available, comparisons are not feasible. Figure 6 shows the relationship between measured data and predicted values by NIR spectroscopy for Janka hardness measured on tangential and radial sections. Once again, the dispersion of data shown in the graphs was higher than that found for wood density.
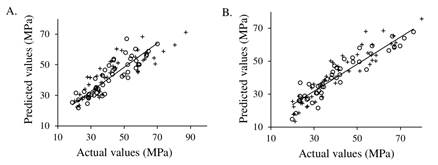
Figure 6.
Plots of measured versus predicted values for the variables (A) Janka hardness on tangential section (HARDT); (B) Janka hardness on radial section (HARDR). Circles indicate the calibration set and plus signs indicate the validation set. The tendency line was adjusted on the calibration set.
The results show that the developed PLS-R models can be used to measure wood properties of Eucalyptus grandis with satisfactory accuracy. Because of their higher values of RPD, NIR spectroscopy models for wood density will allow more reliable predictions than NIR spectroscopy models for flexural properties and hardness. INTA’s breeding programme can use these models to estimate physical and mechanical wood properties by two different approaches. Both approaches will require the extraction of increment cores from selected trees with an increment borer. One approach consists in making measurements using a fiber optic probe. This methodology allows researchers to take measurements on specific areas of the increment core after obtaining a radial flat surface from it. The other method involves using the integer sphere for measuring flat radial surfaces of the increment core. In order to take the measurements, this method will require a mask to assure a constant area for the wooden sample. INTA’s breeding programme of E. grandis may benefit from both methodologies. These satisfactory PLS-R models should be used to shorten the time and ease procedures of traditional measurements of wood properties.
4. CONCLUSION
NIR spectroscopy models successfully predicted physical and mechanical properties of E. grandis wood, explaining variability from 0.74 to 0.93. The most reliable models were those developed for wood density, whose values of RPD were the highest, whereas the models for modulus of elasticity, modulus of rupture and hardness had lower RPD, making them suitable for rough screening. The use of NIR spectroscopy models represents an improvement for the breeding programme of the species, allowing selection of genotypes from their physical and mechanical wood properties. These models should be used to ease and speed up measurements for tree selection.
Acknowledgments
The author deeply appreciates the training in near infrared spectroscopy given by Jose Carlos Rodrigues, Ana Alves and Rita Simões. He also wishes to thank Juan Lopez for providing the experimental material of the study, Gonçalo Pontes for helping in laboratory activities and Alejandro Martinez Meier for his useful suggestions.
5. REFERENCES
Baillères, H.; F. Davrieux; F. Ham-Pichavant. 2002. Near infrared analysis as a tool for rapid screening of some major wood characteristics in a eucalyptus breeding program. Annals of Forest Science 59(5-6): 479-490.
Coronel, E. O. 1994. Fundamentos de las propiedades físicas y mecánicas de la madera. Aspectos teóricos y prácticos para la determinación de las propiedades y sus aplicaciones. 1ra Parte: Fundamentos de las propiedades físicas de la madera. Publicación ITM, UNSE, Argentina. 187 p.
DIN 52186. 1992. Deutsches Institut für Normung. Prüfung von Holz; Biegeversuch.
Esteves, B.; H. Pereira. 2008. Quality assessment of heat-treated wood by NIR spectroscopy. Holz als Roh- und Werkstoff 66(5): 323-332.
Fujimoto, T.; Y. Kurata; K. Matsumoto; S. Tsuchikawa. 2008. Application of near infrared spectroscopy for estimating wood mechanical properties of small clear and full length lumber specimens. Journal of Near Infrared Spectroscopy 16(6): 529-537.
Harrand, L.; J. J. Vargas-Hernández; J. López Upton; G. Ramirez Valverde. 2009. Genetic parameters of growth traits and wood density in Eucalyptus grandis progenies planted in Argentina. Silvae genetica 58(1-2): 11-19.
Hein, P.R.G.; L. Brancheriau; P. F. Trugilho; J. T. Lima; G. Chaix. 2010. Resonance and near infrared spectroscopy for evaluating dynamic wood properties. Journal of Near Infrared Spectroscopy 18(6): 443-454.
Hein, P. R. G.; J. T. Lima; G. Chaix. 2009a. Robustness of models based on near infrared spectra to predict the basic density in Eucalyptus urophylla wood. Journal of Near Infrared Spectroscopy 17(3): 141-150.
Hein, P. R. G.; A. C. M. Campos; E. F, Trugilho; J. T. Lima; G. Chaix. 2009b. Near infrared spectroscopy for estimating wood basic density in Eucalyptus urophylla and Eucalyptus grandis. Cerne 15(2): 133-141.
Holmberg, H. 2000. Influence of grain angle on Brinell hardness of Scots pine (Pinus sylvestris L.). Holz als Roh- und Werkstoff 58(1-2): 91-95.
Inagaki, T.; M. Schwanninger; R. Kato; Y. Kurata; W. Thanapase; P. Puthson; S. Tsuchikawa. 2012. Eucalyptus camaldulensis density and fiber length estimated by near-infrared spectroscopy. Wood Science and Technology 46(1-3): 143-155.
IRAM 9544. 1985. Método para la determinación de la densidad aparente. Instituto Argentino de Racionalización de Materiales.
Kothiyal, V.; A. Raturi. 2011. Estimating mechanical properties and specific gravity for five-year-old Eucalyptus tereticornis having broad moisture content range by NIR spectroscopy. Holzforschung 65(5): 757-762.
López, J. A. 2005. Mejoramiento genético de la calidad de la madera. Primera jornada sobre potencial foresto-industrial del eucalipto en Santiago del Estero. Facultad de Ciencias Forestales, Universidad Nacional de Santiago del Estero, Argentina. [en linea] [fecha de consulta: 24 de septiembre 2018]. p1-6. Disponible en: http://fcf.unse.edu.ar/eventos/1-jornadas-forestales/pdfs/Calidad%20de%20la%20madera%20para%20Santiago.pdf
Schimleck, L. R.; R. Evans; J. Ilic. 2001. Estimation of Eucalyptus delegatensis wood properties by near infrared spectroscopy. Canadian Journal of Forest Research 31(10): 1671-1675.
Schimleck, L. R.; A. J. Michell; C. A. Raymond; A. Muneri. 1999. Estimation of basic density of Eucalyptus globulus using near-infrared spectroscopy. Canadian Journal of Forest Research 29(2): 194-201.
SAGyP, Secretaría de Agricultura, Ganadería y Pesca. 2018. Inventario nacional de plantaciones forestales por superficie.[en linea] [fecha de consulta: 24 de septiembre de 2018]. Disponible en: http://datos.gob.ar/dataset/agroindustria-inventario-nacional-plantaciones-forestales-por-superficie
Sánchez Acosta, M. 1995. Experiencia argentina en el uso de la madera de eucalipto. Seminário Internacional de Utilização da Madeira de Eucalipto para Serraria. Instituto de Pesquisas e Estudos Florestais, São Paulo, Brasil. [en linea] [fecha de consulta: septiembre 2018]. p 74-91. Disponible en: http://www.ipef.br/publicacoes/seminario_serraria/cap09.pdf
Wentzel-Vietheer M.; R. Washusen; G. M. Downes; C. Harwood; N. Ebdon; B. Ozarska; T. Baker. 2013. Prediction of non-recoverable collapse in Eucalyptus globulus from near infrared scanning of radial wood samples. European Journal of Wood and Wood Products 71(6): 755-768.
Zhang, S. Y.; E. K. Morgenstern. 1995. Genetic variation and inheritance of wood density in black spruce (Picea mariana) and its relationship with growth: implications for tree breeding. Wood Science and Technology 30(1): 63-75.
Zobel, B. J.; J. B. Jett. 2012. Genetics of wood production. Berlin, Germany. Springer- Verlag. 337 p.
Notas de autor
hernandez.mariano@inta.gob.ar