ARTÍCULO
Applying colorimetry for wood differentiation of fabaceae species grown in southern Brazil
 Helena Cristina Vieira lenacristin@gmail.com
Joielan Xipaia dos Santos
Deivison Venicio Souza
Polliana D’ Angelo Rios
Graciela Inés Bolzon de Muñiz
Simone Ribeiro Morrone
Silvana Nisgoski
Helena Cristina Vieira lenacristin@gmail.com
Joielan Xipaia dos Santos
Deivison Venicio Souza
Polliana D’ Angelo Rios
Graciela Inés Bolzon de Muñiz
Simone Ribeiro Morrone
Silvana Nisgoski
Applying colorimetry for wood differentiation of fabaceae species grown in southern Brazil
Maderas. Ciencia y tecnología, vol. 24, 16, 2022
Universidad del Bío-Bío
Received: 11 December 2019
Accepted: 20 December 2021
Abstract: Because of the need for identification of forest species, especially for detection of illegal wood trade, the objective of this study was to evaluate the potential of colorimetry for differentiation of Inga vera Willd., Muellera campestris (Mart. ex Benth.) M.J. Silva & A.M.G. Azevedo and Machaerium paraguariense Hassl., species of the Fabaceae family, native to the Araucaria Forest in the state of Santa Catarina, southern Brazil. Discs at breast height were collected from three trees of each species and the colorimetric parameters (L*, a*, b*, C* and h) and visible spectra were evaluated in different radial position of the trunk (near bark, intermediate and near pith) and three different anatomical sections (transversal, radial and tangential surfaces). Mean values of hue angle (h) among the colorimetric parameters resulted in the highest potential for species discrimination. With respect to radial trunk position and anatomical section, parameters a* (green-red) and h were not statistically different, independent of the wood samples evaluated. For other parameters (L*, b* and C*), each species presented distinct results. Principal component analysis with second derivative of visible spectra discriminated all species. Colorimetry associated with chemometrics allowed to distinguish I. vera, M. campestris and M. paraguariense.
Keywords: Araucaria forest, colorimetric parameters, species differentiation, trade control, wood color.
Introduction
The high biodiversity of native species in Brazil and different aspects of each biome in the country have been confirmed by various researchers. Andrade et al. (2018) commented that Atlantic Forest remnants stand out for having a high number of distinct taxonomic groups (15,179), hampering species discrimination and consequently control of wood commerce.
Among the diverse forest typologies in the Atlantic Forest biome, the Araucaria Forest stands out in Santa Catarina state, southern Brazil, in function of the presence of 925 angiosperm species. The families with the highest number of classes are Asteraceae (119 species), Myrtaceae (88 species) and Fabaceae (58 species) (Gasper et al. 2013). Also, in some forest fragments, the Fabaceae family has more richness (Martins et al. 2017). Another relevant factor is that some native trees of this family have potential for commercial logging, such as Inga vera Willd., Muellera campestris (Mart. ex Benth.) M.J. Silva & A.M.G. Azevedo and Machaerium paraguariense Hassl.
However, many times the trade of these wood species is illegal. Based on the list of Brazilian Environmental Ministry (MMA 2014), the genus Machaerium contains one species classified as vulnerable, and for genus Inga, two are classified as critically endangered, one as endangered, and nine are in vulnerable category. Nevertheless, these species are often targeted by loggers, an activity that is difficult to deter by inspections because of missing data on reproductive and vegetative material. In general, control is performed using anatomical and structural characteristics of wood, and often the time necessary for analysis and correct identification is too long. Therefore, alternative methods of wood differentiation are necessary, and one technique can be wood color. But visual classification alone is highly subjective and can be influenced by diverse factors, such as differences in luminosity (Silva et al. 2015), facilities available for observing anatomical structure, authentic database, practical experience and training of the technical staff involved, etc.
Thus, the use of colorimeters or spectrophotometers can be an alternative, since the evaluation is fast and needs little training. Some studies have shown the potential of this technique to evaluate wood modifications after thermal treatment (Cademartori et al. 2013), to characterize Eucalyptus wood (Mori et al. 2005), and to distinguish Eucalyptus and Pinus species (Nisgoski et al. 2017, Amorim et al. 2013) and Myrtaceae species (Vieira et al. 2019b), among others. However, for adequate species discrimination, it is necessary to have a database that includes all heterogeneous characteristics of wood, since color is influenced by various factors, like radial position in the trunk and anatomical section evaluated.
Considering the need to develop alternative techniques for species discrimination, this study evaluates the potential of colorimetry to differentiate three Fabaceae species from southern Brazil: Inga vera, Machaerium paraguariense and Muellera campestris.
Material and methods
Material
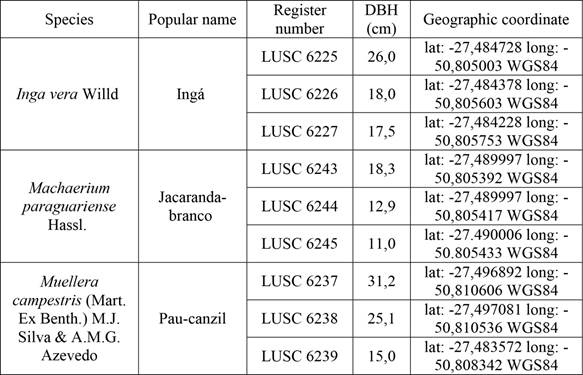
The trees of the three species were cut in an area of the Araucaria Forest in Santa Catarina state, southern Brazil, set to be inundated after completion of the São Roque hydroelectric dam. Three trees of each species were analyzed (Table 1). Botanical material was registered with the Lages Herbarium of the Santa Catarina State University (LUSC) and access to the material is registered with Brazilian Council for Management of Genetic Heritage (CGEN/SISGEN) under number AF3EDDC.
From each tree, two discs were cut at diameter at breast height (DBH) with 50 mm thickness. Botanical material and one disc of each tree were used for species identification, registration and storage at the LUSC herbarium. So, a total of nine discs were evaluated in this study, three per species (Figure 1).
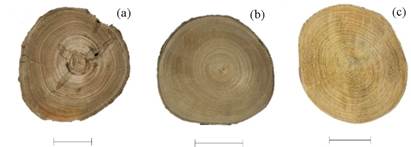
Figure 1:
Example of discs used in this study: (a) Inga vera, (b) Machaerium paraguariense and (c) Muellera campestris. Scale bar = 50 mm.
To include most wood variation, sampling was done in three regions: near bark, intermediate and near pith. Sample size was 20 x 20 x 20 mm3 (length, width and thickness). In order and to eliminate the oxidation effects and saw marks on the wood surfaces, the samples were polished with 100 grit sandpaper. Pastore et al. (2004) commented that wood color is influenced by climatic characteristics, so to standardize all analyses, samples were stored, until start the analysis to maintain moisture equilibrium, in a controlled atmosphere with temperature of 25 ºC ± 2 ºC and relative humidity of 50 % ± 2 %.
Colorimetric parameters and vis spectra
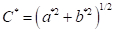
Colorimetric characterization of wood was based on the CIEL*a*b* standard, with observation angle of 10° and illuminant D65. Analysis was performed with a Konica Minolta CM-5 spectrophotometer. In each sample, two readings were carried out per anatomical section, for a total of 6 per sample and 54 per species. Data from L*= luminosity, a*= chromatic coordinate of green-red axis, and b*= chromatic coordinate of blue-yellow axis were obtained for calculation of the parameters C* = chroma or saturation (Equation 1) and h= hue angle (Equation 2). Reflectance spectra from 350 nm to 750 nm were also obtained.
 (1)
(1)
 (2)
(2)Statistical analysis
The data were compared within each species by the Scott-Knott test in case of normal distribution and the Kruskal-Wallis test for nonparametric distribution. Factorial analysis was performed with the SISVAR software (Ferreira 2011) considering the factors anatomical section (transversal, radial and tangential) and radial position in trunk (near bark, intermediate and near pith).
Principal component analysis (PCA) was applied to verify the behavior of species regarding colorimetric parameters, with raw data and second derivative of Savitzky-Golay, with smoothing = 3, using the R Statistical software (R Core Team 2018).
Results and discussion
Colorimetric parameters of each species
Mean results for each species for the parameters L*, a*, b*, C* and h are listed in Table 2. Data on luminosity (L*), in accordance with Nishino et al. (1998), indicated that all studied species are classified as having high value (L*>54). In mean comparisons, Machaerium paraguariense presented lower luminosity (darker appearance), significantly different than the other two species (Figure 1a). The luminosity results of the three Fabaceae species are similar to Myrtaceae species from Araucaria Forest (Vieira et al. 2019b), which presented values from 50,01 to 69,75 for this parameter. Silva et al. (2015) reported values higher than 70 for Apuleia leiocarpa, another species from the Fabaceae family.
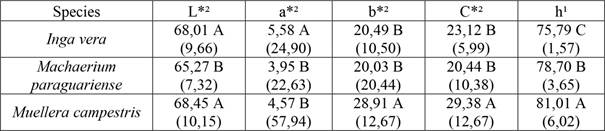
For each parameter, means with the same capital letter in the column are not statistically different by the Scott-Knott (1) or Kruskal-Wallis (2) test at 95 % significance. Coefficient of variation in parentheses.
When the analysis was performed on the chromatic coordinate of the green-red axis (a*), Inga vera had higher value and was considered to have the reddest pigmentation among three species (Barros et al. 2014). For the blue-yellow chromatic coordinate (b*) and chroma (C), Inga vera and Machaerium paraguariense were similar, and the highest parameter values were found for Muellera campestris, which had the lowest value of white, as also reported by Silva et al. (2017).
For hue angle (h), the lowest value was in Inga vera wood and highest in Muellera campestris.Camargos and Gonçalez (2001) described that even though derived from a* and b* values, hue angle can provide information about material tonality. This parameter showed the best potential to distinguish all evaluated species. Vieira et al. (2019b) reported the same tendency of h and b* parameters in Myrtaceae species.
Based on the color chart proposed by Camargos and Gonçalez (2001), the species where classified as having similarity with these colors: olive yellow (I. vera), gray rose (M. paraguariense) and light yellow (M. campestris).
Colorimetric parameters in function of anatomical section and radial position
Mean values of luminosity for Fabaceae species are shown in Figure 2. For the anatomical section factor, in general lower values were present in transversal sections, with the exception of Inga vera samples in the near bark region, which were similar in all anatomical sections.
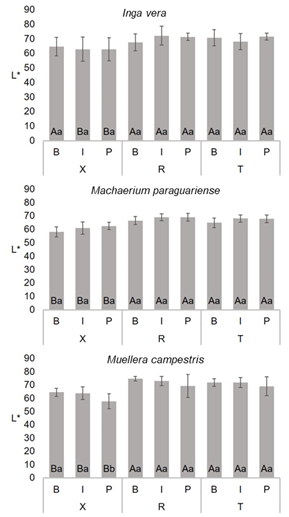
Figure 2:
Mean values of luminosity (L*) of Fabaceae species. For each species, same capital letters in the same trunk position between different sections and same small letters in the same section and between trunk position do not differ significatively by the Scott-Knott test at 95 % significance. B = bark, I = intermediate, P = pith, X = transversal, R = radial and T = tangential sections.
Atayde et al. (2011) while evaluating differences between anatomical sections of Brosimum spp. wood, described statistically significant and different results for mean luminosity of samples in transversal, tangential and radial sections. Based on trunk position, in general, present results are similar, except for Muellera campestris in the transversal section, where mean values in the region near the pith are lower than in the other samples.
When studying forest species, statistically similar results are not common when evaluating radial variations in luminosity. For example, Moya et al. (2012) analyzed colorimetric parameters in Acacia mangium and Vochysia guatemalensis wood and described values with statistical differences in samples from heartwood (region near pith) and sapwood (region near bark). Vieira et al. (2019b) evaluated Myrtaceae species and reported a decreasing tendency of L* values from bark to pith. Considering the Fabaceae family, Cisneros et al. (2019) described colorimetry of Prosopis alba and reported different values in function of trunk position, with the highest values found in sapwood.
For chromatic coordinate a* (Figure 3a, Figure 3c, Figure 3e), the results were similar for all species in all anatomical sections and trunk positions. This tendency is not standard for all wood species. Other researchers have observed variations in anatomical sections, such as lower values in transversal sections (Atayde et al. 2011), and different for values of radial variations between heartwood and sapwood (Moya et al. 2012). Another important consideration is the high standard deviation of mean values of each sample. This behavior can be explained by the species’ anatomic structures, due to differences in the coloration of the fibers and axial parenchyma (predominantly aliform in Inga vera, and with bands in Muellera campestris and Machaerium paraguariense (Vieira et al. 2019a). These aspects cause high contrast with the fibers. However, according to Paula et al. (2016), the absence of variation of the colorimetric parameters in the different planes can be considered an advantage for wood commerce, since it means greater homogeneity of the final product.
For chromatic coordinate b* (Figure 3b, Figure 3d, Figure 3f), the values were similar in all three species. In the different sections and trunk positions, Inga vera showed higher statistical similarity, except for mean values in transversal sections near bark, and for samples near pith in radial sections. Similar b* values for heartwood and sapwood were also found by Moya et al. (2012) in Acacia mangium and Vochysia guatemalensis. For Machaerium paraguariense, considering changes in anatomical section, smaller values were obtained in transversal sections, while for radial sections, a tendency of higher values was observed in the near-pith region. In Muellera campestris, when analyzing anatomical surfaces, there also was a tendency for lower values in transversal sections, while in tangential sections there was no difference between positions, but for radial and transversal sections, the near-pith position had the highest values.
For parameter C* (Figure 4a, Figure 4c, Figure 4e), Inga vera results were similar between samples, except for near-bark material in transversal and tangential sections, whose values were lower than in the radial section. In Machaerium paraguariense, all analyses revealed significant differences. Regarding anatomical section, lower values occurred on transversal surfaces, independent of trunk position. When considered trunk position, in radial and transversal sections, lower values were obtained in samples near the bark, while for tangential sections, higher chroma was verified near the pith. According to Ross et al. (2010), this behavior can be attributed to the presence of various extractives in the heartwood, or also by physiological growth characteristics and tree health. In Muellera campestris samples, based on anatomical section, lower chroma was found in transversal sections. Based on trunk position, no difference was observed for tangential sections, while for transversal and radial sections, higher values were obtained in the near-pith region. These results can be attributed to the presence of extractives in function of heartwood formation.
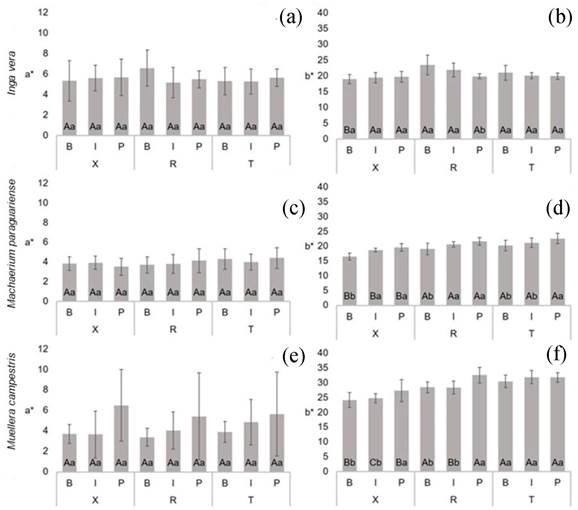
Figure 3:
Mean values of chromatic coordinates a* (a, c, e) and b* (b, d, f) of Fabaceae species. For each species, the same capital letters in the same trunk position between different sections and same small letters in the same section and between trunk positions do not differ significantly by the Scott-Knott test at 95 % significance. B = bark, I = intermediate, P = pith, X = transversal, R = radial and T = tangential sections.
For hue angle (h) (Figure 4b, Figure 4d, Figure 4f), no significant differences were observed in function of anatomical surface or radial position in the trunk. This was also described by Vieira et al. (2019b) for Eugenia pyriformis. This result is important because it can be a practical advantage for species discrimination, since these parameters can be used to identify all evaluated species. Studying wood from Brosimum rubescens and Hevea brasiliensis, Autran and Gonçalez (2006) described similar data for hue angle in radial and tangential sections. Describing the wood of eight native species from the state of Rio Grande do Sul (also in southern Brazil), Silva et al. (2015) found similarity for the hue angle between the tangential and radial sections of the samples evaluated.
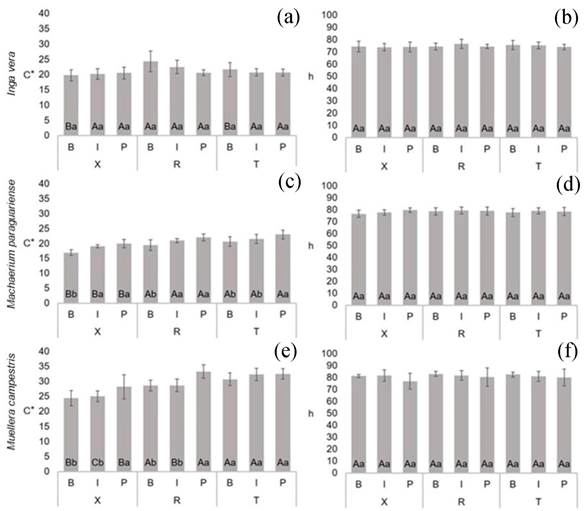
Figure 4:
Mean values of parameters C*(a, c, e) and h (b, d, f) of Fabaceae species. For each species, the same capital letters in the same trunk position between different sections and the same small letters in the same section and between trunk positions do not differ significatively by the Scott-Knott test at 95 % significance. B = bark, I = intermediate, P = pith, X = transversal, R = radial and T = tangential sections.
Visible spectra
Mean spectra per species (Figure 5) indicated similar tendency in reflectance of wood, a difference in wavelength in the region from 390 nm to 500 nm (violet and blue color) and some grouping of Inga vera and Muellera campestris in bands from 500 nm to 750 nm.
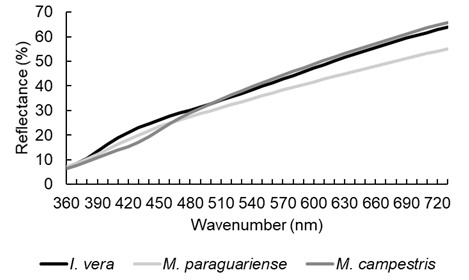
Figure 5:
Visible reflectance spectra of Fabaceae species.
Principal component analysis (PCA)
Visual analysis of reflectance spectra alone cannot indicate whether species are different, so principal component analysis, which can group similar material, was performed (Figure 6). Two principal components represent 96,4 % of variation in raw reflectance spectra of species samples, the first component represented 80,4 % and second component 16,0 % of the variation. Among the species (Figure 6a), original spectra of Muellera campestris was separated from the others, and this distinction was confirmed by the ellipse grouping, which was the result of light-yellow color of wood. In some eucalypt species, Nisgoski et al. (2017) also found a distinction of samples in PCA of reflectance spectra in function of wood color.
Based on trunk position (Figure 6b), there was no distinction of species, with overlap of ellipse distribution. In analysis of anatomical sections (Figure 6c), a tendency of separation of transversal surfaces was present, along with some miscellaneous groups of radial and tangential sections. This can be explained by morphological characteristics of wood species, because individual cell arrangement and dimensions influence the formation of groups.
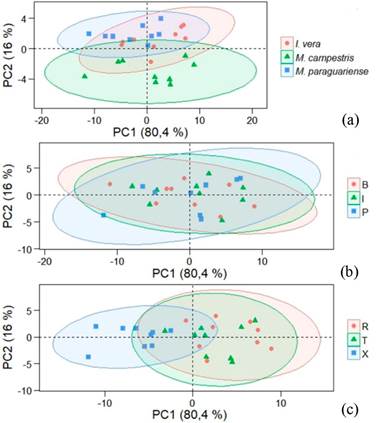
Figure 6:
Score graph of PCA with mean raw spectra of Fabaceae species. (a) basedon species, (b) in function of radial position in trunk and (c) for anatomical sections.
The PCA factor loading graphs with original data (Figure 7) indicated more influence on PC1 linearity after 480 nm (cyan, green, yellow, orange and red color) and for PC2 an opposite tendency, with more influence of wavelengths from 360 nm to 470 nm (violet and blue).
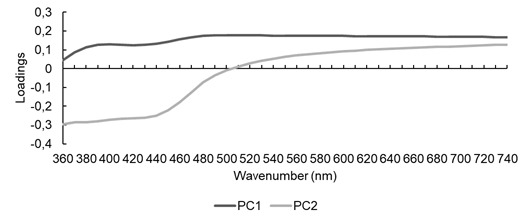
Figure 7:
PCA factor loading graph with original visible spectra of Fabaceae species.
To minimize noise in spectra, mean spectral data points were transformed by taking the second derivative and PCA was performed again (Figure 8). The results indicated that PC1 represented 45,1 % and PC2 17,5 % of the variations of the samples. When considering species (Figure 8a) better discrimination occurred in comparison with raw data, and Machaerium paraguariense results were more similar between trees. In Myrtaceae species, Vieira et al. (2019b) also described better results with second derivative spectra.
When the analysis was done based on trunk position (Figure 8b) and anatomical sections (Figure 8c), the same results as found for the original data were verified. Related to position in trunk, near-bark and intermediate regions showed similarity of ellipses formed. The same was found for tangential and radial sections, while for transversal sections, the ellipses were different.
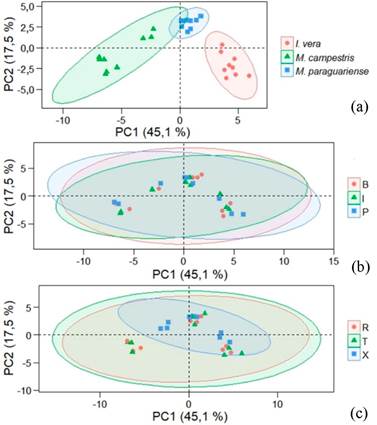
Figure 8:
PCA score graph with mean second-derivative spectra of Fabaceae species. (a) based on species, (b) in function of radial position in trunk and (c) for anatomical section.
The PCA factor loading graphs with second derivative data (Figure 9) indicated an influence of wavelength in all spectral bands, i.e., it was not possible to determine with precision which region or color contributed to better discrimination of species.
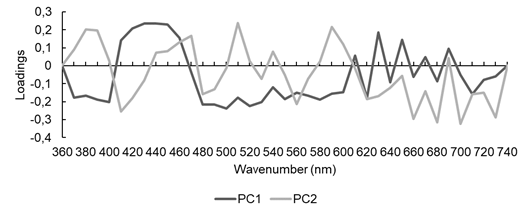
Figure 9:
PCA loading graph with second-derivative visible spectra of Fabaceae species.
Conclusions
With mean data from colorimetric parameters of three species, hue angle was the color characteristic that best discriminated numerically the Fabaceae species evaluated.
The parameters L*, b* and C* were influenced by trunk position and anatomical section. Each species presented a specific tendency for each color parameter. Data from a* and h were not statistically different independent of species, trunk position or anatomical section analyzed.
In graphical analysis, similarity of species was verified. Principal component analysis with second-derivative spectra showed adequate discrimination of the three Fabaceae species.
Colorimetric parameters and visible spectra can contribute to a database for species discrimination in timber trade.
Acknowledgements
The authors thank the Santa Catarina State University (UDESC) for the study material, the Federal University of Paraná (UFPR) for the physical structure and Coordination for the Improvement of Higher Education Personnel (CAPES - Finance Code 001) for financial support.
References:
Amorim, P.G.R.; Gonçalez, J.C.; Camargos, J.A.A. 2013. Propriedades da madeira de Pinus caribaea e Eucalyptus grandis estimadas por colorimetria. Cerne 19(3): 461-466. https://www.redalyc.org/articulo.oa?id=74428921013
Andrade, L.E.; Forzza, R.C.; Walter, G.Z.; Filardi, F.L.R. 2018. Brazilian Flora 2020: innovation and collaboration to meet Target 1 of the Global Strategy for Plant Conservation (GSPC). Rodriguésia 69(4): 1513-1527. http://www.repositorio.ufop.br/handle/123456789/11055
Atayde, C.M.; Gonçalez, J.C.; Camargos, J.A.A. 2011. Características colorimétricas entre as seções anatômicas da madeira de muirapiranga (Brosimum sp.). Cerne 17(2): 231-235. https://www.redalyc.org/pdf/744/74418601011.pdf
Autran, C.S.; Gonçalez, J.C. 2006. Caracterização colorimétrica das madeiras de muirapiranga (Brosimum rubescens Taub.) e de seringueira (Hevea brasiliensis, clone TJIR 16 Müll Arg.) visando à utilização em interiores. Cienc Florest 16(4): 445-451. https://repositorio.unb.br/bitstream/10482/10500/1/ARTIGO_CaracterizacaoColorimetricaMadeiras.pdf
Barros, S.V. dos S.; de Muñiz, G.I.B.; de Matos, J.L.M. 2014. Caracterização colorimétrica das madeiras de três espécies florestais da Amazônia. Cerne 20(3): 337-342. https://www.redalyc.org/pdf/744/74432265001.pdf
Cademartori, P.H.G.; Schneid, E.; Gatto, D.A.; Stangerlin, D.M.; Beltrame, R. 2013. Thermal modification of Eucalyptus grandis wood: variation of colorimetric parameters. Maderas-Cienc Tecnol 15(1): 57-64. http://dx.doi.org/10.4067/S0718-221X2013005000005
Camargos, J.A.A.; Gonçalez, J.C.A. 2001. A colorimetria aplicada como instrumento na elaboração de uma tabela de cores de madeira. Brasil Florestal 71: 30-41. https://repositorio.unb.br/handle/10482/10497
Cisneros, A.B.; Nisgoski, S.; Moglia, J.G.; Córdoba, M. 2019. Colorimetría en la madera de Prosopis alba. Maderas-Cienc Tecnol 23(1): 393-404. http://dx.doi.org/10.4067/S0718-221X2019005000311
Ferreira, D.F. 2011. Sisvar: a computer statistical analysis system. Ciênc Agrotec 35(6): 1039-1042. http://dx.doi.org/10.1590/S1413-70542011000600001
Gasper, A.L.; Sevegnani, L.; Vibrans, A.C.; Sobral, M.M.; Uhlmann, A.; Lingner, D.V.; Rigon Júnior, M.J.; Verdi, M.; Stival-Santos, A.; Dreveck, S.; Korte, A. 2013. Inventário florístico florestal de Santa Catarina: espécies da Floresta Ombrófila Mista. Rodriguésia 64(2): 201-210. http://rodriguesia-seer.jbrj.gov.br/index.php/rodriguesia/article/view/ID%20575/pdf_44
Martins, P.J.; Mazon, J.A.; Martinkoski, L.; Benini, C.C.; Watzlawick, L.F. 2017. Dinâmica da Vegetação Arbórea em Floresta Ombrófila Mista Montana Antropizada. Floresta Ambiente 24: e00097014. http://dx.doi.org/10.1590/2179-8087.097014
Ministério do Meio Ambiente. MMA. 2014. Lista nacional oficial de espécies da flora ameaçadas de extinção. Portaria MMA 443, 17 de dezembro de 2014. https://ckan.jbrj.gov.br/dataset/23f2e24c-5676-4acd-83f0-03621cba4364/resource/8d0bbe11-e7d4-49c3-98ba-c07f2dfacf5e/download/portariamma4432014listaespeciesfloraameacadasextincaobrasil.pdf
Mori, C.L.S. de O.; Lima, J.T.; Mori, F.A.; Trugilho, P.F.; Goncalez, J.C. 2005. Caracterização da cor da madeira de clones de híbridos de Eucalyptus spp. Cerne 11(2): 137-146. https://www.redalyc.org/pdf/744/74411204.pdf
Moya, R.; Fallas, R.S.; Bonilla, P.J.; Tenorio, C. 2012. Relationship between wood color parameters measured by the CIELab system and extractive and phenol content in Acacia mangium and Vochysia guatemalensis from fast-growth plantations. Molecules 17(4): 3639-3652. https://doi.org/10.3390/molecules17043639
Nisgoski, S.; De Muniz, G.I.B.; Gonçalves, T.A.P.; Ballarin, A.W. 2017. Use of visible and near-infrared spectroscopy for discrimination of eucalypt species by examination of solid samples. Trop For Sci 29(3): 371-379. https://www.jstor.org/stable/44272915
Nishino, Y.; Janin, G.; Chanson, B.; Détienne, P.; Gril, J.; Thibaut, B. 1998. Colorimetry of wood specimens from French Guiana. J Wood Sci 44(1): 3-8. https://doi.org/10.1007/BF00521867
Pastore, T.C.M.; Santos, K.O.; Rubim, J.C.A. 2004. Spectro colorimetric study on the effect of ultraviolet irradiation of four tropical hardwoods. Bioresource technol 93(1): 37-42. https://doi.org/10.1016/j.biortech.2003.10.035
Paula, de M.H.; De Mesquita, R.R.S.; Gonçalez, J.C.; Ribeiro, E.S.; Souza, R.S. 2016. Utilização de métodos não destrutivos para caracterização simplificada da madeira de cumaru (Dipteryx odorata Willd). Biodiversidade 15(2): 136-149. http://www.periodicoscientificos.ufmt.br/ojs/index.php/biodiversidade/article/view/3967/2761
R Core Team. 2018. R: A language and environment for statistical computing. R Foundation for Statistical Computing: Vienna, Austria. https://www.R-project.org/
Ross, R.J. 2010. Wood handbook: wood as an engineering material. General Technical Report FPL-GTR-190, USDA Forest Service, Forest Products Laboratory: Madison. https://www.fpl.fs.fed.us/documnts/fplgtr/fpl_gtr190.pdf
Silva, E.S.; Stangerlin, D.M.; Gatto, D.A.; Calegari, L.; Pariz, E. 2015. Colorimetria da madeira de oito espécies nativas do estado do Rio Grande do Sul, Brasil. Braz J Wood Sci 6(1): 31-37. http://dx.doi.org/10.15210/cmad.v6i1.4292
Silva, R.A.F.; Setter, C.; Mazette, S.S.; De Melo, R.R.; Stangerlin, D.M. 2017. Colorimetria da madeira de trinta espécies tropicais. Braz J Wood Sci 8(1): 36-41. http://dx.doi.org/10.12953/2177-6830/rcm.v8n1p36-41
Vieira, H.C.; Rios, P.D.A.; Santos, T.M.G.Q.M.; Cunha, A.B.D.; Brand, M.A.; Danielli, D.; Florez, J.B.; Stange, R.; Buss, Rodrigo.; Higuchi, Pedro. 2019a. Agrupamento e caracterização anatômica da madeira de espécies nativas da Floresta Ombrófila Mista. Rodriguésia 70: e04382017. http://dx.doi.org/10.1590/2175-7860201970038
Vieira, H.C.; Da Silva, E.L.; Dos Santos, J.X.; De Muñiz, G.I.B.; Morrone, S.R.; Nisgoski, S. 2019b. Wood colorimetry of native species of Myrtaceae from a Araucaria Forest. Floresta 49(2): 353-362. http://dx.doi.org/10.5380/rf.v49i2.58236
Author notes
♠Corresponding author: lenacristin@gmail.com