ARTÍCULO
Preliminary evaluation of the incorporation of cellulose nanofibers as reinforcement in waterborne wood coatings
 Tawani Lorena Naide tawnaide@gmail.com
Pedro Henrique Gonzalez de Cademartori
Silvana Nisgoski
Graciela Inés Bolzon de Muñiz
Tawani Lorena Naide tawnaide@gmail.com
Pedro Henrique Gonzalez de Cademartori
Silvana Nisgoski
Graciela Inés Bolzon de Muñiz
Preliminary evaluation of the incorporation of cellulose nanofibers as reinforcement in waterborne wood coatings
Maderas. Ciencia y tecnología, vol. 24, 53, 2022
Universidad del Bío-Bío
Received: 11 May 2021
Accepted: 22 August 2022
Abstract: The wood is exposed to possible damages caused by weather, requiring the application of a finishing coat to provide extra protection. The aim of this work was to evaluate the influence of the addition of microfibrillated cellulose in waterborne varnish on the colorimetric parameters, wettability and finish characteristics of wood products. Color was evaluated with a CM-5 spectrophotometer; surface wettability was analyzed by contact angle measurement using a drop shape analysis goniometer; and abrasion, adhesion and impact tests were performed to evaluate the quality of the coating. The coating’s optical characteristics were not affected by the addition of microfibrillated cellulose. The changes in wood wettability were small, with no statistical difference between the wood treated with plain varnish and that with unbleached microfibrillated cellulose. In the analysis of the variation of the contact angle during the elapsed time, the coating containing unbleached microfibrillated cellulose presented the best results. The results of finish quality did not show numerical changes after the addition of the microfibrillated cellulose, but qualitatively the microfibrillated cellulose caused better anchoring of the coating to the specimens. Therefore, the use of microfibrillated cellulose as reinforcement in coatings has potential, but tests with different consistencies and tests of other properties are necessary.
Keywords: Colorimetry, microfibrillated cellulose, waterborne coating, wettability, wood finish.
Introduction
Wood is a porous and hygroscopic material, so its appearance and structural integrity can vary according to moisture content due to absorption and desorption of water, resulting in reduced durability and/or increased development of fungi, among other characteristics (Gezici-Koç et al. 2018, Kluge et al. 2017). That is why it is necessary to use coating materials, such as varnish, to extend the service life of wood as well as to enhance decorative aspects.
According to the use of the wood, it could be defined whether it will be necessary to apply a preservative product or whether a surface coating is sufficient. If the wood is intended for more rigorous applications in an aggressive environment, it is necessary to use preservative products that must be efficient against the intended disadvantages and must be discarded at the end of their useful life without presenting any environmental risk (Yona et al. 2021). For purposes where the wood is not in a hostile environment, it is recommended to apply an appropriate coating, which when interacting and adhering to the wood substrate, will form a coating film that can extend the service life of the products, reducing the impact of degraders agents, providing changes in the visual aspect and preserving its original performance (Žigon 2021, Gibbons et al. 2020).
While in the past, processing, performance and price characteristics were the main determining factors for the development of coating materials, in recent decades, environmental and health aspects have been considered increasingly important (Veigel et al. 2014). More stringent regulations regarding the use of volatile organic compounds (VOCs) have caused solvent-based coatings to be progressively replaced by waterborne coatings (Duan et al. 2016, Tan et al. 2016). However, because the latter are more sensitive to water, depending on the intended use of the final product it is necessary to increase the coatings’ mechanical properties, which can be done by inclusion of fillers and other additives.
Due to their morphology, nanofibers have a very large surface-to-volume ratio, which allows them to interact strongly with the environment and improve the mechanical properties of polymeric matrices. Furthermore, their nanometric scale mostly preserves the transparency of the coating. In particular, cellulose nanofibers, i.e. microfibrillated cellulose (MFC) has a polar and reactive surface, in addition to having substantially lower hardness, strength and rigidity than inorganic nanoparticles, making it promising to replace inorganic fillers and additives (Kluge et al. 2017, Veigel et al. 2014).
The good potential of cellulose nanofibers is based on the possibility of its use as reinforcement in composite materials, but this depends on adequate dispersion in the matrix (Islam et al. 2013). Since cellulose is hydrophilic in terms of surface chemistry, it disperses well in aqueous media, generating a homogeneous mixture (Kluge et al. 2017). Nanocellulose combines important properties of cellulose, such as hydrophilicity, chemical modification capacity and formation of fibers with semicrystalline morphology.
The present study investigated the possibility of adding MFC, as filler in waterborne wood coatings, by evaluating the influence on colorimetric characteristics, wood wettability and on the properties of resistance to impact, adhesion and abrasion of the coating applied to the wood.
Materials and methods
Preparation and characterization of microfibrillated cellulose
Industrial kraft pulp from Pinus spp. (bleached and unbleached) was used. Moisture content was determined by gravimetry to calculate the percentage of pulp and water necessary to prepare nanocellulose with a consistency of 2 % by dry weight. Microfibrillated cellulose was obtained by mechanical processing in a defibrillator mill (Masuko Sangyo Supermasscolloider MKCA6-3) using 10 passes and a constant frequency of 157,08 rad/s (Potulski et al. 2016, Silva et al. 2019).
MFC morphology was evaluated by transmission electron microscopy (TEM) with a JEOL JEM 1200EX-II microscope, with resolution of 0,5 nm, magnification range of up to 600 kX and voltage of up to 120 kV, equipped with a Gatan high-resolution CCD camera (Orius SC1000B).
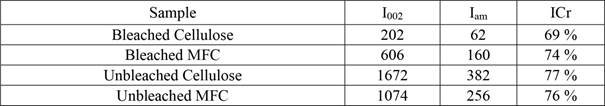
The crystallinity index of cellulose and MFC was determined with an X-ray diffractometer (Shimadzu XRD-7000) applying the method of Segal et al. (1959). This method involves applying Equation 1 to calculate the crystallinity index based on the ratio between the intensity of the crystalline peak and the intensity of amorphous regions.
 (1)
(1)Where: ICr = crystallinity index; Iam = diffraction intensity of amorphous portions; I002 = diffraction intensity of peak of crystalline portion of plane 002.
Wood samples
Samples of Enterolobium schomburgkii (Fabaceae) wood with dimensions of 145 mm x 80 mm x 20 mm were used in the tests. The samples were made available by a flooring industry, the material was already presented in the form of a floor, with stable moisture content (dry) and containing only heartwood. Despite being a durable wood, Enterolobium schomburkii was chosen, not only for the availability of samples, but also to value the species and encourage nobler uses, such as floors and furniture, in addition to the traditional uses in Brazil in civil construction.
Before the tests, the longitudinal surface of each specimen was polished with sandpaper with grades 80 and 120 to avoid the influence of saw marks on the results. A total of 27 samples were evaluated. Samples were conditioned in a climate-controlled room in order to reach the equilibrium moisture content (12 % ± 1 %).
Varnish
Transparent water-based marine varnish (Sayerlack - YO.1371.00) was used, with satin finish and 38,35 % ± 2 % solid content. Based on the manufacturer’s information, dilution must be done with 10 % to 15 % water. So, tests were performed with three different dilutions: i) varnish with only 10 % water; ii) varnish with further addition of 10 % bleached MFC; and iii) varnish with addition of 10 % unbleached MFC.
Since the nanocellulose suspensions had low fiber concentration, and water is the largest portion by volume, the same water density was applied in the calculation of MFC mass for addition in varnish. Each solution was applied by brushing on nine 9 specimens per treatment, totaling 27 samples.
After varnish solutions’ application, samples were dried in a kiln with forced air circulation for 4 hours and temperature of 25 ºC, as recommended by the varnish manufacturer. The samples were smoothed with 120-grit sandpaper and the varnish application and drying was repeated twice. For each application, moisture weight applied to each specimen was measured by weighing before and after brushing.
Colorimetry
Colorimetric characterization was performed with a Konica Minolta CM-5 spectrophotometer, operating in the range of 350 nm to 750 nm, with a xenon lamp, 8 mm sensor aperture diameter, observation of 10°, and illuminant D65 (CIELab standard). Spectra and colorimetric data were obtained for wood without treatments, at three different points per sample for each varnish solution applied, for a total of 162 spectra/specimen.
In each sample, data were obtained from the longitudinal section, which provided the values for L* (luminosity), a* (chromatic coordinates of the green-red axis), and b* (chromatic coordinates of the blue-yellow axis). The values for C* (saturation) and h (hue angle) were calculated according to Equation 2 and Equation 3, respectively.
 (2)
(2)
 (3)
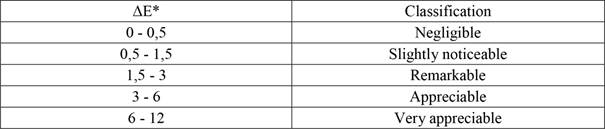
(3)Total color variation ΔE* was calculated based on Equation 4, to measure color changes after varnish application. This parameter can facilitate comparison because it represents three parameters in the CIE L*a*b* space (Ferreira and Spricigo 2017). Classification of ΔE* is based on Table 1.
 (4)
(4)Where: ΔE* = total color variation; ΔL*, Δa* and Δb* = variation of luminosity and chromatic coordinates (treated sample - untreated sample).
Wettability
Wettability of samples was investigated by the sessile drop contact angle method with a drop shape analysis goniometer (Krűss). Three droplets (5 µL) of distilled water were deposited on the longitudinal surfaces of each sample, through a syringe held perpendicularly to the surface. The contact angles were measured after 5, 15 and 30 seconds. All measurements were performed in the same experiment in an air-conditioned room at 20 ºC ± 2 ºC and 60 % ± 5 % relative humidity, to avoid external influences.
The work of adhesion (WoA) is defined by the work required to separate the liquid from the solid surface, and can be measured by surface tension of the liquid (γlv) and contact angle (θ), according to the Young-Dupré equation (Schrader 1995) (Equation 5).
 (5)
(5)Finishing tests
Abrasion test
The abrasion was tested according to the Brazilian standard ABNT NBR 14535 (2008), in a Taber abrasion tester with CS17 grinding wheel. Two samples with dimensions of 100 mm x 80 mm were used for each treatment. The wear rates were calculated based on difference in weight before and after surface abrasion (Equation 6 ).
 (6)
(6)Where: WR = wear rate (mg/1000 cycles); A = Weight of samples before abrasion (mg); B = Weight of samples after abrasion (mg); and C = number of cycles.
Coating adhesion
Coating adhesion was measured according to ASTM D4541 (2017), with a PosiTest AT-A pull-off adhesion tester. Three 20 mm diameter dollies were attached to each sample with a two-component epoxy resin with minimum curing time of 24 hours before the test. The coating/substrate adhesion tests were performed with the application of a constant rate of 0,2 MPa/s to obtain the maximum coating resistance until the metal piece affixed to the surface of the samples was peeled off.
Coating resistance to impact
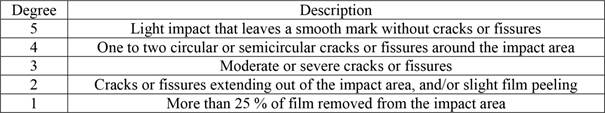
The impact resistance of the coating was measured in accordance with ABNT NBR 14535 (2008), adapted, which consists of assessing the damage caused by a steel ball with diameter of 19 mm (± 1 mm) weighing 28 g (± 1 g) in free fall from 2 m above the specimen to be tested. The assay was performed three times for each sample, totaling 27 tested areas. After the collision of the steel ball, the specimens were analyzed in a 10x magnifying glass, and the impact caused by the contact of the steel ball with the finished surface was quantified according to Table 2.
All tests were performed more than seven days apart after finish applications in a climate-controlled room with a temperature of 20 ºC ± 2 °C and 60 % ± 5 % relative humidity.
Statistical analysis
The data were submitted to analysis of variance and normality was determined. When appropriate, the means were compared by the Tukey test at 5 % probability of error, to verify if there were differences in the properties between the varnish with and without addition of nanocellulose. The Sisvar 5.6 software (Ferreira 2008) was used in all the statistical tests.
Results and discussion
Microfibrillated cellulose characterization
Micrographs of cellulose nanofibrils obtained after 10 passes through the defibrillator mill are shown in Figure 1. The average diameters of bleached and unbleached nanofibrils were 18,78 nm and 16,93 nm respectively, with no statistically significant difference. The average thickness was close to the values found by Potulski et al. (2016).
The mechanical defibrillation process caused the cell wall fibers to fibrillate, reducing their diameter and generating a structured network formed by nanofibrils. The diameter of nanofibrils generally varies from 3 nm to 100 nm, depending on the origin of the cellulose, and can have lengths greater than 1 µm (Dufresne 2013).
Figure 1:
TEM images of cellulose nanofibers. (A) Bleached, (B) Unbleached.
The crystalline peak and amorphous halo intensities of bleached (BCF) and unbleached (UCF) cellulose fibers and bleached (BMFC) and unbleached (UMFC) microfibrillated cellulose are illustrated in Figure 2, and the average values found for the crystallinity index (ICr) are reported in Table 3. The diffractogram contains a low intensity peak in the 2θ region of 15 º and a more intense peak in the 2θ region of 22 º, which represent the crystal planes for both cellulose fiber and MFC. These values agree with those reported by Silva et al. (2019).
By determining the crystallinity index, it is possible to analyze the degradation suffered by the fiber due to the mechanical defibrillation process. The crystallinity index of cellulose refers to the number of crystalline regions, where the fiber has greater tensile and elongation resistance, which directly influence the mechanical properties of the material (Potulski et al. 2016).
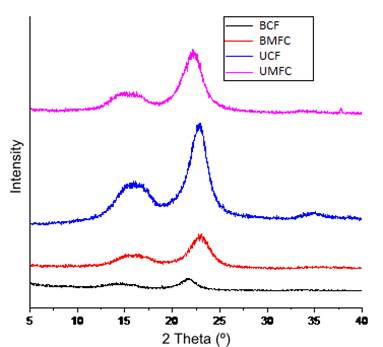
Figure 2:
X-ray diffractogram of cellulose fibers and MFC samples.
The bleached MFC had an increase in ICr after the mechanical defibrillation process, which resulted in greater exposure of the fibrils than in the cellulose fiber sample, increasing its ICr, but did not cause fiber degradation and tearing to the point of affecting the index. Lengowski et al. (2018) and Viana et al. (2019) found ICr values close to 80 % for unbleached pine cellulose fiber, near those found in work, which is consistent with other published studies.
One possible reason why the crystallinity index of the unbleached cellulose fiber and MFC is higher than that of the bleached cellulose is the delignification process. The bleaching process may have caused fiber degradation and consequently increased the reduction of the crystallinity index.
Colorimetry
Figure 3 shows the reflectance curve of the samples, revealing clear separation of the control wood curve from that of the finished samples. The colorimetric parameters of the samples without any type of coating (control) and with the coating are presented in Table 4.
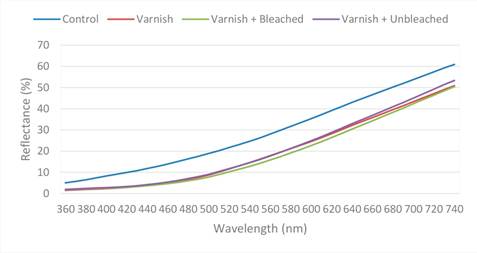
Figure 3:
Visible reflectance spectra of evaluated samples.
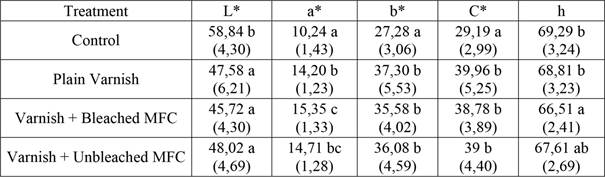
Where: L* = luminosity; a* = green-red chromatic coordinate; b* = blue-yellow chromatic coordinate; C* = chroma; h = hue angle. Same letter in the column indicates no statistical differences at 5 % probability by the Tukey test.
The average brightness values (L*) showed that the application of the coating caused a reduction in the wood brightness, but there was no significant difference due to the addition of MFC to the varnish. This is advantageous because the addition of bleached or unbleached MFC did not change this property. The brightness reduction can be explained by the basic characteristic of the chosen varnish. Since it is a satin (matte) varnish, it can cause a reduction of the natural brightness of wood.
The coordinate a* (red-green axis) is considered the main coordinate for wood color change between species (Garcia et al. 2014). This coordinate presented statistically different values for control wood, wood with varnish, and with varnish and bleached MFC, whereas the finishing with varnish and unbleached MFC differed from wood without finishing. There were no differences in the other treatments.
In general, the addition of the coating increased the value of a*, intensifying the red chromatic coordinate. Possibly some chemical present in the varnish absorbed a certain wavelength in the visible range, so the color observed, as reflected, was complementary, as described by Martins et al. (2015).
For parameter b*, all finish treatments differed from the control sample, but did not differ significantly from each other. There was also an increase in the b* coordinate, indicating intensification of the yellowish hue of the wood.
The total color variation (ΔE*) determined by equation 4 considers the differences between color coordinates and brightness (Table 5) and thus provides a broader view of color variation between the coating types (Figure 4).
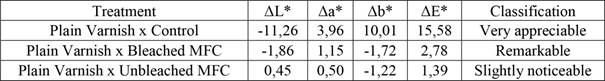
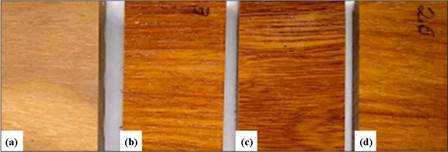
Figure 4:
Visual color variation: (a) Control wood; (b) Wood with plain varnish; (c) Wood with varnish containing bleached MFC; (d) Wood with varnish containing unbleached MFC.
Figure 4 clearly reveals the wood color variation caused by the application of the coating, reducing the brightness and increasing the color coordinates, intensifying the wood hue. According to Table 5, the color variation of the samples containing plain varnish compared to the control wood sample fits into the very appreciable classification, emphasizing the great influence that the varnish has on ΔE*, whereas the samples with bleached MFC compared to the samples of plain varnish have a variation considered notable, but subtler than the variation suffered by the sample when applying only the varnish. The same behavior occurred with samples containing unbleached MFC, however, they were classified as slightly perceptible in comparison with the plain varnish.
Although samples containing nanocellulose differed in the classification of the total color variation, Vardanyan et al. (2014) stated that when exposed to weathering, wood coated with varnish containing nanocellulose (1 wt% and 2 wt%) has better resistance to color deviation caused by the absorption of UV light by the pulp, since the coating layer with nanocellulose better protects the wood from weathering changes.
Wettability
The results of apparent contact angle (CA (°)) are presented in Table 6 and Figure 5. The contact angles from 5 to 30 seconds of the samples finished with plain varnish and with varnish containing unbleached MFC increased more than the specimen treated with varnish containing bleached MFC. This happened because the unbleached MFC contains lignin, which is a hydrophobic component. In the classification proposed by Ferreira (2013) at the time of 5 seconds, the finish containing unbleached MFC was considered to be hydrophobic (Ө> 90 °), but it was not significantly different than the plain varnish. Therefore, it can be said that at the time of 5 s, the unbleached MFC coating had hydrophobic character compared to the other treatments. For the other treatments and the other analyzed times, all coatings maintained hydrophilic character (Ө <90 °).
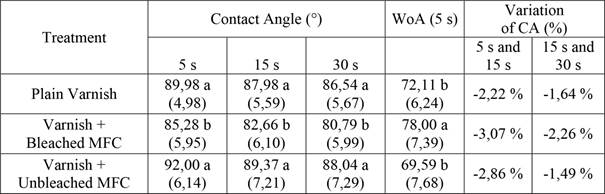
WoA = work of adhesion. Same letters in the row indicate no statistical difference at 5 % probability by the Tukey test.
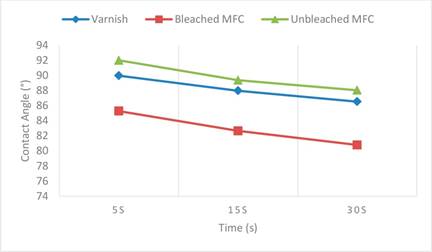
Figure 5:
Kinetics of the apparent contact angle for each treatment.
The work of adhesion (WoA) was measured after 5 seconds, which was the starting point for all CA-linked analyses (°). The WoA is the work necessary to separate the interface from the equilibrium state of two phases. The decrease in the CA (°) with time indicates absorption or spread of water, so there will be an increase in the WoA coefficient, since the water penetrated in the material will have a bond with the larger wood molecules and will require greater work for separation.
When analyzing the contact angle variation between the 5 s and 15 s, the samples finished with varnish without additives had the smallest contact angle reduction, while for the times of 15 s and 30 s, the specimens coated with varnish containing unbleached MFC had smaller variations.
Finishing test
The wear rate (WR), referring to the abrasion resistance, was measured with 500 and extrapolated to 1000 cycles per sample. The finish that had the highest wear rate, meaning the largest mass loss after 1000 cycles, was the varnish without additive (0,031 mg/1000 cycles), followed by treatment with varnish containing unbleached MFC (0,024 mg/1000 cycles), and that with bleached MFC (0,017 mg/1000 cycles). However, none of the treatments showed statistically significant differences at 5 %, i.e., the inclusion of MFC caused virtually no change in the average wear rate, according to the standard, this test has no minimum requirement.
In the study by Veigel et al. (2014), the addition of microfibrillated cellulose and cellulose nanocrystals in waterborne varnishes did not significantly improve the abrasion resistance. This is because during the abrasion test, the coating layer is almost completely removed, or can even be totally removed so as to expose the wood fibers over a comparatively large surface area. Thus, this test measures the internal cohesion of the coating layer and to some extent also the adhesion to the substrate.
The results of the adhesion test indicated no significant numerical difference between the plain varnish and the varnishes with the addition of the MFC solutions (Figure 6), but visually the specimens coated with varnish containing MFC underwent greater particle pull-out during the test (Figure 7). In other words, the finishes containing MFC had a greater penetration and anchorage than the plain varnish, but this was not perceived numerically by the equipment.
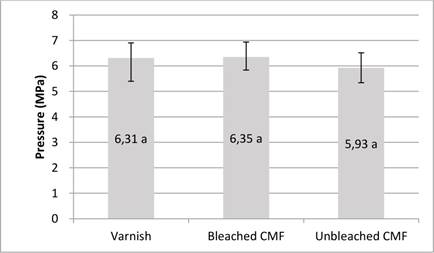
Figure 6:
Average values of adhesion test.
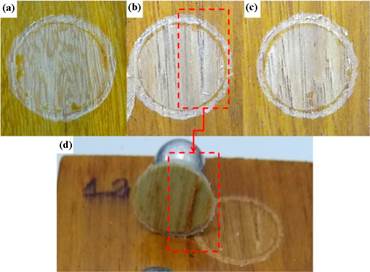
Figure 7:
Particle pull-out in adhesion test: (a) Plain varnish, (b) Varnish with bleached MFC, (c) Varnish with unbleached MFC, (d) Particles pulled out during the test, sample with bleached MFC.
Poaty et al. (2014) performed the same test using cellulose nanocrystals (CNC) added to the varnish, and obtained approximate results of 6 MPa for the varnish with CNC, a result similar to that found in this work.
In the impact resistance test, all samples had an impact degree of 5, respecting the requirements of the standard for use in any category of furniture finishing, considered slight impact, which can an almost imperceptible mark, without the presence of cracks (Figure 8).
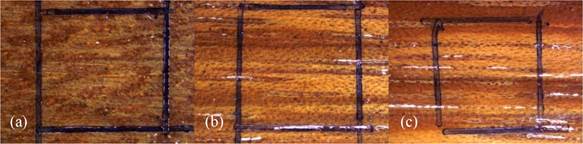
Figure 8:
(a) Finishing with plain varnish, (b) Varnish with bleached MFC, (c) Varnish with unbleached MFC. Images captured a 10x magnification.
The waterborne varnish had good ability to absorb the impact caused by the falling sphere, preventing wood cracking. The same was observed by Fonte (2016), who classified the impacts on wood coated with water-based varnish as grade 5.
The addition of MFC did not result in large variations in this test. The same degree of impact was found for all three treatment types.
Conclusions
The optical coating characteristics, such as color, were not affected by the addition of microfibrillated cellulose, and did not change the visual appearance when compared to samples with plain varnish.
The changes in wood wettability were also small. There was no statistical difference between the specimens coated with plain varnish and that containing unbleached MFC. But the contact angle for the coating containing unbleached MFC increased, consequently producing the best results.
In general, in the qualitative evaluation tests of the finish, the addition of nanocellulose did not cause significant differences, but in the adhesion test, there was greater particle pull-out, which could be the result of a better anchoring of the varnish to the wood.
It is possible to conclude the use of MFC as reinforcement in coatings has potential, but tests with different consistencies and tests of other properties are necessary.
References:
Barreto, C.C.K.; Pastore, T.C.M. 2009. Resistência ao intemperismo artificial de quatro madeiras tropicais: o efeito dos extrativos. Ciencia Florestal 19(1): 23-30: http://dx.doi.org/10.5902/19805098416
Duan, H.; Shao, Z.; Zhao, M.; Zhou, Z. 2016. Preparation and properties of environmental-friendly coatings based on carboxymethyl cellulose nitrate ester & modified alkyd. Carbohydrate Polymers 137: 92-99: https://doi.org/10.1016/j.carbpol.2015.10.067
Dufresne, A. 2013. Nanocellulose: a new ageless bionanomaterial. Materials Today 16(6): 220-227: https://doi.org/10.1016/j.mattod.2013.06.004
Ferreira, D.F. 2008. SISVAR: um programa para análises e ensino de estatística. Revista Symposium6: 36-41: https://des.ufla.br/~danielff/meusarquivospdf/art63.pdf
Ferreira, L.M.V. 2013. Revestimentos hidrofóbicos. Thesis Master's degree. Universidade Nova de Lisboa, Lisboa, Portugal. http://hdl.handle.net/10362/11045
Ferreira, M.D.; Spricigo, P.C. 2017. Colorimetria - Princípios e aplicações na agricultura. In Instrumentação pós-colheita em frutas e hortaliças. Ferreira, M.D. (Technical Ed.). Embrapa Instrumentação: São Carlos, Brazil. pp.209-220. https://www.alice.cnptia.embrapa.br/alice/handle/doc/1084379
Fonte, A.P.N. 2016. Utilização da madeira de Cryptomeria japonica para a produção de painéis colados lateralmente e aplicação de acabamento superficial. Thesis (Master's degree), Universidade Federal do Paraná, Curitiba, PR, Brazil. https://acervodigital.ufpr.br/bitstream/handle/1884/46063/R%20-%20D%20-%20ANA%20PAULA%20NAMIKATA%20DA%20FONTE.pdf?sequence=1&isAllowed=y
Garcia, R.A.; Oliveira, N.S.; Nascimento, A.M.; Souza, N.D. 2014. Colorimetria de madeiras dos gêneros Eucalyptus e Corymbia e sua correlação com a densidade. Cerne 20(4): 509-517: https://doi.org/10.1590/01047760201420041316
Gezici-Koç, Ö.; Erich, S.J.F.; Huinink, H.P.; Van Der Ven, L.G.J.; Adan, O.C.G. 2018. Understanding the influence of wood as a substrate on the permeability of coatings by NMR imaging and wet-cup. Progress in Organic Coatings 114: 135-144: http://dx.doi.org/10.1016/j.porgcoat.2017.10.013
Gibbons, M.J.; Nikafshar, S.; Saravi, T.; Ohno, K.; Chandra, S.; Nejad, M. 2020. Analysis of a wide range of commercial exterior wood coatings. Coatings 10: e1013. https://doi.org/10.3390/coatings10111013
Hikita, Y.; Toyoda, T.; Azuma, M. 2001. Weathering testing of timber: discoloration. In High performance utilization of wood for outdooor uses. Imamura, Y. (Ed.) Press-Net: Kyoto, Japan, pp.27-32.
Islam, M.T.; Alam, M.M.; Zoccola, M. 2013. Review on modification of nanocellulose for application in composites. International Journal of Innovative Research in Science, Engineering and Technology 2(10): 5444-5451. http://www.ijirset.com/upload/october/43_REVIEW.pdf
Kluge, M.; Veigel, S.; Pinkl, S.; Henniges, U.; Zollfrank, C.; Rossler, A.; Gindl-Altmutter, W. 2017. Nanocellulosic fillers for waterborne wood coatings: reinforcement effect on free-standing coating films. Wood Science and Technology 51(3): 601-613: https://doi.org/10.1007/s00226-017-0892-y
Lengowski, E.C.; Muñiz, G.I.B.; Andrade, A.S.; Simon, L.C.; Nisgoski, S. 2018. Morphological, physical and thermal characterization of microfibrillated cellulose. Revista Árvore 42(1): e420113: http://dx.doi.org/10.1590/1806-90882018000100013
Martins, G.B.C.; Sucupira, R.R.; Suarez, P.A.Z. 2015. Chemistry and Colors. Revista Virtual de Quimica 7(4): 1508-1534.http://dx.doi.org/10.5935/1984-6835.20150082
Poaty, B.; Vardanyan, V.; Wilczak, L.; Chauve, G.; Riedl, B. 2014. Modification of cellulose nanocrystals as reinforcement derivatives for wood coatings. Progress in Organic Coatings 77(4): 813-820: http://dx.doi.org/10.1016/j.porgcoat.2014.01.009
Potulski, D.C.; Viana, L.C.; Muniz, G.I.B.; Andrade, A.S.; Klock, U. 2016. Caracterização de nanofilmes de celulose nanofibrilada obtida em diferentes consistências. Scientia Forestalis 44(110): 361-372. http://dx.doi.org/10.18671/scifor.v44n110.09
Schrader, M.E. 1995. Young-Dupre Revisited. Langmuir 11(9): 3585-3589. https://doi.org/10.1021/la00009a049
Segal, L.; Creely, J.J.; Martin, A.E.; Conrad C.M. 1959. An empirical method for estimating the degree of crystallinity of native cellulose using the X-ray diffractometer. Textile Reseach Journal 29(10):786-794. http://dx.doi.org/10.1177/004051755902901003
Silva, E.L.; Vieira, H.C.; Santos, J.X.; Nisgoski, S.; Saul, C.K.; Muñiz, G.I.B. 2019. Nanofibrillated cellulose, the small promising fiber: characteristics and potentialities. Floresta 49(3): 411-420. http://dx.doi.org/10.5380/rf.v49i3.58864
Tan, Y.; Liu, Y.; Chen, W.; Liu, Y.; Wang, Q.; Li, J.; Yu, H. 2016. Homogeneous dispersion of cellulose nanofibers in waterborne acrylic coatings with improved properties and unreduced transparency. ACS Sustainable Chemistry & Engineering 4(7): 3766-3772. https://doi.org/10.1021/acssuschemeng.6b00415
Vardanyan, V.; Galstian, T.; Riedl, B. 2014. Effect of addition of cellulose nanocrystals to wood coatings on color changes and surface roughness due to accelerated weathering. Journal of Coatings Technology and Research 12(2): 247-258. https://doi.org/10.1007/s11998-014-9634-3
Veigel, S.; Grüll, G.; Pinkl, S.; Obersriebnig, M.; Müller, U.; Gindl-Altmutter, W. 2014. Improving the mechanical resistance of waterborne wood coatings by adding cellulose nanofibres. Reactive and Functional Polymers 85: 214-220. http://dx.doi.org/10.1016/j.reactfunctpolym.2014.07.020
Viana, L.C.; Muñiz, G.I.B.; Magalhães, W.L.E.; Andrade, A.S.; Nisgoski, S.; Potulski, D.C. 2019. Nanostructured Films Produced from the Bleached Pinus sp. Kraft Pulp. Floresta e Ambiente 26(4): e20150191. http://dx.doi.org/10.1590/2179-8087.019115
Yona, A.M.C.; Žigon, J.; Matjaž, P.; Petrič, M. 2021. Potentials of silicate-based formulations for wood protection and improvement of mechanical properties: A review. Wood Science and Technology 55: 887-918. https://doi.org/10.1007/s00226-021-01290-w
Žigon, J. 2021. Interactions of a waterborne coating with plasma pre-treated densified beech wood. European Journal of Wood and Wood Products 79: 1383-1394. https://doi.org/10.1007/s00107-021-01716-z
Author notes
♠Corresponding author: tawnaide@gmail.com