Coordinated recharge of electric vehicles in real time
Coordinación de la recarga de vehículos eléctricos en tiempo real
Coordinated recharge of electric vehicles in real time
Dyna, vol. 83, no. 197, pp. 223-232, 2016
Universidad Nacional de Colombia

This work is licensed under Creative Commons Attribution 4.0 International.
Received: 24 January 2016
Revised: 23 February 2016
Accepted: 04 March 2016
Abstract: The electric vehicle is a transportation technology that requires a management system for the electric networks of the future in order to avoid overloads and adverse effects on voltage level and power quality. This article presents a management algorithm to adjust the operation and recharge conditions of electric vehicles in real time, optimizing the use of network capacity and improving the voltage profile through the coordination of recharges depending on loss sensitivity; an approach to identify nodes where power losses can decrease or increase under a specific load condition. The results obtained by applying the strategy are presented through a random consumption model of vehicles based on existing mobility patterns using a distribution circuit of 628 nodes. This allows the identification of electric vehicle penetration after which it becomes necessary to implement the proposed management scheme.
Keywords: Electric vehicle, management algorithm, recharge coordination, selection of maximum sensitivities, sensitivity ranges, voltage level, power losses, maximum capacity.
Resumen: El vehículo eléctrico es una tecnología de transporte que requiere un sistema de gestión para las redes eléctricas del futuro para evitar sobrecargas y efectos negativos en el nivel de voltaje y la calidad de potencia. Por lo tanto, este articulo presenta un algoritmo de gestión para ajustar las condiciones de operación y recarga de los vehículos eléctricos en tiempo real, optimizando el uso de la capacidad de la red y mejorando el perfil de voltaje a través de la coordinación de las recargas dependiendo de la sensibilidad de perdidas, un enfoque que identifica los nodos donde las pérdidas de potencia pueden disminuir o aumentar bajo condiciones de carga especifica. Los resultados obtenidos aplicando la estrategia, son presentados a través de un modelo de consumo aleatorio de los vehículos basado en los patrones de movilidad existentes, usando un circuito de distribución de 628 nodos. Esto permite la identificación del nivel de penetración después del cual se hace necesario implementar el esquema de gestión propuesto.
Palabras clave: Vehículo Eléctrico, Algoritmo de gestión, recarga coordinada, selección de sensibilidades máximas, rango de sensibilidades, nivel de voltaje, pérdidas de potencia, capacidad máxima.
1. Introduction
The current electric sector combines the concepts of energy efficiency, demand response, and load management. All of them aim to change energy consumption patterns through changes in facilities, infrastructure, devices, customs or prices [1]. For this reason, countries with projects incorporating new generation resources [2,3] or implementing technologies such as electric vehicles, adopt strategies to manage demand, since this represents economic benefits for the end user and the energy supplier [4,5], significantly reducing energy demand at peak hours, and thus preserving the stability of the electric system and service continuity [6].
Some research studies have shown that to perform the simultaneous recharge of electric vehicles (EV) without any control, depending on EV penetration, can cause power losses, voltage drops, harmonics and transformer overloads, among others, which increment the system operation and maintenance costs [7,8,9,10]. Therefore, in order to achieve the massive introduction of electric vehicles without threatening the system, it is important to consider a strategy that will coordinate the recharges to mitigate or prevent the described impacts.
According to the above, this paper proposes a management algorithm for recharging electric vehicles in real time, based on the operation conditions of the distribution system, the priority of connection and the selection of nodes contributing to the increment of power losses. This will enable optimization in the use of the network capacity, a factor that can have an impact on network reliability, security, and performance. In Section 2, a background of the impact of electric vehicles on distribution networks is presented. A methodology for managing the electric vehicle recharge in real time is described in Section 3. In Section 4 a management algorithm for the simultaneous recharge of electric vehicles is presented, and Section 5 outlines the implementation of the proposed management algorithm in a case study. Conclusions are drawn in section 6.
2. Background of the impact of electric vehicles on distribution networks
The massive introduction of electric vehicles in a distribution network forces those responsible for its operation and maintenance to verify the impact these can cause. However, these loads can have many effects on the network and they depend largely on factors such as EV penetration, the implemented recharge strategy, the battery size, the number of users, the load profiles, the distribution transformer capacity, the size of the primary feeder, among others [11, 12, 13].
An effect of the simultaneous connection of nonlinear loads such as battery chargers of electric vehicles is the injection of harmonics to the network [14, 15, 16, 17]. In particular, distribution transformers are designed to withstand linear loads with a specific frequency; therefore, current harmonics will contribute to increased losses of up to 40% and a rise in equipment temperature [7,18]. Therefore, the life cycle of the device decreases exponentially and the investment costs could increase by up to 15% [19]. Recent research states that power losses are directly proportional to EV penetration [8,20,21].
Another point of interest is the voltage profile, where a decisive factor is load location, given that although the number of vehicles increases, if the distance between the load and the substation feeding the circuit is short, the voltage drops will be up to 10% lower in comparison to the corresponding ones for distant loads. However, since distribution systems typically have a voltage imbalance caused by the load variation in each of the phases, the phase to which a certain number of vehicles is connected will experience a large voltage drop while others will experience a rise in voltage [20,22,23,24,25].
In addition, some studies show that in a scenario where the penetration rate is between 20% and 30%, the maximum transformer capacity could be exceeded by up to 36% [22,26,27,28,29], without considering the constantly changing technology for batteries and chargers. In these works, the authors calculate the energy required by each electric vehicle connected to the distribution system using a probabilistic model, which allows the impact analysis of massive EV recharge. In the case study presented in [10], it was found that the voltage profile could drop by up to 8% below the established limit, the power losses may increase by 3-5 times compared to a scenario without electric vehicles, and the maximum capacity of the transformer feeding the circuit would be exceeded by about 13.16%.
Several management strategies have been evaluated in this research, such as the use of objective functions for minimizing power losses through centralized communication systems [30] or demand response strategies, where the user schedules the recharge according to his preferences. This, taking into account that management is based on a stochastic method considering the driving patterns and the time of arrival to the house [31].
[32,33] consider the recharge of a fleet of electric vehicles based on the amount of required energy, the selling price, the contracted power and the time they must be ready to operate. In [34], the authors seek to recharge the vehicles maximizing the satisfaction of owners and minimizing the network operation costs, without violating the restrictions of that network. Meanwhile, in [35], the management system considers generation from renewable sources in order to maximize the net income of charging stations, by scheduling the energy required for the recharge on the previous day and controlling this process in real time. Therefore, the proposed management schemes usually seek to optimize the use of the existing electric networks, fulfill the load requirements of users and maintain the provided quality service, avoiding an alteration in voltage levels, load curve of the system, and power losses [36,37,38].
3. Methodology for managing the electric vehicle recharge in real time
This research proposes a methodology to coordinate the recharge of electric vehicles based on the minimization of power losses and considering voltage restrictions and distribution system capacity, thereby mitigating the impact they could generate on network reliability and security.
The developed methodology has been divided into four phases, which are described in this section and are summarized in Fig. 1. These phases include the construction of the consumption model for electric vehicles, the impact assessment, the proposed management scheme and the results analysis.
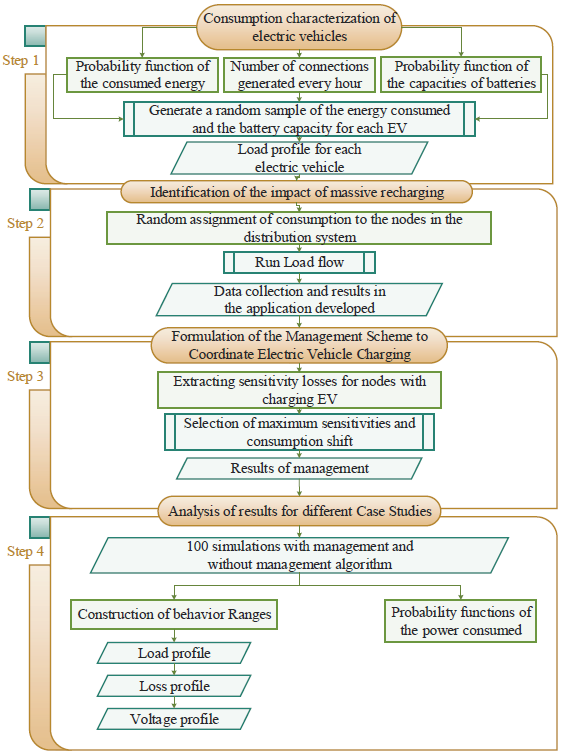
Figure 1
Conceptual map of the methodology used to manage the recharge of electric vehicles
The Authors.
3.1. Step 1: Characterization of electric vehicle consumption
This phase seeks statistical correlation between the variables that determine the electric vehicle consumption (number of connections, battery capacity and traveled distances) and mobility behavior in the city, in a scenario of introducing electric vehicles proportionally to the number of users of the distribution system. In this way, it is expected that loading conditions and power demand required by the network vary randomly according to a probability distribution of the energy required by the battery.
3.2. Step 2: Identification of the massive recharge impact
From the model of electric vehicle consumption in the previous phase, the technical information of the distribution system, and the residential demand of the circuit, it is possible to calculate the load flow for each hour and to determine the power in all branches, the voltage levels and the losses in the distribution system. Once the operation limits are defined, it is possible to assess the impact on the recharge condition of electric vehicles "without control", for which it is possible to develop a computer application where several case studies can be programmed and the statistical analysis of these variables, can be performed [10].
3.3. Step 3: Characterization of electric vehicle consumption
With the identification of the network problems associated with massive electric vehicle recharge, the third phase of the methodology seeks to maintain the operation conditions of the distribution circuit based on the minimization of technical losses in the system. The aim is to increase the network efficiency while reducing operation and maintenance costs. Under this approach, the concept of demand response is involved as a control strategy when facing unpredictable loading conditions generated by the consumption model developed in the first phase.
The main tool of the proposed management scheme is the loss sensitivity approach [39,40], through which it is possible to identify the nodes with sensitivity indices representing the largest contribution to system losses according to the power consumed by the electric vehicle connected there. Later, these nodes are selected to shift the battery recharge to another time, when the loading conditions of the system are not exceeded or during off-peak demand on the load curve, so that both the voltage profile and the capacity of the transformer feeding the distribution circuit do not exceed the permitted limits.
For this purpose, it is convenient again to develop and implement the proposed management algorithm within the software tool, in order to observe the behavior of the analyzed variables in three scenarios: the first, without electric vehicles; the second, with electric vehicles without management; and the third, performing the management by implementing the proposed scheme. It is convenient to use the proposed application, since the process must be repeated many times, depending on the number of nodes in the system and the number of vehicles connected to this.
3.4. Step 4: Results analysis for different case studies
After implementing the management scheme proposed in the previous phase, several case studies are constructed by varying the percentage of EV penetration in the distribution system. N simulations are performed using the Monte Carlo method [41]. Using these simulations, voltage profiles, load curves and power loss curves are evaluated to find the range of values defining the behavior of the system under study. This allows us to determine the level of penetration from which the power demand exceeds the capacity of the circuit, and the variations in the voltage profile are below the accepted limit.
Given the objective of this article, the management algorithm proposed to coordinate the electric vehicle recharge in real time is explained in Section 4.
4. Management algorithm for the simultaneous recharge of electric vehicles
Taking into account that the load conditions can change from hour to hour during a day, the proposed management algorithm coordinates recharges through the selection of maximum sensitivity of the active power to find nodes where the load shedding leads to decreased losses, according to the restrictions of the objective function as presented below.
4.1. Objective function
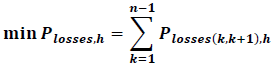
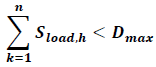
In order to mitigate the impact of recharging electric vehicles, an objective function is defined that fulfills the operation conditions of the electric grid in a system of equations for minimizing power losses according to the voltage restrictions and maximum capacity of the distribution circuit feeder, as shown in eq. (1), (2), (3).
 [Ecuation 1]
 [Ecuation 2]
 [Ecuation 3]
where:
Plosses,h: total active power losses in the system at a specific time of day.
Plosses(k,k+1),h: active power losses in a branch comprised between k and k+1, at a specific time.)
Sload,h: apparent power of the load in each node for a specific time.
Dmax: peak demand level, defined by the capacity assigned to the circuit from the substation transformer.
: voltage magnitude in node k in p.u.
n: total number of system nodes.
This objective function only has a solution in the operation points fulfilling the two constraints (voltage and peak demand); i.e., in periods when one of the conditions is not fulfilled the recharge of electric vehicles must be managed.
4.2. Proposed management algorithm
One of the concepts used by the proposed management algorithm is selective load shedding, since under a condition of consumed power in the system, the charge of a set of electric vehicles is postponed, in order to fulfill the constraints of the objective function described above.
On the other hand, the management scheme must have a criterion for deciding which system loads must be postponed, so that the problem lies in finding a method to select the loads with the greatest contribution to power losses according to system constraints. To do this, we used the loss sensitivity approach and the maximum sensitivities selection technique.
4.2.1. Loss sensitivity approach
The loss sensitivity approach allows us to quantify through indices the contribution each system node provides to the increment of losses, according to the present load condition [42].
The sensitivity calculation is derived from the Jacobian matrix of the Newton-Raphson method for solving power flows by expressing the voltage magnitude and angle (state variables) in terms of system incremental losses [43].
Finally, the loss sensitivity; i.e., the variation of the power losses in a branch of the system with respect to the variation in the power injected into a node is calculated with eq. (4), where [JT]-1, represents the transpose and inverse matrix of the Jacobian obtained from the load flow in its latest iteration[43].
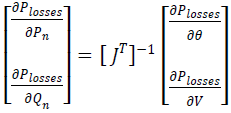 [Ecuation 4]
4.2.2. Maximum sensitivities selection
From the calculation of loss sensitivity, it is possible to find different indices for categorizing the system nodes. In some research works, the selection of the most representative sensitivities corresponds to finding places in the system where power losses can decrease or increase, according to the injection of active or reactive power in the nodes [40,42].
Considering that residential distribution systems typically have radial topologies and the increment of losses is proportional to the distance between their branches, variations in active power are positive. Since these loading conditions vary by the hour, in this study, a tool is managed, through the selection of maximum sensitivities of active power, to find nodes where load shedding leads to loss reduction, according to the constraints of the objective function. The proposed management algorithm uses the selection of maximum sensitivities to postpone the recharge of a specific set of electric vehicles (EV). The process is summarized in the steps shown in Fig. 2, where:
h=hstart:hend: Time interval of the load curve analysis.
Ybus: Admittance matrix of distribution system under study.
-
The sensitivity indices decrease in nodes where electric vehicle recharge shifts to the next hour. Under this premise, the selection criteria can set sensitivity ranges, which decrease as the electric vehicles recharge is postponed, implying us to: Select the nodes with the highest sensitivity indices within an established range and shift the electric vehicle recharge to the next hour.
-
When shifting the power that a set of electric vehicles would consume during recharge, the loading conditions in the distribution system will change, which means: For a specific loading condition in the system, specific sensitivity indices are established.
-
Since the calculation of sensitivities comes from the Jacobian matrix, when the loading conditions change, it is necessary to run the power flow again, then: The load flow is run each time load shedding occurs in the system.
-
Finally, this process is repeated until the constraints of the objective function are fulfilled, so that the sensitivity ranges established at each iteration of the process decrease as the selective load shedding is carried out. Similarly, it is important to note that these steps must be repeated for each hour of the load curve when any voltage or circuit capacity restriction is not fulfilled, meaning the management algorithm must act whenever the loading conditions change until achieving the coordinated recharge.
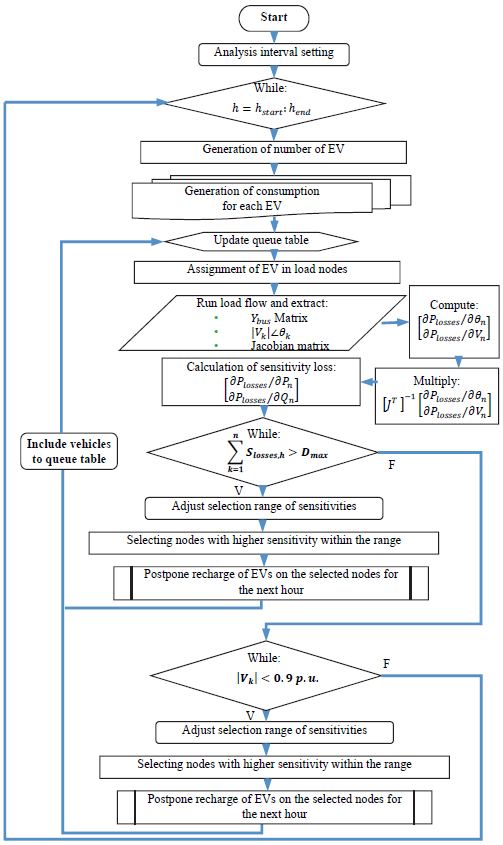
Figure 2
Flowchart of the methodology used by the management algorithm.
The Authors.
5. Implementation of the proposed management algorithm
To evaluate the effect of recharging electric vehicles and the implementation of the proposed management algorithm, a MATLAB application, including a graphical interface was developed. Using this software application, several case studies are simulated.
The system selected to implement the proposed management algorithm corresponds to a typical residential distribution circuit of the city of Bogota with 628 nodes, of which 500 are residential users. It also has 17 distribution transformers and it is characterized by having medium and low voltage underground cables [44].
The limits used as reference to demonstrate the impact of the connection of electric vehicles and to evaluate the performance of the management algorithm are defined below:
-
In accordance with the standard NTC 1340 [45] and the standard ANSI C84.1 [46], in normal operating conditions, the voltage for levels 1, 2 and 3 must be between +5% and -10% of the nominal voltage.
-
The substation has three 30 MVA - 115/11.4 kV transformers. Each transformer supplies power to eight circuits with a maximum capacity of 3.8 MVA.
In order to predict the behavior of the voltage level and the capacity of the electric network, different simulations are performed to assess the effects on these variables depending on EV penetration. Based on these results, it is possible to predict for a scenario with 38% EV penetration that the voltage levels will be below the established limit, even if the maximum capacity of the circuit is below 3.8 MVA. However, both voltage and capacity are out of limits with 72% EV penetration.
Therefore, in the following sections, the parameters of voltage, maximum capacity, and losses under three EV penetration scenarios will be assessed: 38%, 72% and 100%, also analyzing their behavior when implementing the management algorithm proposed in Section 3.
5.1. Case Study 1: 38% EV penetration
For this case study, 100 simulations corresponding to a day and a 38% EV penetration were performed. Fig. 3 shows the behavior of the voltage level at each node in the distribution system, whereby in (a) we can observe that the lower limit is exceeded reaching values of 0.875 p.u.; however, when applying the proposed management algorithm (b) shows that the voltage drops caused by the recharge are avoided.
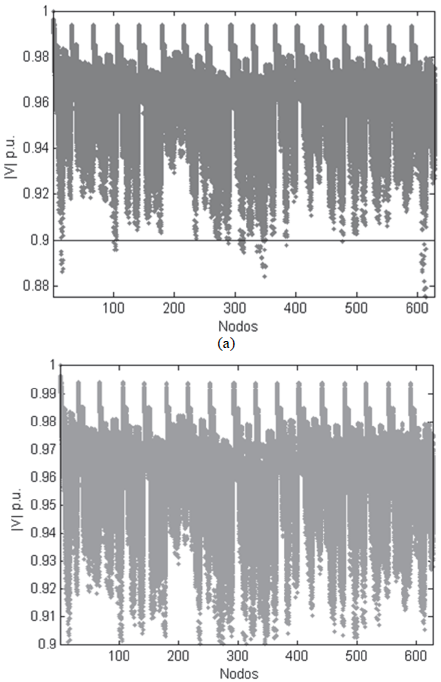
Figure 3
Behavior of the voltage level with 38% EV penetration level: (a) without any management and (b) with the proposed management algorithm
The Authors.
When analyzing the maximum capacity assigned to the circuit, it is clear that this variable is not affected with the number of vehicles without any management, and when the management is implemented, a maximum value of 3.3 MVA is reached. As the capacity of the transformer supplying power to the circuit was not exceeded, the power losses are not modified even after implementing the management.
5.2. Case Study 2: 72% of electric vehicles penetration
As in the previous case, 100 simulations corresponding to a day were carried out. The demand was managed with a penetration level of 72%. The obtained data presented in Fig. 4 indicate the voltage level reaches values close to 0.855 p.u. without any control on vehicle recharge (a). However, the management scheme ensures that the minimum limit of 0.9 p.u. is fulfilled regardless of the number of users connected to the system.
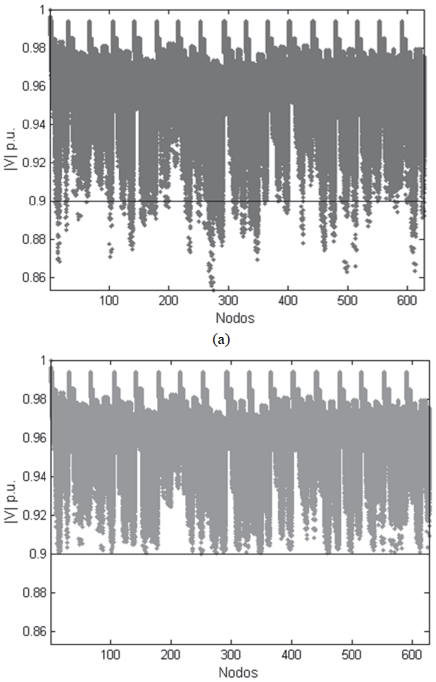
Figure 4
Behavior of the voltage level with 72% EV penetration level: (a) without any management and (b) with the proposed management algorithm
The Authors.
On the other hand, Fig. 5 shows that a 72% of electric vehicles' penetration into the electric grid makes the maximum capacity reach values close to 4.2 MVA, representing an overload of up to 400 kVA for the transformer supplying power to the load (a). However, the management scheme avoids this situation, which could endanger system stability and security, postponing the needed recharges taking into account the priority of connection and keeping below the capacity value assigned to the circuit (b).
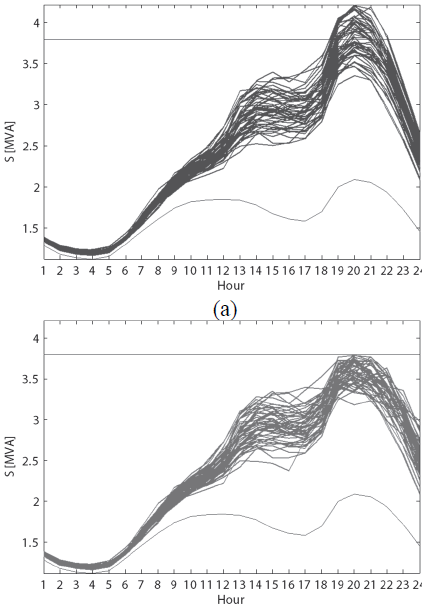
Figure 5
Behavior of load curves with 72% EV penetration level: (a) without any management and (b) with the proposed management algorithm
The Authors.
Evaluating the behavior of power losses, when executing the management algorithm a loss reduction of 25.72% is achieved, while maintaining the voltage level and system capacity, which confirms that the algorithm works.
5.3. Case Study 3: 100% of electric vehicles penetration
Assuming the most critical case, i.e., 100% of electric vehicle penetration, this scenario is simulated 100 times, allowing the voltage level to reach values of close to 0.82 p.u. when the recharges are not managed, meaning they are 8% below the limit established in the regulations. Otherwise, with the operation of the management algorithm the recharge is carried out without exceeding 0.9 p.u.
By comparing the behavior of the system load curves, Fig. 6 shows that 100% EV penetration represents a load close to 4.7 MVA (a), i.e., 500 kVA more than with 72% penetration and 1400 kVA more than in case study 1. By applying the methodology proposed in the paper to manage the recharges, load curves flatten when the maximum power demand occurs ensuring the permitted limit and proper system operation (b).
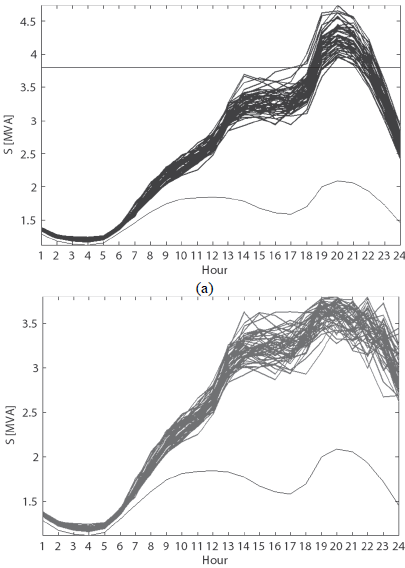
Figure 6
Behavior of load curves in the presence of 100% EV penetration level: (a) without any management and (b) with the proposed management algorithm
The Authors.
If technical losses are evaluated against case study 2, Fig. 7 shows an increase of 50 kW when there is no control of the charging time, reaching a value of close to 220 kW (a). In addition, when compared to the scenario without electric vehicles connected to the network, it is possible to state that with 100% of electric vehicle penetration, the increase in losses would be equivalent to 3 or 5 times. After managing the battery recharge of electric vehicles connected to the system, a reduction of 40.37% is achieved in the power losses (b), which would mean lower operation costs for the network and the optimization of the objective function under which the algorithm was proposed.
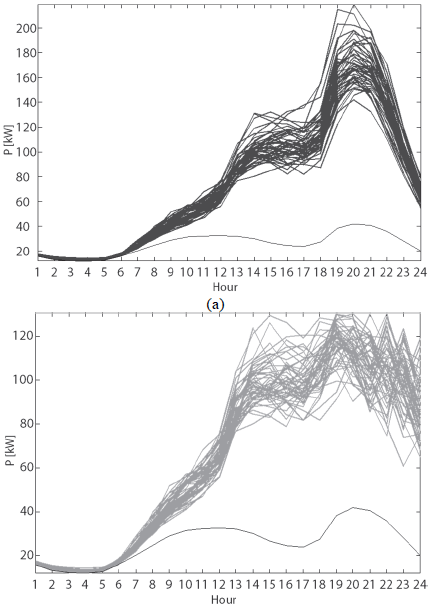
Figure 7
Behavior of the power loss curves with 100% EV penetration level: (a) without any management and (b) with the proposed management algorithm
The Authors.
In order to analyze the effect of the proposed management algorithm on the variables under study, Table 1 summarizes the results obtained in the case studies presented above.
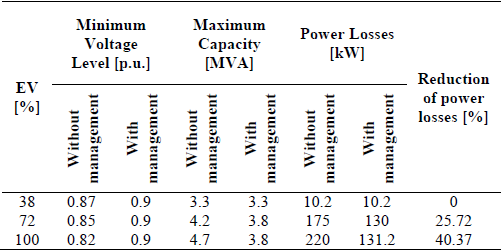
The Authors.
Finally, in Table 2 a comparison of computational costs and features of the proposed management scheme is presented.
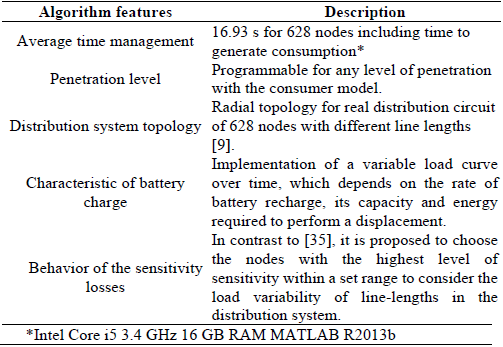
The Authors.
6. Conclusions
From the obtained results, it is possible to state that when applying the proposed management algorithm, both voltage and capacity were within the allowed limits due to the shift in the recharge of vehicles connected to the nodes with greater loss sensitivity indices. Likewise, the reduction on power losses in the branches are close to 26% in a scenario with 72% EV penetration, but these losses decrease approximately twice with 100% EV penetration, which would represent a reduction in investment, operation, and maintenance costs of networks and equipment for energy distribution companies.
Although the negative impacts on the network can occur at any time and under certain penetration levels, the methodology proposed in this study can be applied to manage any scenario.
The loss sensitivity approach used in the proposed management algorithm allows the coordination of the recharges in a random consumption scenario through minimizing losses, while voltage levels in all nodes significantly improve and peak demand control is carried out, increasing the efficiency and avoiding the need to expand the distribution system infrastructure.
The voltage level is critical in the branches which: a) are at a greater distance from the distribution network transformer, b) are the load nodes farthest from the connected distribution transformer, c) are branches with longer sections.
The impact of massive charging of electric vehicle on power losses is a function of the number of EV connections, the capacity and charging characteristic of the batteries, the parameters of conductors, the sections length and the system topology, as well as the behavior of residential demand.
References
1. Godlman, C., Reid, M., Levy R. and Silverstein, A., Coordination of energy efficiency and demand response: A resource of the national action plan for energy efficiency, USA, 2010.
2. Ministerio de Industria, Turismo y Comercio, Estrategia integral para el impulso del vehículo eléctrico en España, España, 2010.
3. Carvajal, S., Arango, A., Arango, S. and Younes, C., A study of incentives to increase the use of DG in Colombia based on a System Dynamics modeling, Ingeniería e Investigación, 31(2), pp. 58-65, 2011.
4. Huang, S. and Infield, D., Demand side management for domestic plug-in electric vehicles in power distribution system operation, The 21st International Conference on Electricity Distribution (CIRED), Frankfurt, Paper 0701,2011.
5. Finn, P., Fitzpatrick, C. and Connolly, D., Demand side management of electric car charging: Benefits for consumer and grid, Energy, 42(1), pp. 358-363, 2012. DOI: 10.1016/j.energy.2012.03.042
6. Vandael, S., Claessens, B., Hommelberg, M., Holvoet, T. and Deconinck, G., A scalable three-step approach for demand side management of plug-in hybrid vehicles, IEEE Transactions on Smart Grid, 4(2), pp. 720-728, 2013. DOI: 10.1109/TSG.2012.2213847
7. Pieltain, L., Gómez, T., Cossent, R., Domingo, C. and Frías, P., Assessment of the impact of plug-in electric vehicles on distribution networks, IEEE Transactions on Power Systems, 26(1), pp. 2066-213, 2011. DOI: 10.1109/TPWRS.2010.2049133
8. Kazerooni, M., New load demand for electric vehicles and its harmonic impacts on power system distribution transformers, Msc. Thesis, Department of Electrical Engineering, University of Windsor, Ontario, Canada, 2012.
9. Grahn, P., Electric vehicle charging impact on load profile, BSc. Thesis, Department of Electrical Engineering, Royal Institute of Technology, Stockholm, Sweden, 2013.
10. Mendoza, C., Quintero, A., Santamaria, F. and Alarcon, J., Impact analysis of plug-in electric vehicles on an electric distribution network, Transmission & Distribution Conference and Exposition - Latin America, Medellín, 2014. DOI: 10.1109/TDC-LA.2014.6955258
11. Gerkensmeyer, C., Kintner-Meyer, M. and DeSteese, J., Technical challenges of plug-in hybrid electric vehicles and impacts to the US power system: Distribution system analysis, United States Department of Energy, USA, 2010.
12. De Nigris, M., Gianinoni, S., Grillo, S., Massucco, S.and Silvestro, F., Impact evaluation of plug-in electric vehicles (PEV) on Electric Distribution networks, 14th International Conference on Harmonics and Quality of Power (ICHQP), Bergamo, Italy, 2010. DOI: 10.1109/ICHQP.2010.5625433
13. Yao, W., Guo, Q., Hongbin, S. and Zhengshuo, L., An investigation into the impacts of the crucial factors on EVs charging load, de IEEE PES ISGT Asia, Asia, 2012. DOI: 10.1109/ISGT-Asia.2012.6303111
14. Gómez, J.C. and Morcos, M.M., Impact of EV battery chargers on the power quality of distributed systems, IEEE Transactions Power Delivery, 18(3), pp. 975-981, 2003. DOI: 10.1109/TPWRD.2003.813873
15. Basu, M., Gaughan, K. and Coyle, E., Harmonic distortion caused by EV battery chargers in the distribution systems network and its remedy, 39th Universities Power Engineering Conference (UPEC), 2, pp. 869-873, Bristol UK, 2004.
16. Jiang, C., Torquato, R., Salles, D. and Xu, W., Method to assess the power quality impact of plug-in electric vehicles, 2014 IEEE 16th International Conference on Harmonics and Quality of Power (ICHQP), pp. 170-180, Bucharest, Romania, 2014. DOI: 10.1109/ICHQP.2014.6842835
17. Niitsoo, J., Taklaja, P., Palu, I. and Kiitam, I., Modelling EVs in residential distribution grid with other nonlinear loads, 2015 IEEE 15th International Conference on Environment and Electrical Engineering (EEEIC), pp. 1543-1548, Rome, 2015. DOI: 10.1109/EEEIC.2015.7165401
18. Rosso, Á., Evaluación del impacto de los vehículos eléctricos en las redes de distribución, BSc. Tesis, Departamento de Ingeniería Industrial, Universidad Pontificia Comillas, Madrid, España, 2010.
19. Grahn, P., Rosenlind, J., Hilber, P., Alvehag ,K. and Soder, L., A method for evaluating the impact of electric vehicle charging on transformer hotspot temperature, 2nd IEEE PES International Conference and Exhibition on Innovative Smart Grid Technologies (ISGT Europe), Manchester, United Kingdom, 2011. DOI: 10.1109/ISGTEurope.2011.6162755
20. Sharma, I., Canizares, C. and Bhattacharya, K., Smart charging of PEVs penetrating into residential distribution systems, IEEE Transactions on Smart Grid, 5(3), pp. 1196-1209, 2014. DOI: 10.1109/TSG.2014.2303173
21. Leou, R.C., Su, C.-L. and Lu, C.-N., Stochastic analyses of electric vehicle charging impacts on distribution network, IEEE Transactions on Power Systems, 29(3), pp. 1055-1063, 2014. DOI: 10.1109/TPWRS.2013.2291556
22. Tie, C.H., Gan, C.K. and Ibrahim, K., The impact of electric vehicle charging on a residential low voltage distribution network in Malaysia, 2014 IEEE Innovative Smart Grid Technologies - Asia (ISGT Asia), pp. 272-277, Kuala Lumpur, 2014. DOI: 10.1109/ISGT-Asia.2014.6873802
23. Neagoe-Stefana, A., Eremia, M., Toma, L. and Neagoe, A., Impact of charging electric vehicles in residential network on the voltage profile using Matlab, 2015 9th International Symposium on Advanced Topics in Electrical Engineering (ATEE), pp. 787-791, Bucharest, Romania , 2015. DOI: 10.1109/ATEE.2015.7133909
24. Geth, F., Leemput, N., Van Roy, J. and Buscher, J., Voltage droop charging of electric vehicles in a residential distribution feeder, 3rd IEEE PES International Conference and Exhibition on Innovative Smart Grid Technologies (ISGT Europe), Berlin, Germany, 2012. DOI: 10.1109/ISGTEurope.2012.6465692
25. Rodríguez-Garcia, L.F, Pérez-Londoño, S.M. and Mora-Flórez, J.J, Load area aggregation considering integration of electric vehicles to the system, Revista Ingeniería e Investigación, 35(Supl.1), pp. 42-49, 2015. DOI: 10.15446/ing.investig.v35n1Sup.53652
26. International Energy Agency, 2014 Anual Report, IEA, París, 2014.
27. Salah, F., Ilg, J.P., Flath, C.M., Bassec, H. and van Dinther, C., Impact of electric vehicles on high-voltage grids: A Swiss case study, Switzerland, 2013. DOI: 10.2139/ssrn.2209841
28. Stoeckl, G., Witzmann, R. and Eckstein, J., Analyzing the capacity of low voltage grids for electric vehicles, IEEE Electrical Power and Energy Conference (EPEC), pp. 415-420, Winnipeg, MB, Canada , 2011. DOI: 10.1109/EPEC.2011.6070236
29. Shafiee, S., Fotuhi-Firuzabad, M. and Rastegar, M., Investigating the impacts of plug-in hybrid electric vehicles on power distribution systems, IEEE Transactions on Smart Grid, 4(3), pp. 1351-1360, 2013. DOI: 10.1109/TSG.2013.2251483
30. Huachun, H., Haiping, X., Zengquan, Y. and Yingjie, Z., Interactive charging strategy of electric vehicles connected in smart grids, IEEE 7th International Power Electronics and Motion Control Conference (IPEMC), 3, pp. 2099-2103, Harbin, China, 2012. DOI: 10.1109/IPEMC.2012.6259168
31. Shao, S., Pipattanasomporn, M. and Rahman, S., Grid integration of electric vehicles and demand response with customer choice, IEEE Transactions on Smart Grid, 3(1), pp. 543-550, 2012. DOI: 10.1109/TSG.2011.2164949
32. Wu, D., Aliprantis, D. and Ying, L., Load scheduling and dispatch for aggregators of plug-in electric vehicles, IEEE Transactions on Smart Grid,3(1), pp. 368-376, 2012. DOI: 10.1109/TSG.2011.2163174
33. Xi, X. and Sioshansi, R., Using price-based signals to control plug-in electric vehicle fleet charging, IEEE Transactions on Smart Grid, 5(3), pp. 1451-1464, 2014. DOI: 10.1109/TSG.2014.2301931
34. Shaaban, M., Ismail, M., El-Saadany, E. and Zhuang, W., Real-Time PEV Charging/Discharging coordination in smart distribution systems, IEEE Transactions on Smart Grid, 5(4), pp. 179 -1807, 2014. DOI: 10.1109/TSG.2014.2311457
35. Guo, Y., Xu, S. and Su, W., Smart management system of plug-in electric vehicle charging service, 2015 IEEE Transportation Electrification Conference and Expo (ITEC), Detroit, USA, 2015. DOI: 10.1109/ITEC.2015.7165815
36. Deilami, S., Masoum, A., Moses, P. and Masoum, M., Real-Time coordination of Plug-In electric vehicle charging in smart grids to minimize power losses and improve voltage profile, IEEE on Smart Grids, 2(3), pp. 456-467, 2011. DOI: 10.1109/TSG.2011.2159816
37. Peng, H., Jinkuan, W. and Yinghua, H., Dynamic-priority-based real-time charging management for plug-in electric vehicles in smart grid, 2012 31st Chinese Control Conference (CCC), pp. 2432-2436, China, 2012.
38. Singh, M., Thirugnanam, K., Kumar, P. and Kar, I., Real-Time coordination of electric vehicles to support the grid at the distribution substation level, IEEE Systems Journal, 9(3), pp. 1000-1010, 2015. DOI: 10.1109/JSYST.2013.2280821
39. Yao, K.C. and Yao, W.T., New network sensitivity-based approach for real-time complex power flow calculation, IET Generation, Transmission & Distribution, 6(2), pp. 109-120, 2011. DOI: 10.1049/iet-gtd.2011.0429
40. Bhattacharyya, B. and Goswami, S.K., Sensitivity based evolutionary algorithms for reactive power dispatch, Third International Conference on Power Systems, Kharagpur, 2009. DOI: 10.1109/ICPWS.2009.5442664
41. Bingliang, Z., Yutian, S., Li, B. and Li, L.J.. A modeling method for the power demand of electric vehicles based on Monte Carlo simulation, Power and Energy Engineering Conference (APPEEC), Shanghai, 2012. DOI: 10.1109/APPEEC.2012.6307215
42. Khatod, D.K., Pant, V. and Sharma, J., A novel approach for sensitivity calculations in the radial distribution system, IEEE transactions on Power Delivery, 21(4), pp. 2048-2057, 2006. DOI: 10.1109/TPWRD.2006.874651
43. Peng, Y., Shun, H., Zou, J. and Wang, D., Improved method based on second order loss sensitivity for voltage collapse, International Conference on Electrical Engineering (ICEE), 2005.
44. CODENSA, Generalidades de la Norma LA, Bogotá, [En línea] 2009. Disponible en: http://likinormas.micodensa.com/
45. ICONTEC, NTC 1340: Tensiones y frecuencia nominales en sistemas de energía eléctrica en redes de servicio público, Segunda Ed., Instituto Colombiano de Normas Técnicas y Certificación (ICONTEC), Bogotá D.C., 2004.
46. American National Standards Institute, Inc., ANSI C84.1 - 2011: For Electric Power Systems and Equipment - Voltage Ratings (60 Hz), National Electrical Manufacturers Association, United States of America, 2011.
Author notes