Artículo Científico
Use of multicriteria decision making methods for biomass selection in Fischer Tropsch reactors
Uso de métodos multicriterio de toma de decisiones para la selección de biomasa en reactores Fischer Tropsch
Use of multicriteria decision making methods for biomass selection in Fischer Tropsch reactors
Ingenius. Revista de Ciencia y Tecnología, no. 15, pp. 27-36, 2016
Universidad Politécnica Salesiana

This work is licensed under Creative Commons Attribution-NonCommercial-ShareAlike 3.0 International.
Received: 04 March 2016
Accepted: 06 October 2016
Resumen: La elección adecuada de un combustible es una tarea importante para cumplir con los requisitos de un biorreactor. El número de combustible de biomasa con diferentes propiedades disponibles para proporcionar a un biorreactor es enorme. Sin embargo, la aplicación de aproximaciones matemáticas eficientes y sistemáticas puede lograr la evaluación. El uso de métodos multicriterio de toma de decisiones (MCDM) que consideran propiedades características y criterios cualitativos para asignar importancia a cada alternativa tiene el fin de seleccionar la mejor opción. Esta investigación se basa en el uso MCDM para la selección del combustible para un reactor de Fischer Tropsch. Los métodos MCDM implementados son la evaluación proporcional compleja de alternativas con las relaciones grises (COPRAS-G), análisis operativo de calificación y competitividad (OCRA), una evaluación de relación de aditivos (ARAS), técnica para el orden de preferencia por similitud con solución ideal (TOPSIS). La ponderación de los criterios se realizó por el proceso analítico jerárquico (AHP) y el método de entropía. Los resultados muestran que el arroz blanco es la mejor opción para un combustible de biomasa para los cinco MCMD.
Palabras clave: Biomasa, biocombustibles, métodos multicriterio de decisión.
Abstract: Proper choice of a fuel is an important task to fulfill the requirements for a bioreactor. The number of biomass fuel with different properties available to provide to a bioreactor is vast. However, application of efficiency and systematic mathematical approaches may achieve the evaluation. Multi-criteria decision making methods (MCDM) considers characteristic properties and qualitative criteria to assign importance to each alternative in order to select the best option. This research use MCDM for the selection of the fuel for a Fischer Tropsch reactor. The MCMD methods implemented are complex proportional assessment of alternatives with gray relations (COPRAS-G), operational competitiveness rating analysis (OCRA), a new additive ratio assessment (ARAS), Technique for Order of Preference by Similarity to Ideal Solution (TOPSIS) and SMART methods. The criteria weighting was performed by compromised weighting method composed of AHP (analytic hierarchy process) and Entropy methods. The results illustrated white grain appear has the best choice for a biomass fuel for the five MCMD.
Keywords: Biomass, biofuel, multi-criteria decision making methods.
Suggested citation:
Martínez, J. (2016). «Uso de métodos multicriterio de toma de decisiones para la selección de biomasa en reactores Fischer Tropsch». Ingenius. N°.15, (Enero-Junio). pp. 27-36. ISSN: 1390-650X.
1. Introduction
Biomass is a natural treasure for chemicals that up to now are made from fossil resources. Unfortunately, the heterogeneity and complexity of biomass still preclude exploitation of its full potential. New technologies for economical valorization of biomass are under development, but cannot yet compete with petrochemical processes. However, rising prices of fossil resources, inevitably will lead to replacement of oil refineries with other biorefineries or bioreactors.
The concern on impacts of global warming and decrease of the conventional fossil fuel sources enhance the interest to renewable energy sources. Biomass, containing all organic material that stems from plants. As a very ver- satile energy source, biomass can be used in transport, electricity and heating [1], [2]. Biomass, sun (e.g. photovoltaic solar cells and solar heat collectors), wind (e.g. wind turbines), water (e.g. hydropower, tidal energy) and geothermal resources are all sources of renewable energy, but biomass is the only renewable resource of carbon for the production of chemicals, materials and fuels. Before the onset of the petrochemical era, renewable feedstocks supplied a significant portion of the global chemical and energy needs [3], [4].
However, a study regarding to a fuel of a bioreactor. Multi criteria decision making methods (MCDM) appear as an alternative in engineering design due to its adaptability for different applications [5], [6]. The MCDM methods can be broadly divided into two categories, as (i) multi-objective decision-making (MODM) and (ii) multi-attribute decision-making (MADM). There are also several methods in each of the abovementioned categories. Priority-based, outranking, preferential ranking, distance-based and mixed methods are some of the popular MCDM methods as applied for evaluating and selecting the most suitable solution for diverse engineering applications. In most MCDM methods a certain weight is assigned to each criteria.
This paper solves the problem of selecting of a biomass fuel using recent mathematical tools and techniques for accurate ranking of the alternatives by five preference ranking- based MCDM methods, i.e. COPRAS-G, OCRA, ARAS, TOPSIS and VIKOR methods have been implemented. The criteria weighting was performed by compromised weighting method composed of AHP and Entropy methods. For these methods, a list of all the possible choices from the best to the worst suitable biofuel is obtained, taking into account different criteria.
2. Materials and Methods
2.1 Definition of the decision making problem
Biomass can be characterized by the Moisture content, Content of volatiles, Content of ashes, Elementary composi tion, Density, Energy density [7]. The elementary composition determines the heating value. Moisture content ranges between 10 and 60 % and also has a significant influence on the lower heating value (LHV). In general, it can be observed that biomass has inferior heating values compared to fossil fuels like black coal or crude oil.
The energy density with the SI-unit [J/m3] is defined with the lower heating value and the bulk density [8]. The bulk density is the space that for example wood logs or straw bales fill per kilogram. Biomass normally has a low bulk density, and together with the low heating values, its energy density is very small. As a result, the transport costs for biomass are high. It should therefore only be used in close proximity to its origin. This explains the decentralized character of energy generation from biomass: unlike fossil power plants, where high energy density fuel can be transported to central conversion plants with several megawatts up to a few gigawatts, the biomass to energy conversion takes place in small plants with power out-puts of 50 kW – 300 MW [9]. In case of electricity as secondary energy, conduction losses can be reduced. Another way is to produce secondary energy carriers like ethanol, biodiesel or second generation biofuels with higher energy density and transport them to the place of consumption.
One of the most important biomass property is considered to be the lower heating value (LHV), the highest values of which are desired in order to provide the most quantity of energy to a determine application. In addition, lower values of [%] Moisture Content (MC) would be favorable. Furthermore, higher densities (D) of the biomass can lead to a less volume of fuel. The lowest values of ash melting (AM) are necessary to eliminate the impurities. A high Ash dry and volatile components are which leads to higher conversion rates. Among these six criteria, the moisture content and ash melting, are a non-beneficial properties. Seven alternatives for the biomass fuel were taken into consideration: straw, wood, miscanthus, whole cereal, plants, cattle manure, rice husk, wheat grain. The properties of the biomass fuel alternatives are given in Table 1 and their average values were used.
3. Multi-criteria decision making Methods
3.1 Criteria weighting
The criteria weights are calculated using a compromised weighting method, where the AHP and Entropy methods, in order to take into account the subjective and objective weights of the criteria and to obtain more reasonable weight coefficients.
![Material properties for a biomass
fuel [1]-[12].](../505554799003_gf1.png)
Table 1
Material properties for a biomass fuel [1]-[12].
3.1.1 Analytic hierarchy process (AHP)
The AHP method was developed by Saaty [10] to model subjective decision-making processes based on multiple criteria in a hierarchical system. The method composes of three principles:
-
a) Structure of the model.
-
b) Comparative judgment of the alternatives and the criteria.
-
c) Assessing consistency in results.
a) Structure of the model. In order to identify the importance of every alternative in an application, each alternative has been assigned a value. The ranking is composed by three levels: 1). general objective, b). criteria for every alternative, c). alternatives to regard [10]
b) Comparative judgment of the alternatives and the criteria. The weight of criteria respect to other is set in this section. To quantify each coefficient it is required experience and knowledge of the application. Saaty [10] classified the importance parameters show in Table 2. The relative importance of two criteria is rated using a scale with the digits 1, 3, 5, 7 and 9, where 1 denotes “equally important”, 3 for “slightly more important”, 5 for “strongly more important”, 7 for “demonstrably more important” and 9 for “absolutely more important”. The values 2, 4, 6 and 8 are applied to differentiate slightly differing judgments. The comparison among n criteria is resume in matrix A (n × n), the global arrange is expressed in equation (1).
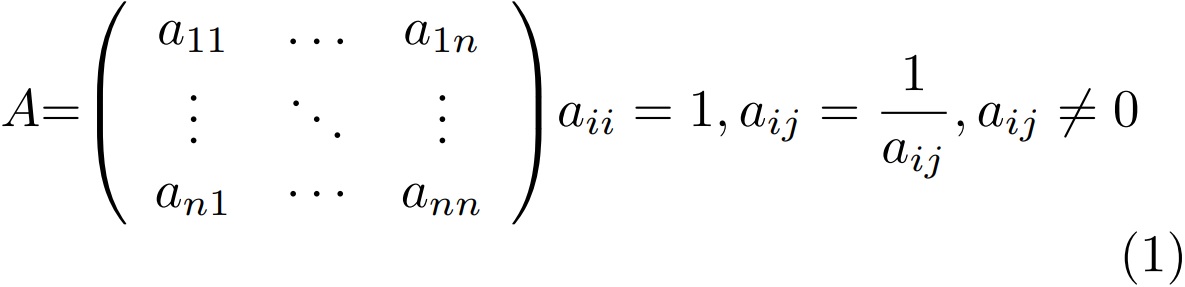
Afterwards, from matrix A it is determined the relative priority among properties. The eigenvector w is the weight importance and it corresponds with the largest eigenvector (λmax):

The consistency of the results is resumed by the pairwise comparison of alternatives. Matrix A can be ranked as 1 and λmax = n [10].
c) Consistency assessment. In order to ensure the consistency of the subjective perception and the accuracy of the results it is necessary to distinguish the importance of alternatives among them. In equations (3) and (4) is shown the consistency indexes required to validate the results.


Where
-
n: Number of selection criteria.
-
RI: Random index.
-
CI: Consistency index.
-
CR: Consistency relationship.
-
λmax(A): Largest eigenvalue.
The CR should be under 0,1 for a reliable result otherwise, the importance coefficient (1-9) has to be set again and CR recalculated (16). The RI is determined for different size matrixes, and its value is 1,32 for an 7x6 matrix.
3.1.2 Entropy method
Entropy method indicates that a broad distribution represents more uncertainty than that of a sharply peaked one [5]. Equation (5) shows the decision matrix A of multi-criteria problem with m alternatives and n criteria:

where xij (i = 1, 2, ...,m; j = 1, 2, ..., n) is the performance value of the ith alternative to the jth criteria.
The normalized decision matrix Pij is calculated (6), in order to determine the weights by the Entropy method.

The Entropy value Ej of jth criteria can be obtained as:

where k = 1 lnm is a constant that guarantees 0 ≤ Ej ≤ 1 and m is the number of alternatives. The degree of divergence (dj) of the average information contained by each criterion can be o tained from Eq. (8):

Thus, the weight of Entropy of jth criteria can be defined as:

3.2 COPRAS-G method
COPRAS-G method [11] is a MCDM method that applies gray numbers to evaluate several alternatives of an engineering application. The gray numbers are a section of the gray theory to confront insufficient or incomplete information [11]. White number, gray number and black number are the three classifications to distinguish the uncertainty level of information. The uncertainty level can be expressed by three numbers: white, gray and black. Let the number X = [x, ¯x] = {x|x x ¯x} and x ε R, where X has two real numbers, x (the lower limit of X) and ¯x (the upper limit of X) is defined as follows [11]:
-
a) White number: if x = ¯x, then X has the complete information.
-
b) Gray number: X = [x, ¯x] means insufficient and uncertain information.
-
c) Black number: if x ! 1 and ¯x ! 1, then X has no meaningful information.
The COPRAS-G method uses a stepwise ranking and evaluating procedure of the alternatives in terms of significance and utility degree. The procedure of applying COPRAS-G method is formulated by the following steps [11].
Step 1: Selection of a set of the most important criteria, describing the alternatives and develop the initial decision matrix, X.

where xij is the interval performance value of ith alternative on jth criterion. The value of xij is determined by xij (the smallest value or lower limit) and bij (the biggest value or upper limit). Step 2: Normalize the decision matrix, X using the following equations. Eq. (11) is applied for xij or lower limit values, whereas, Eq. (12) is used for bij or upper limit values.


Step 3: Calculate the weights of each criterion. Step 4: Determine the weighted normalized decision matrix, ¯X by mean of the equations (13) and (14).


Step 5: The weighted mean normalized sums are calculated for both the beneficial attributes Pi based on equation (15) and non-beneficial attributes Ri based on equation (16) for all the alternatives.


Step 6: Determine the minimum value of Ri.

Step 7: Determine the relative significances or priorities of the alternatives. The priorities of the candidate alternatives are calculated on the basis of Qi with equation (18). The greater the value of Qi, the higher is the priority of the alternative. The alternative with the highest relative significance value (Qmax) is the best choice among the feasible candidates.

Step 8: Determine the maximum relative significance value.

Step 9: Calculate the quantitative utility (Ui) for ith alternative through the equation (20). The ranking is set by the Qi.

With the increase or decrease in the value of the relative significance for an alternative, it is observed that its degree of utility also increases or decreases. These utility values of the candidate alternatives range from 0 % to 100 %. The best alternative is assigned according to the maximum value 100 %.
3.3 OCRA method
The OCRA method was developed to measure the relative performance of a set of production units, where resources are consumed to create value-added outputs. OCRA uses an intuitive method for incorporating the decision maker’s preferences about the relative importance of the criteria. The general OCRA procedure is described as below [12]:
Step 1: Compute the preference ratings with respect to the non- beneficial criteria. The aggregate performance of ith alternative with respect to all the input criteria is calculated using the following equation:

where ¯Ii is the measure of the relative performance of ith alternative and xi j is the performance score of ith alternative with respect to jth input criterion. If ith alternative is preferred to mth alternative with respect to jth criterion, then xi j < xmj. Then term max(xm j )−xi j min(xmj ) indicates the difference in performance scores for criterion j, between ith alternative and the alternative whose score for criterion j is the highest among all the alternatives considered. Step 2: Calculate the linear preference rating for the input criteria using equation (22):

Step 3: Compute the preference ratings with respect to the beneficial criteria. The aggregate performance for ith alternative on all the beneficial or output criteria is measured using the equation (23):

where h = 1, 2, . . . ,H indicates the number of beneficial attributes or output criteria and wh is calibration constant or weight importance of hth output criteria. The higher an alternative’s score for an output criterion, the higher is the preference for that alternative. It can be mentioned that Pn j=1 wj +PH h=1 wh = 1. It was considered a PH h=1 wh = 0, 00375 Step 4: Calculate the linear preference rating for the output criteria using the equation (24):

Step 5: Compute the overall preference ratings (Pi) as follows in equation (25):

The alternatives are ranked according to the values of the overall preference rating. The best alternative is determined as the one with the minimum value of Pi.
3.4 ARAS method
The ARAS method is based on utility theory and quantitative measurements. The steps of ARAS method are as follows [13]:
Step 1: Determine the normalized decision matrix, using linear normalization procedure for beneficial attributes [13]. For non-beneficial attributes, the normalization procedure follows two steps. At first, the reciprocal of each criterion with respect to all the alternatives is taken as follows:

In the second step, the normalized values are calculated as follows:

Step 2: Determine the weighted normalized decision matrix, D.
Step 3: Determine the optimality function (Si) for ith alternative by means of the equation (28):

The optimality function Si has a direct and proportional relationship with values in the decision matrix and criteria weights.
Step 4: Calculate the degree of the utility (Ui) for each alternative. The values of Ui is calculated by means of equation (29):

The utility values of each alternative range from 0 % to 100 %. The alternative with the highest Ui is the best choice among the alternatives.
3.5 TOPSIS method
The basic idea of TOPSIS is that the best decision should be made to be closest to the ideal and farthest from the non-ideal [14]. Such ideal and negative-ideal solutions are computed by considering the various alternatives.
The highest percentage corresponds to the best alternative. The TOPSIS approach is structured by the following procedure [14]:
Step 1: Normalize the decision matrix nij by is performed using the equation 30.
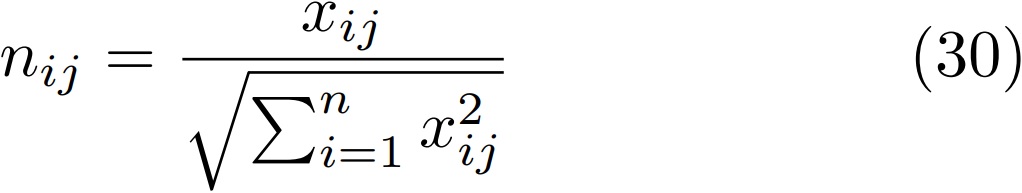
Where xij is the performance measure of jth criterion respect to ith alternative.
Step 2: Sync the weight wj and the normalized matrix nij, see equation (31).

Step 3: The ideal solutions (V +) and nadir solutions (V −) are determined using (32) and (33):


Where K and K0 are the index set of benefit criteria and the index set of cost criteria, respectively. Step 4: The distance between the ideal and nadir solution is quantified. The two Euclidean distances for each alternative are computed as given by equations (34) and (35):


Step 5: The relative closeness (Ci) is computed by equation (36).

The highest Ci coefficients correspond to the best alternatives.
3.6 SMART method
SMART is one of the simplest forms of Multi-Attribute Utility Theory (MAUT) [15]. It requires two assumptions, namely “utility independence and preferential independence”. This method conveniently converts importance weights into actual numbers. The ranking value xj of alternative Aj is obtained simply as the weighted algebraic mean of the utility values associated with it, i.e.

Besides the above simple additive model, (37) also proposed a simple method to assess weights for each of the criteria to reflect its relative importance to the decision. First, the criteria are ranked in order of importance. Then, the next-least important criterion is chosen, more points are assigned to it, and so on, to reflect their relative importance. The final weights are obtained by normalizing the sum of the points to one.
3.7 Spearman’s rank correlation coefficient
The Spearman’s rank correlation coefficient measures the relation among nonlinear datasets. Its purpose is to quantify the strength of linear relationship between two variables. If there are no repeated data values, a perfect Spearman correlation of +1 or −1 occurs when each of the variables is a perfect monotone function of the other [16]. The Spearman’s rank correlation is computed by equation (38).

Where:
-
Rs: Spearman’s rank coefficient
-
di: Difference between ranks of each case
-
n: Number of pairs of values
4. Results
After the determination of the weights of different criteria using the AHP and Entropy methods, these weights were applied to the MCDM methods. The results has been established with COPRAS-G, OCRA, ARAS, TOPSIS and SMART methods. The results have been compared by means of Spearman’s rank correlation coefficient in order to determine their convergence and sensibility and ranked the best solutions.
4.1 Criteria weighting
The comparison among properties of every alternative are in Table 1. The properties identification appears under the name of each property as (LHV), (MC), (D), (AM), (AD) and (VD). The weight of each alternative was established with AHP and Entropy methods.
The criteria weighting was firstly implemented by the AHP method to obtain the subjective weights of different evaluation criteria. In Table 2 is can be showed the scale of relative importance used in the AHP method.

Table 2
Scale of relative importance.
In Table 3 and Table 4 is illustrated the decision matrix generated for a biomass fuel, which take into account the importance of each criteria. The most important criteria to generate the matrix was considered (LHV); slightly more important were taken (MC), and (D); strongly more important was considered (AM) and (AD); demonstrably more important were taken (VD). The results are consistent due to the value of the consistency index (CI = 0, 023) and the consistency ratio (CR = 0, 018) which are lower than the limit 0, 1. At the final step, the compromised weights of the criteria (wj) were calculated using the Eq. (1). In Table 5, the weight coefficient of every criterion was determined based in results of AHP and Entropy methods. On one hand, the most representative values are (LHV) 61, 3. On the other hand, less than 39 % of the overall weight is distributed in (MC), (D), (AM), (AD) and (VD).

Table 3
Comparison among criteria for AHP Method.

Table 4
Normalized decision matrix Pij for entropy method.

Table 5
Criteria weighting by the AHP ( Bj) and balanced scales entropy ( aj ), methods and compromised weighting (wj) methods.
4.2 COPRAS-G
The related decision matrix is first performed from the gray numbers applied in COPRAS-G is illustrated in Table 6. Equations 15 and 16 allow to develop decision matrix with the weighted normalized, as is given in Table 7. Later, the normalized matrix and the weight are compared by means of equations 18 and 19. Table 8 exhibits the priority values (Qi) and quantitative utility (Ui) values for the candidate alternatives for a biomass fuel, as calculated using equations (18) and (20) respectively. Table 8 also shows the ranking of the alternative fuels as 7-5-3-6-1-4-2. Wheat grain and cattle mature, obtain the first and second ranks respectively, in contrast wood has the worst choice.
4.3 OCRA
Firstly, the aggregate performance of each alternative with respect to all the input criteria is calculated with equation (21). Applying equation (23), the aggregate performance of the alternatives on all the beneficial or output criteria are then determined and subsequently, the linear preference ratings for the output criteria are calculated. Finally, the overall preference rating for each alternative fuel is determined using equation (25). The detailed computations of this method for a biomass fuel are presented in Table 9. In this method, the ranking fuel alternatives is obtained as 6-1-7-4-3-5-2, which suggests that Rice Husk attains the top rank. Straw is the second best choice and wood has the last rank. In this method, the ranking fuel alternatives is obtained as 6-7-1-3-4-5-2. For this method it is revealed which the best alternative is rice husk and wheat grain is the second best solution as a fuel. In contrast wood has the last rank and cattle manure is the second last rank.
4.4 ARAS
Weighted normalized decision matrix for ARAS method, as given in Table 10, and using equations (28) the optimality function for each of the fuel alternative is calculated. Then, using the equation (29) the corresponding values of the utility degree are determined for all the alternatives.

Table 6
Decision matrix of COPRAS-G method.

Table 7
Normalized matrix made of gray numbers.
the ranking achieved by the biomass fuel alternatives are illustrated in Table 11. In this method, the ranking fuel alternatives is obtained as 6-7-1-3-4-5-2. For this method it is revealed which the best alternative is rice husk and wheat grain is the second best solution as a fuel. In contrast wood has the last rank and cattle manure is the second last rank.

Table 8
Pi, Ri, Qi and Ui values.

Table 9
Computation details for OCRA method.

Table 10
Weighted normalized decision matrix for ARAS method.

Table 11
Si, Ui and Rank values in ARAS method.
4.5 TOPSIS
The decision matrix given in Table 1 was normalized using equation (31) for the application of the TOPSIS method and this was multiplied by the compromised weights obtained. In Table 12 is shown the weighted and normalized decision matrix Vij for the alternatives for a biomass fuel. The ideal and nadir ideal solutions, determined by equations (32) and (33), are presented in Table 13. The distances from the ideal (S+ i) and nadir ideal solutions (S− i) and the relative closeness to the ideal solution (Ci) are measured using equations (34)–(36). The biomass fuel alternatives could be ranked by the relative degree of approximation and the ranking is shown in Table 14. The ranking of the fuel alternatives are 7-1-5-4-3-6-2. For TOPSIS method wheat grain obtain the first rank for the biomass fuel. In contrast, wood has the last rank.

Table 12
Weighted and normalized decision matrix, Vij of TOPSIS.

Table 13
The ideal and nadir ideal solutions of TOPSIS method.

Table 14
Computation details for TOPSIS method.
4.6 SMART
The computational details, result and ranking of the SMART method are presented in in Table 15. The biomass fuel with the highest result was given the best rank. The ranking of alternatives by the SMART method was 6-7-5-1-2-3-4 which indicates that rice husk and wheat grain obtain the first and second ranks biomass fuel. On the other hand, whole cereal has the last rank and miscantus is the second last rank.

Table 15
Computation details for SMART method.
4.7 Spearman’s correlation coefficients
In Table 16 is shown the Spearman’s correlation coefficients for biomass fuel. These represent the mutual correspondence among MCDM methods. The magnitude of this parameter for a PCM exceeds 0, 554 for the relation of OCRA, ARAS, TOPSIS and SMART methods. Moreover, the correlation have a value of 0, 839 between OCRA and TOPSIS methods.

Table 16
Spearman’s correlation indexes
5. Discussion
The MCDM are an important tool to recognize and identify the best alternative in a bunch of several of them. These methods can adapt to different sort biomass fuel that would affect the final result and that is why these approaches are applied in different areas of science, engineering and management. In this case, we take advantage of MCDM in order know the best alternative for biomass fuel. In Fig. 1 is resumed the overall rank of each MCDM method for the different alternatives. It has been observed than COPRAS-G and TOPSIS methods the best biomass fuel alternative and the second best option for OCRA, ARAS and SMART is white grain because it has a good LHV and low moisture content. In case of OCRA, ARAS and SMART methods the best alternative correspond with rice husk. In addition, wood are presented on the last rank alternatives for four of the five MCDMs for its high moisture content. The method validation was correlated by Spearman’s coefficients.

Figure 1
Rank materials vs. alternative materials for a biomass fuel.
6. Conclusions
In this paper the selection problem for a biomass fuel has been solved utilizing a decision model. The model includes the COPRAS-G, OCRA, ARAS, TOPSIS and SMART methods. Ranking scores which were used to rank the alternative biomass fuel were obtained as results of the methods. The weighting of the fuel properties was performed using the compromised weighting method wj composes of the AHP and Entropy methods. According to the results of the best alternative COPRAS-G and TOPSIS methods and the second best option for OCRA, ARAS and SMART, white grain appear has the best choice for a biomass fuel. It was validated that the MCDM approach is a viable tool in solving the complex decision problems. Spearman’s rank correlation coefficient was found to be very useful in assessment of the correlation between three ranking methods. The model which was developed for the decision of a biomass fuel can be applied on other selection problems.
References
[1] R. Zamora-Cristales, J. Sessions, D. Smith, and G. Marrs, “Effect of grinder configuration on forest biomass bulk density, particle size distribution and fuel consumption,” Biomass and Bioenergy, vol. 81, pp. 44 – 54, 2015.
[2] Z. Liu and G. Han, “Production of solid fuel biochar from waste biomass by low temperature pyrolysis,” Fuel, vol. 158, pp. 159 – 165, 2015.
[3] J. Jia, A. Abudula, L. Wei, B. Sun, and Y. Shi, “Thermodynamic modeling of an integrated biomass gasification and solid oxide fuel cell system,” Renewable Energy, vol. 81, pp. 400 – 410, 2015.
[4] S. D. Stefanidis, E. Heracleous, D. T. Patiaka, K. G. Kalogiannis, C. M. Michailof, and A. A. Lappas, “Optimization of bio-oil yields by demineralization of low quality biomass,” Biomass and Bioenergy, vol. 83, pp. 105 – 115, 2015.
[5] Z. Zhi-hong, Y. Yi, and S. Jing-nan, “Entropy method for determination of weight of evaluating indicators in fuzzy synthetic evaluation for water quality assessment,” Journal of Environmental Sciences, vol. 18, no. 5, pp. 1020 – 1023, 2006.
[6] P. C. Munasinghe and S. K. Khanal, “Biomassderived syngas fermentation into biofuels: Opportunities Opportunities and challenges,” Bioresource Technology, vol. 101, no. 13, pp. 5013 – 5022, 2010, special Issue on Lignocellulosic Bioethanol: Current Status and Perspectives.
[7] R. Warnecke, “Gasification of biomass: comparison of fixed bed and fluidized bed gasifier,” Biomass and Bioenergy, vol. 18, no. 6, pp. 489 – 497, 2000.
[8] H. Kitzler, C. Pfeifer, and H. Hofbauer, “Pressurized gasification of woody biomass – variation of parameter,” Fuel Processing Technology, vol. 92, no. 5, pp. 908 – 914, 2011.
[9] S. Tuomi, N. Kaisalo, P. Simell, and E. Kurkela, “Effect of pressure on tar decomposition activity of different bed materials in biomass gasification conditions,” Fuel, vol. 158, pp. 293 – 305, 2015.
[10] T. L. Saaty, The Analytic Hierarchy Process. New York: McGraw Hill International, 1980.
[11] P. Chatterjee, V. M. Athawale, and S. Chakraborty, “Materials selection using complex proportional assessment and evaluation of mixed data methods,” Materials & Design, vol. 32, no. 2, pp. 851 – 860, 2011.
[12] C. Parkan and M.-L. Wu, “Measurement of the performance of an investment bank using the operational competitiveness rating procedure,” Omega, vol. 27, no. 2, pp. 201 – 217, 1999.
[13] E. K. Zavadskas and Z. Turskis, “A new additive ratio assessment (ARAS) method in multicriteria decision-making,” Technological and Economic Development of Economy, vol. 16, no. 2, pp. 159– 172, 2010.
[14] P. Chatterjee and S. Chakraborty, “Material selection using preferential ranking methods,” Materials & Design, vol. 35, pp. 384–393, 2012.
[15] P. Chatterjee, V. M. Athawale, and S. Chakraborty, “Materials selection using complex proportional assessment and evaluation of mixed data methods,” Materials & Design, vol. 32, no. 2, pp. 851–860, 2011.
[16] M. A. Mustafa and T. C. Ryan, “Decision support for bid evaluation,” International Journal of Project Management, vol. 8, no. 4, pp. 230 – 235, 1990.