Resumen: La contaminación en poblaciones densas como la Zona Metropolitana de Guadalajara crece exponencialmente, afectando la salud de los ciudadanos y reduciendo su Calidad de Vida. Uno de los principales retos de investigación que se persiguen con el estudio de las Smart Cities es la contaminación ambiental para mejorar el bienestar de los ciudadanos y proteger los espacios naturales. Por lo tanto, es urgente el desarrollo de Tecnologías de la Información para reducir este problema mediante el análisis científico de datos, para clasificar las zonas con mayor contaminación. Actualmente, estos datos son capturados por estaciones de monitoreo constante, generando un gran volumen de información que representa un desafío para el proceso de clasificación. Este trabajo propone un modelo UML (Lenguaje Unificado de Modelado) para la ejecución automática de un algoritmo de clasificación utilizando Máquinas de Vectores de Soporte con la implementación de librerías en python para procesamiento paralelo. Como resultado de esta investigación, se desarrolló un modelo UML para identificar patrones de contaminación en Ciudades Inteligentes, por ejemplo, la Zona Metropolitana de Guadalajara.
Palabras clave: Minería de Datos, UML, Máquinas de Vectores de Soporte, Librerías en paralelo de Máquinas de Vectores de Soporte, Internet de las Cosas, Ciudades Inteligentes.
Abstract: Pollution in dense populations such as the Metropolitan Zone of Guadalajara grows exponentially, affecting the health of citizens and reducing their Quality of Life. One of the main research challenges pursued with the study of Smart Cities is environmental pollution to improve the well-being of citizens and to protect natural areas. Therefore, it is urgent the development of Information Technology to reduce this problem by the scientific analysis of data, to classify the zones with greater contamination. Currently, these data are captured by constant monitoring stations, generating a large volume of information representing a challenge for the classification process. This work proposes a Unified Modeling Language (UML) model for the automatic execution of a classification algorithm using Support Vector Machine implementing libraries in python for parallel processing. As a result of this research, a UML model to identify patterns of pollution in Smart Cities, for example, the Metropolitan Zone of Guadalajara.
Keywords: Data Mining, UML, Support Vector Machines, Parallel Support Vector Machine Libraries, Internet of Things, Smart Cities.
Computación e Informática
UML to model pollution patterns of the Smart Cities for Metropolitan Zone of Guadalajara
UML para modelar patrones de contaminación de las Ciudades Inteligentes para la Zona Metropolitana de Guadalajara
Universidad de Guadalajara
Recepción: 17 Agosto 2020
Aprobación: 08 Febrero 2021
With the emergence of the concept of Smart Cities, importance is given to the Quality of Life of citizens, promoting the paradigm of the use of Information Technology (IT) for environmental monitoring, scientific analysis, and with-it pollution conditions in urban areas. Guadalajara has an atmospheric monitoring system, and the information has been stored for 20 years. The stored contamination variables vary in the files, and in some cases, the data are missing or out of range. In addition, there is no automatic data analysis model that allows continuing the relocation of monitoring devices for the city in constant urban growth. Data Mining has provided techniques that are useful for the development of solutions, appropriate for the processing of information volumes with an exponential tendency, generating the Big Data phenomenon, such as Support Vector Machine (SVM) techniques used for classification.
The objective of this research is to propose a UML model by the design of an SVM parallelized algorithm with the cloud importing python libraries for the automatic classification of the elements of contamination data that yield the areas with the highest pollution index thus obtaining the position of the installation of new environmental sensors to install. The research of a UML method was carried out through the study of air quality models, the Internet of Things (IoT), and mining techniques. This article is part of a project where at this stage only the UML model is presented, which serves as the basis for the future execution of the proposed algorithms.
The organization of the paper is as follows. Section 2 presents an outline of the UML model. Section 3 gives an overview of the Smart Cities concepts and Quality of Life, pollution in big cities, the Mundial variables of quality of the environment and how is the monitoring environment of Smart Cities. Section 4 describes the problem of identifying pollution patrons in georeferenced maps, the static monitoring stations, the need for the identification of the best location of sensors for dynamic monitoring, also it is shown the challenges to managing the Big Data to analyze pollution variables. Section 5 presents the methodology and explains the implementation in detail of the UML model proposed. Also, it is presented data analysis techniques to identify patrons, SVM, parallelization with Python libraries to import, and the data variables to the UML Model. Finally, the parallel-proposed UML model. In Section 7, the conclusions.
Xinping et al. [1], proposed a Unified Modeling Language (UML) model to model the technology of virtual assembly systems to ensure the validity of the model system proposed. The model building of state diagram, use case diagram, sequence diagram, and deployment diagram is completed on the system, providing evaluation criteria and uncertain factors not only can be fully described by the system modeling method but also the effective solution for the control system can be acquired. They proposed a UML model to model virtual assembly technology that reduces operating costs to provide solutions to the problems of product assembly.
The University of Quebec [2], presented a model-driven development method that automatically generates detailed UML domain models from business process models expressed in the Business Process Model and Notation (BPMN). Their approach was based on business patterns consisting of three transformations: 1) extraction of the process value chain, 2) construction of the UML domain models, 3) elaboration of the UML models. They tested their approach on a set of business processes from the Enterprise Resource Planning literature. The results showed computational feasibility and the conceptual soundness of the approach.
Hongjie [3], proposed a model of a P2P file shared system based on UML. The P2P model has the function of finding and locating servers. The system adopted the centralized peer-to- peer network structure, with the central server initializing the work of mutual communication, category searching, and management services between the two end-users. The UML design stage consisted of a static model designed with a class diagram and a dynamic model designed in phase diagram and sequence diagram. The UML class diagram described the static relations among different classes as the structure of the information and the behavior of the system.
Martinez et al. [4], promoted the use of UML for modeling the extraction process of Big Data specifically. This work is an approach for modeling the Extract Transform Load (ETL) process in a data warehouse, for depicting the data conversion and the loader process involved in the extracted task. The use of UML was at a conceptual level modeled on five new stereotypes with UML diagrams. The benefits that UML diagrams brought to this system were the flexibility of replacing or modifying any unit according to the designer's requirements.
Besnard et al. [5], presented a UML model implementation by verifying and executing a robot soccer player of the MDETools’19 challenge problem with Embedded/Experimental Model Interpreter (EMI). EMI is a model interpreter that can be used to execute, simulate, and formally verify UML models on the host or embedded targets. This approach is integrated into
(i) designing a UML model for the challenge problem, (ii) applying formal verification using model-checking on the design model, and (iii) executing this model to participate in the challenge.
Guerriero et al. [6], proposed the use of the UML model to model developing streaming applications. They presented StreamGem App, a model-driven tool aiming at simplifying the development of distributed streaming applications. The UML model allowed to model streaming-specific concepts through UML Class Diagrams and a model-to-text transformation to automatically generate the application code starting from the UML models.
Bagherzadeh et al. [7], presented a tool that supports live modeling of UML for Real-Time (UML-RT) that is a language for the modeling of soft real-time systems. They developed a conceptual framework for live modeling in the context of model execution by code generation that is independent of live programming services.
Besnard et al. [8], developed a Model-Driven Reverse Engineering (MDRE) framework named Source to Model Framework (Src2MoF). This framework was developed to generate UML structural (class) and behavioral (activity) diagrams from the Java source code. In this project, the UML model was a central part of the design phase to verify the design of the system early in the development process.
Huixia and Ke [9], proposed a modeling method of fault diagnostic system software based on UML for the standard IEEE1232 which is also named AI-ESTATE. The AI-ESTATE services are portability of diagnostic knowledge and enable the consistent exchange and integration of diagnostic capability. This work analyzed the function of AI-ESTATE reasoner services in a fault diagnostic system software. The UML class diagrams, and sequence diagrams of the fault diagnostic system management services are set up. A modeling method for AI-ESTATE diagnostic services with UML is better to embody the AI-ESTATE architecture and construct the foundation for implementation of a fault diagnostic software system.
Tudoroiu et al. [10], presented a proposal of an intelligent neural-fuzzy modeling strategy based on UML diagrams and Petri nets models of the pollution sources impact on the air quality along the Romanian coast of the Black Sea, especially in the Constanta vicinity. They monitor the physical and chemical parameters of air quality, such as temperature, wind speed, Carbon Dioxide (CO2), methane (CH4), Nitrogen Oxide, ozone, water vapors concentrations. This work is focused on determining the possibility of applying Fuzzy UML and Petri Nets architectures for simulation and prediction of the performance of air quality of the Constanta Black Sea resort city environment.
In general, the presented works implement the UML model to modeling systems proposal and the validation of the prototypes. But in other areas as a UML model to model the technology of virtual assembly systems, UML domain models from business process models, a P2P file shared system based on UML, UML for modeling the extraction process of Big Data, a UML model implementation by verifying and executing a robot soccer player, a UML model to model developing streaming applications, a tool that supports live modeling of UML for Real-Time, a Model-Driven Reverse Engineering framework, a modeling method of fault diagnostic system software based on UML, and an intelligent neural-fuzzy modeling strategy based on UML diagrams and Petri nets models of the pollution sources impact on the air quality. Our proposal is focused on a UML model by the design of an SVM parallelized algorithm with the cloud importing of Python libraries for the automatic classification of the elements of contamination data that yield the areas with the highest pollution index according to an established variable and thus obtain the position of the installation of new environmental sensors to install.
Townsend [11], refers to a Smart City "Smart Cities" as one that solves problems by monitoring events and resources using sensors installed throughout the city. Generating, in this activity, large volumes of data, which when subjected to their analysis it is possible to observe patterns that allow visualizing alternative solutions. Smart Cities assume the challenge of generating strategies to solve problems of sustainability and Quality of Life, through IT.
In a press release [12] of 2015, the Organization for Economic Co-operation and Development (OECD) and the National Institute of Statistics and Geography (INEGI) published a report on the most relevant indicators that influence the well-being of Mexicans Quality of Life. These were grouped into 12 dimensions, one of them being the environment. One of the challenges of environmental monitoring is to guarantee the Quality of Life of citizens. Air pollution records for the year 2012, in cities and rural areas, has caused 3 million premature deaths each year throughout the year, due to exposure to small particles of 10 microns in diameter (PM10), which can lead to heart disease, cancer, and pneumonia. Most sources of air pollution are out of the control of people and require action by cities as well as national bodies in sectors such as construction, agriculture, transport, etc.
In [13] mentions the guidelines that apply worldwide and are based on expert assessment of scientific evidence concerning, Particles (PM10), ozone (O3), nitrogen dioxide (NO2), and sulfur dioxide (SO2). Particles that cause the most health damage are those with 10 microns in diameter if they are lodged inside the lungs. Measurements of air quality warn of annual concentrations of PM10 particles per cubic meter (m3) of air. O3 at ground level is one of the main components of the toxic mist. The highest ozone levels are recorded in periods of sunny weather. Nitrogen dioxide in concentrations greater than 200 mg/m3 is a toxic gas that mainly affects the airways. The principal sources of this gas are combustion processes. SO2, colorless gas with penetrating odor generated from fossil fuel combustion (coal and petroleum). In combination with water, it is transformed into sulfuric acid, being the main component of acid rain that causes deforestation.
The development of IoT: sensor development, infrastructure, communication networks, analytics, and advanced technology, allows the construction of data collection networks in cities to obtain information on air quality and subsequently raise awareness among citizens on pollution reduction, thus IoT can help to maintain better air quality for all citizens. Within a city, one of the most complicated parameters is air quality. The IoT is translated from a change from reactive systems to proactive systems and it has contributed to inserting objects into a dynamic world of Information Technology. The citizen-led Oxford Flood Network has developed a system of sensors to gather data on water levels from stream and groundwater sources and anticipate flood incidents. The system relies on sensors that use ultrasonic rangefinders, positioned above local waterways, to measure changes in the water level and indicate flood risks [14]. Some companies use sensors to determine when a car is parked in each spot. This data can be sent directly to drivers, helping to guide them more quickly to an available location. The companies can use the data to adjust pricing based on demand [14].
Towards the challenges of urbanization, the technology offers a solution to optimize processes and services in the cities in what is called the implantation of an Intelligent City. Sensor networks, data repositories, and data analysis are current processes that must be managed as part of the city's intelligent infrastructure, where complexity, resilience, and interoperability are important issues to consider. The information of all processes in a city must be connected through a sensor network to communicate and manage the control and optimization of the water supply. For example, if a house breaks and there is not a sufficient water supply, it is necessary to restore the service as soon as possible. In doing so, it should be known how much water should be allocated to water a garden in a portion of the city, which areas need to be watered first among other things [15]. One of the most important challenges is to ensure the good quality of the air; in this respect, the data obtained through a network of sensors begin to play an important role in measuring and managing air quality. By installing a citywide data collection network, cities can implement smart actions after data analysis to help ensure cleaner air for all [16]. IoT signaling and sending data to each other consume a loT of power and CPU. As mentioned in [17], methods for monitoring air pollution made use of complex, expensive, and fixed equipment in one place. This leads to limitations on IT collecting data and access to data. This process is changing with the use of IoT, using low-cost sensors, easy to install, and obtaining data in real-time. This provides valuable tools to perform data analysis, providing air quality monitoring information to citizens. In [18] proposed to locate or relocate sensors through hot zones that are a perimeter with significant data related to the observed phenomenon. These works propound the installation of alternatively fixed sensors determined by the objects of study in contrast to our proposal with a different approach where the most appropriate location is not known, or the translocation of the sensors determined by the UML model applying SVM algorithms.
This work identified three problems in the identification of pollution patrons in georeferenced maps as the identification of the best locations of sensors, the management of Big Data to analyze pollution variables, and the identification of patrons of behavior in georeferenced maps through data years.
The Metropolitan Zone of Guadalajara (MZG) is formed by eight municipalities of the Jalisco state as Guadalajara, Zapopan, San Pedro Tlaquepaque, Tlajomulco de Zuñiga, Tonalá, El Salto, Ixtlahuacán de Los Membrillos, and Juanacatlán [19]. With a total of territorial superficies 2,384.66 Km2 and a total population of 4,796,603 estimations of the 2015 year from INEGI. MZG continuously registers periods of unhealthy levels of air quality [20]. In the MZG exist eight static monitoring stations located in Las Águilas, Atemajac, Centro, Loma Dorada, Miravalle, Oblatos, Tlaquepaque, and Vallarta. Integrating the Automatic Network of Atmospheric Monitoring of the MZG of the state government of Jalisco. These monitoring stations determine the zones of greatest pollution with measurements every 10 minutes 24 hours a day, and 365 days a year [21] with static monitoring stations. But the MZG has a constant increase in pollutants, therefore, predominant the identification of zones with a greater increase in pollution. By identifying the causes of pollution more accurately better actions could be taken to reduce the agents of contamination consequently the Quality of Life.
Currently, there is no classification of the most heavily polluted areas of MZG, and the geographic direction of the impact of pollution is unknown. Likewise, few Information Technology tools collaborate in the analysis of information to support the classification of territorial areas with greater pollution. For this reason, it is required the proposed UML model by the design of an SVM parallelized algorithm with the cloud importing Python libraries. This implementation of Data Mining techniques allows the management of large volumes of records for georeferenced analysis by which environmental behavior patterns are identified in the MZG. With this analysis, it is possible to identify the coordinates of greater risk of contamination to establish a georeferenced map of the location of sensors, thus achieving a better targeting of the factors that generate pollution. So far, the monitoring stations are not enough to make a thorough evaluation of the phenomenon. The correct location of the sensors has been an obstacle to starting the projects of installation of the infrastructure of IoT for the environment level at MZG. The sensors should not be fixed due to the constant changes of a city, for example, increased traffic, urbanization, etc.
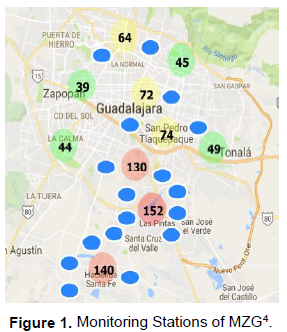
For this reason, it is foreseen to require the analysis of the data of the same sensors installed providing their new relocation, operating based on the coordinates suggested by the patterns identified by the sensors themselves. The idea with the UML model presented is that in the areas with the greatest contamination the location of new sensors is determined. This would imply locating more sensors to determine with greater precision factors that generate contamination. Figure 1 presents an example of the usefulness of the proposed UML model and the results of the application, the Monitoring Stations of MZG are represented by green, yellow, and red circles, representing the location of the current quality monitoring sensors. The color of the circles is determined by the quality of the air, green circles represent satisfactory levels of air quality, yellow circles represent a warning, and red circles represent poor air quality. In the red circles, there is a lower quality of the air near them; when a low-quality variation in the air is detected, the location of new sensors will be installed and represented by blue circles to identify with more precision the factors that produce pollution, and these new locations will be calculated by the UML proposed model.
The management and analysis of large amounts of information present several challenges such as data cleaning. The data obtained by the monitoring stations show heterogeneity, making the standardization process difficult to analyze. The data were obtained from the Jalisco Atmospheric Monitoring System (SIMAJ). This data represents around 20 years of monitoring from 1996 to 2015, starting with 8 monitoring stations and in the 2012 year, 2 additional stations were added. The records presented were from every hour for each station. The challenges of information integration are mainly data cleansing, like the loss or absence of information, out of range, blanks, text instead of numbers. Another problem of the data is that there does not exist a homogeneous format of the acquisition and the storage of the information, in this way increasing the challenge of integrating the information. Until 2011, the data from all stations were presented in an Excel file.
Subsequently, the data was generated in an Excel file for the monitoring of each station. This means contemplating various processing designs with a variety of formats. As an example, some records do not have the same 24-hour format.
Another difference presented was different variables have been handled per monitoring station. The World Health Organization (WHO) proposed an environmental quality model. The model defines which variables should be measured and in which ranges air quality should be measured. On the other hand, the data do not have standardized variables nor the number of variables, this complicates further the cleaning of the data.
Literature concerning the pollution problem of the city of Guadalajara, national, and international models of air quality were initially reviewed. Likewise, the official SIMAJ Web site was visited to study the atmospheric monitoring system currently used for the application of contingency plans, which includes the infrastructure for daily operation and data management. This led to the verification of their files that are available and open at the site already mentioned above, totaling 878,988 records. In the future, it is expected an increased emission of catches multiplying the files by the proliferation of sensors. Therefore, more sensors and more files will be generated.
Literature concerning the pollution problem of the city of Guadalajara, national, and international models of air quality were initially reviewed. Likewise, the official SIMAJ Web site was visited to study the atmospheric monitoring system currently used for the application of contingency plans, which includes the infrastructure for daily operation and data management. This led to the verification of their files that are available and open at the site already mentioned above, totaling 878,988 records. In the future, it is expected an increased emission of catches multiplying the files by the proliferation of sensors. Therefore, more sensors and more files will be generated.
4 Source: http://siga.jalisco.gob.mx/aire/
Then, classification strategies were investigated for high and low volumes of data, specifically dedicated to the delimitation of georeferenced borders to be able to discover zones of atmospheric contingency. This led to the selection and study of SVM for its benefits in solving these problems from its parallel approach, which takes advantage of using the python language and its NumPy, SciPy, Mpi4py, and Sklearn.SVM libraries combined with associated technology such as NVIDIA Graphics Processing Unit (GPU) microprocessors and INTEL as an operating platform.
Some references for the modeling specification of infrastructures specifically for the location of IoT sensors in geographic territories were scrutinized. The objective of this research is to generate a proposal through the design of a UML model for the automatic and dynamic relocation of constant monitoring sensors, using the results of patterns found by the design of an SVM algorithm, and in turn analyze the data coming from the stations (or previous sensors), to improve the atmospheric monitoring schemes for impact on the form of prevention to the citizen and on the detection of contingencies that force the changes of policies that regulate habits of not contaminate and care for the environment.
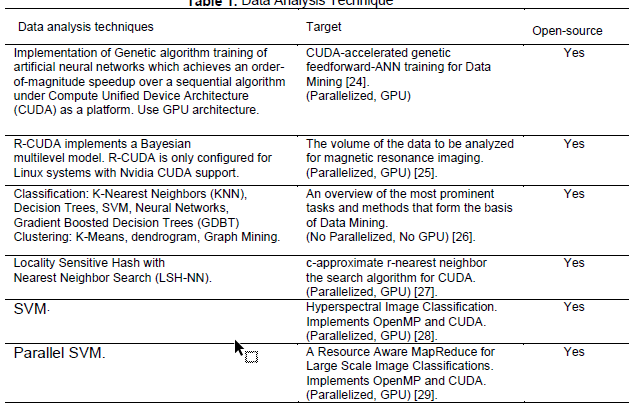
In principle, Data Mining is a process of pattern discovery [22]. This premise was raised in this way because of its analogy with mining since a series of stages are carried out to achieve the economic exploitation of minerals such as extraction, smelting, processing, refinement, and transport. Mainly, the handling of large volumes of geological material to be revised. This need also appears in data analysis, where filtering or cleaning, sorting, and presentation of the data becomes more vital, and is better known as Extraction, Transform, and Load (ETL). The IoT boom has accelerated research on the analysis of high volumes of information caused by the high speed of information capture by the monitoring sensors, a factor that has influenced the appearance of the term Big Data [23]. Different studies have been proposed to solve problems concerning these topics, in Table 1. Data Analysis Techniques are presented. Several of the techniques are parallelized and implemented by GPU, the GPU technology is required to speed up the operation of applications, and it is an open-source architecture. The parallel SVM algorithm was recommended in this model as the analysis technique. It reduces the training time significantly compared with the Sequential Minimal Optimization (SMO) algorithm while maintaining a high level of accuracy in classifications [29]. Godoy [30] presented a literature review of scientific journals published in the years 2010 and 2011, with the aim of identifying the main machine learning techniques utilized for text mining. The main technique used by the studied author was SVM with 22.72% of incidents. SVM is a method that achieves high degrees of correct classification in various types of applications.
SVM is a set of algorithms of supervised learning models with associated learning that analyze data used for classification and regression analysis. Development by Vladimir Vapnik and his work team in the AT&T Laboratory in 1979 [31]. The SVM algorithm consists of two phases: training and test. In the training phase, the data are used to build a math model to classify. A set of training data is used consisting of pairs; one represents the correct inputs and the other the correct outputs. In this way, the system learns the correct output mapping for each input pattern presented [30]. In the test phase, the math model is used to predict a new class and classify points [32]. SVM techniques are applied in diverse tasks of classification such as image recognition, bioinformatics, and text processing [33].
SVM also gives good generalization performance of problems such as handwritten character recognition, face detection, pedestrian detection, and text categorization [34].
Python is recommended as a programming language in the UML proposed model since it is supported by an extremely large variety of packages. Besides being an open-source language, Python includes an Integrated Development Environment (IDE) that allows fast prototyping and profiling projects [35] for the source code editor. Python provides build automation tools and a debugger. Another technology recommended in the UML model is the implementation of Python parallelism through CUDA technology. CUDA is a parallel computing platform and programming model that enables dramatic increases in computing performance by harnessing the power of GPU to deliver the benefits of GPU acceleration. CUDA Python implements the NumbaPro Python compiler that integrates the Anaconda Accelerate package. The benefits of these technologies are the speed of a compiled language targeting CPU and GPU [36].
The UML model also integrates some libraries that ease in python the analysis of data. The libraries are NumbaPro, NumPy, SciPy, Mpi4py, and Sklearn.SVM. Python as an interpreted language is considered too slow for high-performance computing, but with the NumbaPro library, the performance has increased for data analytics; moreover, CUDA Python implements the NumbaPro because the Python compiler is part of the Anaconda Accelerate package that brings rapid interactive development and the speed of a compiled language
[37] [35]. NumPy is the fundamental package for scientific computing in Python. This library provides an N-dimensional array object, and an assortment of routines for fast operations on arrays, including mathematical, logical, shape manipulations, sorting, selection, input/output data, discrete Fourier transforms, basic linear algebra, basic statistical operations, random simulation [38]. SciPy library is a fundamental library for scientific computing, it provides user-friendly and efficient numerical routines such as routines for numerical integration and optimization [39]. The Mpi4py library supports communication and provides Python bindings for the Message Passing Interface [40]. The Sklearn.SVM library includes the GridSearchCV object to parallelize jobs and finds the best kernel function that approaches the hyperplane that classifies the data.
The files produced by the monitoring stations had several variables of contamination but for this study, there were some relevant variables such as ID, DATE, TIME, PM10, LATITUDE, LONGITUDE, and STATION. These variables are the entry to the SVM to classify the data in a range of contamination and determine the zones with higher contamination.
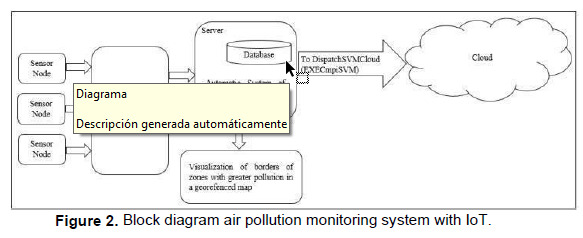
As a result of the analysis of the problem, a model is proposed to implement an automated system that carries out the activities of data analysis through SVM to identify the areas that require the placement of new sensors for better territorial monitoring. The model is described by the architectural, behavioral, and deployment view through UML class diagrams and activity diagrams. Figure 2 Block diagram air pollution monitoring system with IoT shows the deployment view of the automated system of air pollution monitoring using the IoT. In conjunction with the detection of data in the current stations, integrating an open architecture with heterogeneous devices constitutes a modular system. In the monitoring stations, there will be a network of sensors will be integrated with a microcontroller under an embedded software platform, the sensors capture the quality of the air produced in real- time, the data in continuous sensing are obtained by the microcontroller and sent to the server where there would be a database that would store the collected data. In this UML model, the first action is the control of data cleaning, then the data analysis with vector machines and the derivation of processes in parallel to the working modes of the cloud; finally, the UML model returns the best kernel function (radial basis or polynomial function).
To automate the process of data analysis of the environment, it was observed that a data analysis algorithm for Smart Cities metrics operates as a domain coupled to an information context or workspace and processes in the form of elements of control, which are: configuration for storage, filtering (or cleaning) and form of data extraction, the configuration of SVM environment variables for their cloud parallelization and visualization. See figure 3, the class diagram that describes the architecture of the proposed model to Smart Cities automated system for analysis of environmental data.
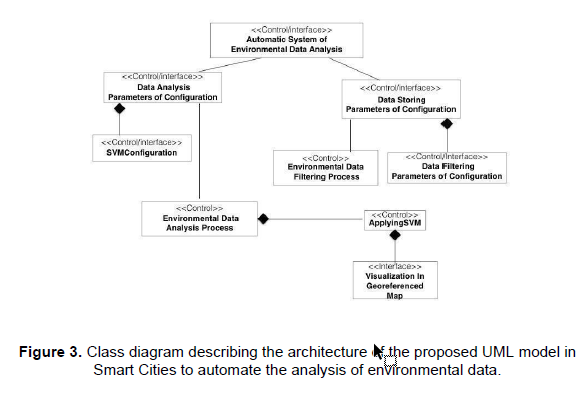
In this class diagram, it is presented the labeled elements <<Control/Interface>>. The
<<Control/Interface>> indicates that the methods of the class are dedicated to the capture of configuration variables from a Graphical User Interface to its storage control. The Interface class only displays the results of the analysis, the control class is used to trigger internal process methods when it is called. The Automatic System class of Environmental Data Analysis is the main class, it displays a menu that contains two options:
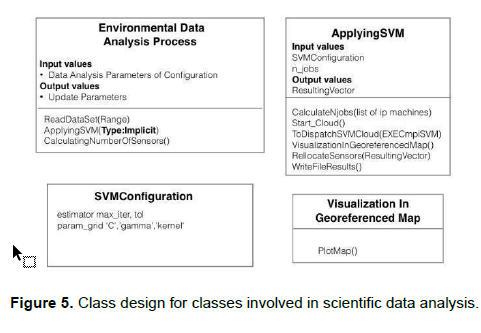
A) Updating the data analysis parameters of the environment or Data Analysis Parameters of Configuration class. The class consists of attributes that define the variables for the determination of ranges of values for the measurement of air quality, information of sensors or machines for processing in the cloud, etc. This in turn has a composite association represented by a diamond that means a strong membership of the SVM configuration class. It has a second association with the Environmental Data Analysis Process class to trigger it according to the value of the frequency parameter, which in turn triggers ApplyingSVM which requires the list of machines available for parallel execution and calls the Visualization in class Georeferenced Map for displaying the data.
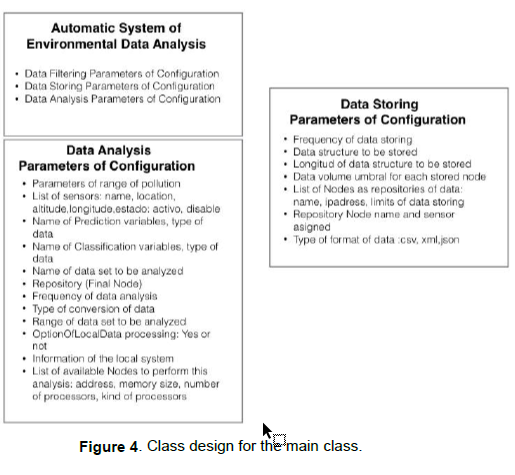
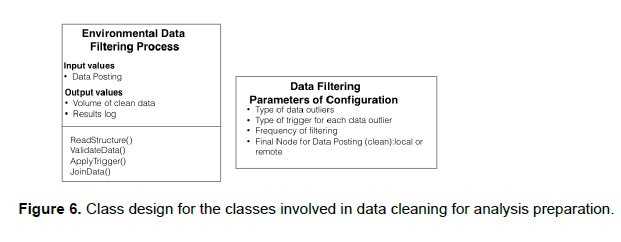
B) Updating the parameters for storage named Data Storing. Parameters of Configuration associated with the filtering and storage configuration classes. It relates to the filtering process to trigger it according to the value of the cleaning frequency parameter. The internal design for the Classes Automatic System of Environmental Data Analysis, Data Analysis Parameters of Configuration and Data Storing Parameters of Configuration are shown in figure 4 Class design for the main class, the design of the classes Environmental Data Analysis Process, SVMConfiguration, ApplyingSVM, and Visualization in Georeferenced Map. In figure 5 Class design for classes involved in scientific data analysis, figure 6 Class design for the classes involved in data cleaning for analysis prepared for the Environmental Data Classes Filtering Process and Data Filtering Parameters of Configuration.
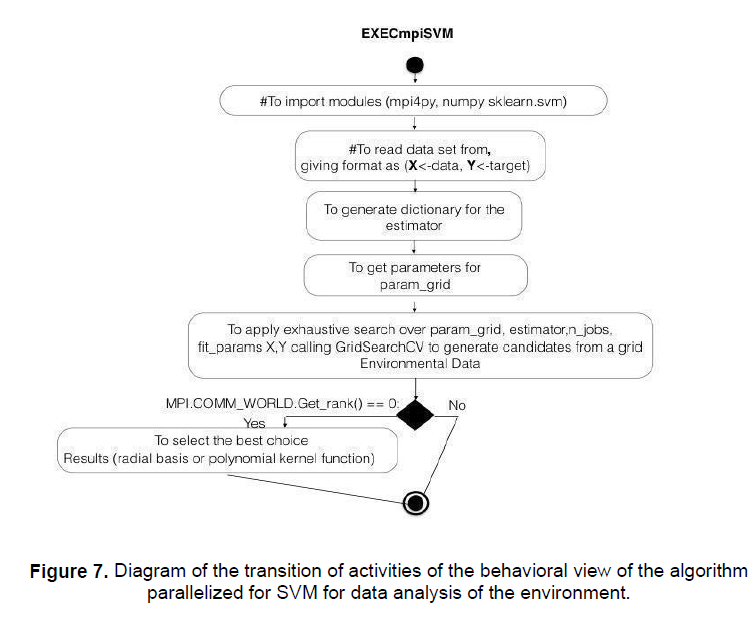
In the behavioral view, it is indispensable to show the algorithm EXECmpiSVM triggered by the ToDispatchSVMCloud method belonging to the ApplyingSVM class. figure 7 shows the Diagram of the transition of activities of the behavioral view of the algorithm parallelized for SVM for data analysis of the environment.
The design of the proposed UML model requires the Python libraries Mpi4py, Numpy, and Sklearn.SVM. In the configuration, the parameters, param_grid, and the data set of the environment data are obtained at runtime from the environment of the instantiated configuration objects explained above. The call to the GridSearchCV must be designed in parallel according to the number of concurrent jobs that must be distributed in the cloud to get the best kernel function that fits the data for the training process and the number of sensors. Process rank 0, is the principal of the concurrent process as the following instruction MPI.COMM_WORLD-Get_rank()==0 in this case, it is proposed that it be designed to collect the results of the threads (example rank==1 radial basis, rank==2 polynomial kernel function, etc.). Finally, the proposed UML model uses several functions to Support Vector Machines referring to the divided zones to locate the territorial routes of installation of the new sensors for the IoT.
In the proposed UML model, the automation of scientific analysis of environmental data, it is important to have a robust, scalable, interoperable, and modular infrastructure, therefore the Python libraries to be used for the implementation of the parallelized SVM algorithm must conform to the open paradigm source, ensuring that the algorithm must be flexible to extend parallel to several machines whenever it is desired to increase the processing capacity of the cloud, given the indeterminate increase in the volume of data generated year by year by the workstations and due to the expected technological phenomenon of IoT.
It is necessary for the data storage and cleaning protocol to exist a set of configurable classes so that the monitoring variable can be selected according to the emanation of captured contamination, as well as to specify the destination variable of the data in its state original and clean, in addition to its format since over time files evolve to improve their manipulation like csv, xml or json. It is recommended that in the training of data, import Python libraries that facilitate the parallel search implementation of the best kernel function for data classification.
