Reportes de investigación
An analysis of financial knowledge, well-being, attitude, and inclusion among university students


An analysis of financial knowledge, well-being, attitude, and inclusion among university students
IE Revista de Investigación Educativa de la REDIECH, vol. 16, e2626, 2025
Red de Investigadores Educativos Chihuahua A. C.

Esta obra está bajo una Licencia Creative Commons Atribución-NoComercial 4.0 Internacional.
Recepción: 10 Julio 2025
Aprobación: 09 Diciembre 2025
Publicación: 17 Diciembre 2025
Resumen: En este artículo evaluamos los niveles de conocimiento financiero, actitud, bienestar e inclusión entre estudiantes universitarios de pregrado en una universidad pública, pequeña y de cuatro años, catalogada como Institución al Servicio de la Población Hispana (Hispanic Serving Institution - HSI) en la zona rural de Nuevo México. Utilizamos una encuesta basada en prácticas estandarizadas que miden la alfabetización financiera y la inclusión financiera. Luego utilizamos los resultados de la encuesta y el cálculo de índices en los cuatro niveles mencionados (conocimiento, actitud, bienestar e inclusión financiera) en un análisis de regresión múltiple para comprender la relación entre estas cuatro variables y las características de la muestra. Los resultados indican niveles elevados de conocimiento y actitud financiera en la población estudiantil (índice promedio alto). Sin embargo, en lo que respecta al bienestar y la inclusión financiera, encontramos niveles más bajos (índice promedio bajo). Las diferencias de género favorecen a los estudiantes varones, lo que reflejan otros estudios. En el análisis de regresión múltiple, encontramos que la confianza de los estudiantes es la única variable explicativa que fue positiva y estadísticamente significativa para las cuatro variables dependientes. Por el contrario, encontramos que el género, la edad, la raza, la carrera, el transporte y el estado de residencia ayudan a explicar, individualmente, algunas de las variables dependientes.
Palabras clave: actitud financiera, conocimiento, inclusión, bienestar.
Abstract: In this paper we assess the levels of financial knowledge, attitude, wellbeing, and inclusion among undergraduate students in a small, public, Hispanic Serving Institution, four-year university in rural New Mexico, using a survey based on standardized practices measuring financial literacy and financial inclusion. We then use the results from the survey and the calculation of indexes in the four mentioned levels (financial knowledge, attitude, wellbeing, and inclusion) in a multiple regression analysis to understand the relationship among these four variables and the characteristics of the sample. The results indicate elevated levels of financial knowledge, and financial attitude in the student population (high average index). However, when it comes to financial wellbeing, and inclusion, we found lower levels (low average index). Gender differences favor male students, mirroring other studies. In the multiple regression analysis, we found confidence of the students to be the only explanatory variable that was positive and statistically significant for all four dependent variables. Conversely, we found that gender, age, race, major, transportation, and state of residency help explain, individually, some of the dependent variables.
Keywords: financial attitude, knowledge, inclusion, wellbeing.
Introduction
The benefits of being financially literate are extensively reported in academic and policy circles. Future generations strive to plan their retirement, create wealth, reduce inequality, and overall make informed decisions, based on their knowledge of financial and economic topics. This paper assesses the financial literacy of the students in a small, public, Hispanic Serving Institution, four-year university in rural New Mexico. We use the results of the survey to understand the students’ current levels of financial knowledge, attitude, wellbeing, and inclusion, across disciplines. The results are also analyzed in the context of gender, major, race, and other social and demographic factors.
Financial literacy is defined as “a combination of awareness, knowledge, skill, attitude, and behaviour necessary to make sound financial decisions and achieve individual financial wellbeing”. The Organization for Economic Co-operation and Development International Network on Financial Education –OECD/INFE– continually update and provide guidelines to measure, not only financial literacy, but also financial inclusion. The OECD/INFE assesses adult financial literacy using a framework that includes financial knowledge, attitudes, wellbeing, and inclusion but also ponders sociodemographic information. Their survey template is divided into several sections and categories. The questions in the category of financial knowledge include topics of interest, inflation, value of money, risk and return and diversification. Survey questions in the overall financial attitude assessment include inquires on savings versus spending habits, future or present preferences and risk preferences. Survey questions assessing financial wellbeing include keeping track of money, making ends meet, choosing financial products and short-term and long-term planning. Finally, survey questions assessing financial inclusion gather information on awareness of financial products, the purchase or possession of the mentioned products, and individual saving habits.
Following the OECD/INFE methodology/toolkit, we created and distributed a survey for students registered in three or more credit hours at Western New Mexico University –WNMU–, during the Spring semester of 2023. The survey had 28 questions, with 23 of them measuring: financial knowledge (questions 2 to 8), financial attitude (questions 9 to 11), financial wellbeing (questions 12 to 16), and financial inclusion (questions 17 to 23). The survey was distributed online and available to all students for one month (April 2023), and we received 435 responses from undergraduate students. The survey was independently distributed to all students by the Office of Institutional Research to protect the student’s anonymity. The construction and analysis of the survey applied standard practices in financial literacy and financial inclusion assessment tools, such as the OECD/INFE toolkit. The results were used to calculate four independent indexes (knowledge, attitude, wellbeing, and inclusion). The indexes were then used in a statistical model to understand the relationship among the variables.
The study contributes to the existing literature in financial literacy by using the results to better understand the students’ financial levels of knowledge, attitude, wellbeing, and inclusion in the context of a small university setting. The relationship and significance between dependent and independent variables, found in the population, are importantly different from other studies. The large number of non-traditional students, the gender composition of the sample, and the university’s rural setting are examples of such differences. This highlights the context of the study and its application to areas with similar characteristics. The results of the study could be used to support policies, programs and products or services directed to addressing the financial wellbeing of the students. The next section presents a revision of current literature and in the third section we present the survey and methodology, followed by the discussion of results. The last two sections include the conclusion and references.
Literature review
The implementation of national strategies promoting financial literacy and the design of financial education policies have become a priority for policymakers worldwide. It has been found that financial education affects financial knowledge and has positive effects on all financial behaviors and attitudes. The implementation of measures to increase financial literacy has shown to be cost-effective and exponentially efficient in improving average outcomes, lifting barriers in the financial system. Moreover, in Lusardi et al. (2010), they point out: “to put the effects into further context, our results on financial knowledge are comparable to meta-analyses studying the effects of math and reading education”, upgrading the importance of financial literacy to the inherently basic learning concepts encompassed in our educational system.
The OECD/INFE has developed a standardized questionnaire and methodology that provides initial measures of financial literacy. Their survey has been used internationally to compare, benchmark, and identify gaps between nations or groups. The survey is designed to obtain results applicable to subjects with different socioeconomic levels, and diverse financial and macroeconomic backgrounds. It also includes the opportunity to conduct assessments over time and compare levels of financial literacy across countries.
Many researchers have implemented the mentioned questionnaire, plus addressed other intricacies of their regions, states or countries by adding additional concepts without changing the core subjects of the questionnaire. A study by Bumcrot et al. (2013) explored how well-equipped households make complex financial decisions in the face of often high-cost and high-risk financial instruments. They found a wide variation in financial literacy indexes across the United States of America, mostly attributable to socioeconomic differences, such as specific factors like state poverty levels. They also found a significant correlation between financial literacy and the state’s poverty level.
In measuring the financial literacy of the adult population, the experience of Banca d’Italia, provide a roadmap to analyze the data and to better understand the methodology used by the OECD/INFE. Di Salvatore et al. (2018), using hybrid models to interview the sample, found gaps in the financial literacy of the elderly and women, and suggested improvements for cross country comparisons of the survey results. The analysis of the survey results highlighted the role of self-assessment in financial literacy.
When it comes to financial security, financial education is critical for the financial wellbeing and long-term retirement planning. Wagland and Taylor (2009) surveyed undergraduate business students to assess their financial literacy level, and to determine if gender is a significant variable when it comes to individual financial literacy. The authors used a study by Chen and Volpe (2002) suggesting that women have less confidence than men and that this may explain why men are more financially knowledgeable than women. By inference, a lack of financial knowledge, confidence, and a reluctance to take risk are factors likely to impact women’s financial ability. Opposite to the common idea, results of their study found that female students are slightly more financially literate than males.
It is important that individually and collectively we address the concept of transmitting financial knowledge to create financial wellbeing. The increase in individual financial difficulties, increase in societal problems, and evolving negative welfare effects in the population can be partially explained by the lack of financial knowledge. Muir et al. (2017) defined financial wellbeing as when a person can meet expenses and has some money left over, is in control of their finances and feels financially secure, now and in the future. A financially healthy individual also has adequate income for basic needs, paying off debts, and covering unexpected expenses.
Financial wellbeing is closely and positively linked to security and happiness in general. Van Praag et al. (2003) confirmed that a healthy spending and savings balance is crucial for sustaining long-term financial and personal wellbeing. Hojman et al. (2016) found that depressive symptoms are higher for those who have been persistently over-indebted. In addition, research has shown that personal stress caused by unhealthy spending and saving behavior will not only affect the individual, but also their families and societies.
Other studies among students and young adults include Lusardi et al. (2010). They found most young adults lacking knowledge on interest rates, inflation, and risk diversification. Additionally, financial literacy was strongly related to sociodemographic characteristics and family financial sophistication. This implies a significant gender gap, favoring college-educated men by 50 percentage points more than female. Villagómez (2016) utilized similar methods, surveying students in Mexico ages 15-18 using the OECD/INFE methodology. He found that “gender differences were slight but favored men”.
The Teachers Insurance and Annuity Association of America –TIAA– Institute and the Global Financial Literacy Excellence Center –GFLEC– regularly publish financial literacy and other financial wellbeing information, including financial literacy indexes specific to race, gender, and other groups. In 2022, they found women to have lower financial literacy than men, with wider gaps across areas of financial literacy and generationally. It is evident, again, that greater financial literacy generally translates into greater financial wellbeing, and lower financial literacy is generally associated with lower financial wellbeing.
It has been observed that students with bank accounts or prepaid debit cards generally score higher on financial literacy measures than those who do not. In the United States, one in five students lack basic financial skills, and one in ten students are considered highly proficient. However, the availability of tools, or at least some degree of financial inclusion, is not one of the issues the students face in the United States of America. This report from the TIAA Institute and the GFLEC found that “student’s financial literacy is affected by their interaction with financial institutions” and that most U.S. students need to make continuous decisions (financial) about their saving and spending habits. It is understood that by being pushed into participating in the formal financial system (inclusion), the student can become more financially knowledgeable and literate.
Financial inclusion is defined as when individuals have access to appropriate and affordable financial services and products, such as transaction account, general insurance, and a moderate amount of credit. However, for Sarma and Pais (2008), financial inclusion is the ease of access, availability, and usage of the formal financial system by all members of the economy. The authors state that an inclusive financial system facilitates efficient allocation of productive resources and thus can potentially reduce the cost of capital, can significantly improve the day-to-day management of finances, and reduce the growth of informal sources of credit (such as moneylenders) which are often found to be exploitative. Consequently, an inclusive financial system enhances efficiency and welfare by providing avenues for secure and safe saving practices and by facilitating an entire range of efficient financial products and services. The level of societal participation and financial inclusion is determined by the overall attitude of the population towards economic factors and personal financial decisions.
Financial attitudes along with financial behaviour can also affect financial wellbeing. Past research concluded that there is a link between financial attitudes and financial literacy among youth. Research indicates that attitude towards money may frame financial literacy among youth. Thus, students that show a positive attitude toward subjects of money and finance, generally have enhanced financial behaviour, increased financial knowledge, and because of this improved financial literacy.
According to Rai et al. (2019), financial attitude can be defined as personal inclination towards financial matters. It is an ability to plan and maintain a savings account that matters. Moreover, Bhushan and Medury (2014) concluded that to enhance financial literacy among generations, the focus should be on developing favorable financial attitudes among the people of the country. This study addressed the attitude of the students from all disciplines towards financial concepts and their daily decisions with respect to this matter.
Survey
To the knowledge of the researchers, this is the first time a survey of this kind has been distributed to the students of WNMU. The survey was designed using the OECD/INFE toolkit for measuring financial literacy and financial inclusion (2016). The survey had 28 questions and was divided into five sections. The five sections request information from the students in: 1) measuring socioeconomic factors (gender, age, etc.), 2) financial knowledge (interest rates, inflation, etc.), 3) financial attitude (savings, economic situation), 4) financial behaviors (importance of savings, retirement, etc.) and 5) financial inclusion (possession of credit cards, insurance, retirement, etc.).
The results were tabulated and used in calculating knowledge, attitude, wellbeing, and inclusion indexes. Tables 1 and 2 summarize the characteristics of the sample consisting of 435 responses from 23 majors, with ages fluctuating between 15 to 69 years old, and with most of the responses coming from female students (70%), which mirrors the distribution of female to male ratio of the population at the university level.
The demographic characteristics of the sample are representative of the demographics of the overall university population. Hispanics and White represent most of the participants (82%) and 50% of the students are in the range of 15 and 28 years old. Of the total of the sample about 38% of the responses were business majors and 61% were not business majors (with 1% non-declared majors).
| Total | Percentage | |
| Gender | ||
| Female | 299 | 70% |
| Male | 130 | 30% |
| Age | ||
| 15-22 | 151 | 35% |
| 23-28 | 65 | 15% |
| 29-35 | 66 | 15% |
| 36-44 | 79 | 18% |
| 45-52 | 45 | 10% |
| 53-69 | 28 | 6% |
| Race | ||
| Hispanic | 170 | 44% |
| White | 148 | 38% |
| Blank | 27 | 7% |
| Black or African American | 15 | 4% |
| American Indian/Alaskan Native | 10 | 3% |
| Two or More Races | 9 | 2% |
| Asian | 6 | 2% |
| Native Hawaiian or Other Pacific Islander | 3 | 1% |
| Majors | Participants (Spring 2023) | % of the sample | Total Majors (Spring 2023) | % of Participation (Discipline) |
| Business | 165 | 38% | 270 | 61% |
| Education | 110 | 26% | 730 | 15% |
| Nursing | 21 | 5% | 180 | 12% |
| Social Work | 18 | 4% | 567 | 3% |
| Psychology | 17 | 4% | 88 | 19% |
| Criminal Justice | 15 | 4% | 84 | 18% |
| Interdisciplinary | 13 | 3% | 82 | 16% |
| Kinesiology | 8 | 2% | 76 | 11% |
| Mathematics | 7 | 2% | 23 | 30% |
| Arts | 7 | 2% | 38 | 18% |
| Biology | 6 | 1% | 20 | 30% |
| English | 6 | 1% | 21 | 29% |
| Technology | 5 | 1% | 74 | 7% |
| Wildlife | 3 | 1% | 32 | 9% |
| Zoology | 2 | 0% | 29 | 7% |
| Botany | 2 | 0% | 4 | 50% |
| Science | 2 | 0% | 6 | 33% |
| Human Services | 2 | 0% | 7 | 29% |
| Political Sciences | 2 | 0% | 7 | 29% |
| History | 1 | 0% | 16 | 6% |
| Sociology | 1 | 0% | 9 | 11% |
| Chemistry | 1 | 0% | 9 | 11% |
Methodology
The aim of the survey is to assess the differences in financial knowledge, attitude, wellbeing, and inclusion (if any), among the total undergraduate students attending in Spring 2023 (total of 2,372 undergraduate students registered). The independent variables are gender, major, race, age, state of residence, transportation method and level of confidence (self-assessment). To detect if these variables (gender, major, race, age, state of residence, transportation method and level of confidence) affect the student’s financial knowledge, financial attitude, financial wellbeing, or financial inclusion, we estimated the models separately for each dependent variable.
The selection of independent variables was grounded in prior financial literacy behavior research. Gender and age were included because earlier studies consistently identify demographic gaps in financial literacy (Chen & Volpe, 2002; Lusardi et al., 2010; Wagland & Taylor, 2009). Race/ethnicity was incorporated in response to evidence from national datasets showing persistent disparities across racial groups in access to financial services, financial knowledge, and financial wellbeing (The Teachers Insurance and Annuity Association of America Institute & Global Financial Literacy Excellence Center [TIAA Institute & GFLEC], 2022). Academic major was included to examine whether exposure to business coursework contributes to higher financial literacy levels, consistent with findings that specialized financial education impacts financial knowledge and attitudes (Bumcrot et al, 2013). Transportation ownership was used as a proxy for financial experience because owning a vehicle often involve engagement with loans, insurance products, and budgeting, which may influence financial inclusion and confidence. Finally, self-assessment (confidence) was included because the literature positions confidence as a critical factor of whether financial knowledge translates into behavior (Muir et al., 2017; Rai et al., 2019).
Four dependent variables are:
-
• Dependent Variable 1: Financial Knowledge (v1) = B0 + B1 (Gender) + B2 (Age) + B3 (Race 1) + B4 (Race 2) + B5 (Race 3) + B6 (Race 4) + B7 (Race 6) + B8 (Race 7) + B9 (Major) + B10 (Major 1) + B11 (Transportation) + B12 (State of Residency) + B13 (Self-Assessment) + ei
• Dependent Variable 2: Financial Attitude (v2) = B0 + B1 (Gender) + B2 (Age) + B3 (Race 1) + B4 (Race 2) + B5 (Race 3) + B6 (Race 4) + B7 (Race 6) + B8 (Race 7) + B9 (Major) + B10 (Major 1) + B11 (Transportation) + B12 (State of Residency) + B13 (Self-Assessment) + ei
• Dependent Variable 3: Financial Wellbeing (v3) = B0 + B1 (Gender) + B2 (Age) + B3 (Race 1) + B4 (Race 2) + B5 (Race 3) + B6 (Race 4) + B7 (Race 6) + B8 (Race 7) + B9 (Major) + B10 (Major 1) + B11 (Transportation) + B12 (State of Residency) + B13 (Self-Assessment) + ei
• Dependent Variable 4: Financial Inclusion (v4) = B0 + B1 (Gender) + B2 (Age) + B3 (Race 1) + B4 (Race 2) + B5 (Race 3) + B6 (Race 4) + B7 (Race 6) + B8 (Race 7) + B9 (Major) + B10 (Major 1) + B11 (Transportation) + B12 (State of Residency) + B13 (Self-Assessment) + ei
Where:
-
v 1 = the level/index of the participants financial knowledge,
v 2 = the level/index of the participants financial attitude,
v 3 = the level/index of the participants financial wellbeing,
v 4 = the level/index of the participants financial inclusion,
Gender = 1 if a participant is male, 0 otherwise,
Age = ages range from 15 to 69,
Race 1 = 1 if a participant is White, 0 otherwise,
Race 2= 1 if a participant is Black or African American, 0 otherwise,
Race 3= 1 if a participant is Hispanic, 0 otherwise,
Race 4= 1 if a participant is American Indian/Alaskan Native, 0 otherwise,
Race 5= 1 if a participant is Native Hawaiian or Other Pacific Islander, 0 otherwise,
Race 6= 1 if a participant is Asian, 0 otherwise,
Race 7= 1 if a participant has Two or More Races, 0 otherwise,
Major = 1 if participant major in any of the 23 majors available at WNMU, 0 if not declared,
Major 1 = 1 if a participant is Business Major, 0 otherwise,
Transportation = 1 if a participant owns a car, 0 otherwise,
State of Residency = 1 if a New Mexico Resident, 0 otherwise,
Self-Assessment = Student’s level of confidence (10 most confident and 0 least confident).
We use the theoretical framework used by Wagland and Taylor (2009), because of the similarities in populations. However, we do not limit our study to business students. The broad sample allowed us to calculate the levels of financial knowledge, attitude, wellbeing, and inclusion of all students, and assess these factors among age, genders, race, and disciplines. We also study the impact of means of transportation (proxy for financial experience or ability), state of residency (proxy for regional factors) and self-assessment (level of confidence) with the calculated financial indexes (knowledge, attitude, wellbeing, and inclusion) by using a multiple linear regression. Linear regression models are used for continuous variables such as test scores or the degrees of financial knowledge, financial attitude, financial wellbeing, and financial inclusion (the variables of interest of the study). Following Chen and Volpe (2002) we disaggregated some variables (race and major). The coefficients for these variables represent the effect on each subgroup compared with a reference group, which is arbitrarily selected. For example, major 1 is coded as “1” if the student is a business major, “0” otherwise. If the coefficient of the variable is positive and statistically significant it means that compared to other majors, business majors are more likely to have more financial knowledge. The model was applied to all dependent variables, and it is corrected for heteroskedasticity. Finally, there was no evidence of collinearity.
To calculate financial knowledge, financial attitude, financial wellbeing, and financial inclusion indexes (dependent variables), the methodology of standardized OECD/INFE (2016) was followed, content validity was ensured by adopting the OECD/INFE internationally validated questionnaire, a widely used instrument in cross-country financial literacy assessment. Construct validity was reinforced through the index-based design of the instrument, previous studies (di Salvatore et al., 2018; Kaiser et al., 2022) demonstrated that the OECD/INFE items reliability differentiate between levels of knowledge, attitudes, and behaviors. In the present study, regression results supported theoretical expectations. We tabulated the correct answers for specific questions in the survey for each one of the indexes (see Appendix 1). For financial knowledge participants could achieve a maximum average of 7, for financial attitude participants could achieve a maximum average of 5, for financial wellbeing participants could achieve a maximum average of 4, and for financial inclusion participants could achieve a maximum average of 7. Each index was normalized (0-1 and/or percentage scores) for descriptive comparison. These indexes assess different areas:
-
• Financial Knowledge measures understanding of basic financial concepts.
• Financial Attitude measures attitude towards money and financial planning.
• Financial Wellbeing measures financial decisions that allow for minimum financial pressure or stress.
• Financial Inclusion measures the population’s participation in diverse financial products and services offered by the financial sector.
The principal limitation of this study is the collection of data drawn from only one university and only one period (semester). This limitation makes comparing results or benchmarking difficult. Other limitations include the existing variations in approaches defining financial literacy and calculating indexes, across studies, however most of the interpretations found in the literature review section share common indicators that we have included in this study. Lastly, although the sample size was robust, participation was voluntary and subject to self-section bias, students with greater interest in financial issues may have been more likely to respond.
Results
The individual indexes calculations from the survey are shown in Table 3.
| Financial Knowledge Index (Max of 7) | Financial Attitude Index (Max of 5) | Financial Wellbeing Index (Max of 4) | Financial Inclusion Index (Max of 4) |
| 5.39 | 2.27 | 3.56 | 2.89 |
| (77%) | (45%) | (89%) | (72%) |
The survey results indicate that students have elevated levels of financial knowledge, and financial attitude, but they scored lower financial inclusion, and very low in financial wellbeing. These results can be interpreted as a deficiency in the areas of financial planning and lower participation in diverse financial products and services, regardless of the availability of financial tools and the shared knowledge of the basic financial concepts. By consequence the financial wellbeing is reduced, and financial stress is increased.
Financial knowledge results indicate that students understand basic concepts of interest and inflation (high financial knowledge levels). The existing attitude index indicate positive savings and spending habits and can help explaining the high levels of confidence (self-assessment) and positive expectations about the future. Low wellbeing index show a lack of money management skills, traceability of money, and short- and long-term planning. Lastly, the levels of inclusion can be explained by the ease of access to different financial instruments such as loans, investments/savings, credit, or insurance, but the lack of planning reduces its efficacy. Specifically, for students in the United States of America, the levels of inclusion are higher when compared to other countries, regardless of the use of the financial instruments.
Overall, students feel confident in their financial knowledge and personal finance management. Table 4 shows that 65% of the students self-assessed above 6 on a scale from 1 to 10 (10 being most confident).
| Confidence Level (self-assessment) | ||
| 10 | 6 | 1% |
| 9 | 27 | 6% |
| 8 | 87 | 20% |
| 7 | 109 | 25% |
| 6 | 58 | 13% |
| 5 | 79 | 18% |
| 4 | 38 | 9% |
| 3 | 21 | 5% |
| 2 | 4 | 1% |
| 1 | 4 | 1% |
Many claim that gender is a significant variable affecting the level of financial literacy. We found that men are more confident in their financial knowledge than women. The most frequent self-assessment for men was between 6 and 7 (with 10 being most confident and 0 least confident) (see Figure 1). For women, the most frequent self-assessment was between 5 and 6 (with 10 being most confident and 0 least confident) (see Figure 2). Research proposes that risk aversion is related to confidence when making financial decisions, women are less confident and by consequence that impacts their ability to secure retirement funds.
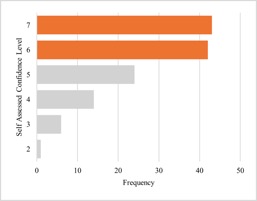
Figure 1
Confidence in Financial Knowledge (male)
Source: Created by authors.
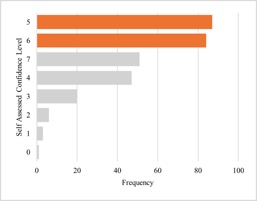
Figure 2
Confidence in Financial Knowledge (female)
Source: Created by authors.
The results from the linear regression for variables 1-4 are shown in tables 5 to 8. For the dependent variable financial knowledge (Table 5), results show the gender variable to be positive and statistically significant. The results indicate that male students have more financial knowledge than female students. The age coefficient was also positive and statistically significant which implies that older participants are more prone to have more financial knowledge. The coefficient for race 1 was positive and significant, which suggests White students have more financial knowledge. Both major and major 1 variables were found positive and statistically significant, which implies a positive financial knowledge on the student population. Nevertheless, when standing alone (major 1) Business majors show a positive and significantly larger coefficient with respect to financial knowledge. The self-assessment variable exhibits a positive and significant coefficient with respect to financial knowledge, suggesting students feel confident they understand financial concepts and financial decisions. Finally, the positive relationship and statistical significance in transportation (used as a proxy for financial experience or ability) describes how having access to a car strengthens the impact and the experience of use of financial instruments (i.e., loans) and experience in decision making in the financial area.
| Coefficient | Std. Error | t-ratio | p-value | ||
| const | 2.87937 | 0.312383 | 9.217 | <0.0001 | *** |
| Gender | 0.392580 | 0.123711 | 3.173 | 0.0016 | *** |
| Age | 0.0143362 | 0.00426068 | 3.365 | 0.0008 | *** |
| Race1 | 0.387651 | 0.155674 | 2.490 | 0.0132 | ** |
| Race2 | −0.177929 | 0.461120 | −0.3859 | 0.6998 | |
| Race3 | 0.0419104 | 0.168357 | 0.2489 | 0.8035 | |
| Race4 | 0.320408 | 0.544387 | 0.5886 | 0.5565 | |
| Race5 | 0.596497 | 0.457378 | 1.304 | 0.1929 | |
| Race6 | 0.604993 | 0.926527 | 0.6530 | 0.5142 | |
| Race7 | −0.128656 | 0.345951 | −0.3719 | 0.7102 | |
| Major | 0.0305315 | 0.0124869 | 2.445 | 0.0149 | ** |
| Major1 | 0.394144 | 0.161757 | 2.437 | 0.0153 | ** |
| Transportation | 0.241425 | 0.124738 | 1.935 | 0.0536 | * |
| State of Residency | −0.0336940 | 0.165226 | −0.2039 | 0.8385 | |
| Self-Assessment | 0.198316 | 0.0337732 | 5.872 | <0.0001 | *** |
Besides financial knowledge, another variable that influences financial management behavior is financial attitude (Table 6). According to Firli and Hidayati (2021), the better financial attitude the better the financial management ability. With a positive financial attitude, individuals will be able to distinguish between needs and wants. For the dependent variable financial attitude, results show the gender variable to be positive but statistically insignificant, which was unexpected. The age variable was positive and statistically significant which implies that older participants are more prone to have a better financial attitude.
The coefficients for the race 1, race 2 and race 3 were positive and significant, which suggests White, Black, and Hispanic students have a positive financial attitude. Both variables, major and major 1, were found positive and statistically significant, which implies a positive financial attitude of the student population in general. Nevertheless, when standing alone (major 1) Business majors show a positive and significantly larger coefficient with respect to financial attitude. The transportation coefficient was found to be negative and significant; this may suggest that the individual may have access to acquire a mean of transportation but may have not financially planned accordingly. Consequently, this decision could generate cash flow problems. The state of residency coefficient is positive and significant; this may be due to unidentified factors specific to the State of New Mexico. One of these factors could be related to the financial inclusion variable, that it is also positively and significatively related to state of residency (see Table 8) and the students confidence levels. The self-assessment variable was found to have a positive and statistically significant relationship with financial attitude.
| Coefficient | Std. Error | t-ratio | p-value | ||
| const | 1.72278 | 0.288836 | 5.965 | <0.0001 | *** |
| Gender | 0.0501038 | 0.0906936 | 0.5525 | 0.5809 | |
| Age | 0.0103002 | 0.00410316 | 2.510 | 0.0125 | ** |
| Race1 | 0.373353 | 0.160748 | 2.323 | 0.0207 | ** |
| Race2 | 0.532994 | 0.229253 | 2.325 | 0.0206 | ** |
| Race3 | 0.287223 | 0.161962 | 1.773 | 0.0769 | * |
| Race4 | 0.286075 | 0.273956 | 1.044 | 0.2970 | |
| Race5 | 0.524455 | 1.46989 | 0.3568 | 0.7214 | |
| Race6 | 0.0165472 | 0.159086 | 0.1040 | 0.9172 | |
| Race7 | 0.399958 | 0.456917 | 0.8753 | 0.3819 | |
| Major | 0.0401863 | 0.00913562 | 4.399 | <0.0001 | *** |
| Major1 | 0.347341 | 0.107086 | 3.244 | 0.0013 | *** |
| Transportation | −0.157536 | 0.0877805 | −1.795 | 0.0735 | * |
| State of Residency | 0.299798 | 0.148489 | 2.019 | 0.0442 | ** |
| Self-Assessment | 0.0981759 | 0.0209085 | 4.695 | <0.0001 | *** |
The dependent variable financial wellbeing (Table 7) shows that only two of the variables are positive and statistically significant. These variables are race 4 and self-assessment, suggesting positive financial wellbeing of the participants who identified as American Indian/Alaskan Native. Additionally, a positive relationship between elevated levels of student’s confidence and financial wellbeing.
In her study, Nam (2022) suggests that higher financial wellbeing levels are found in groups with higher education or income. Additionally, groups with high financial wellbeing are characterized by self-confidence resulting in financial empowerment. Overall, we did not find a high financial wellbeing index among participants.
Results in financial wellbeing were surprising, since no relationship was found for the gender, age, major, or state of residency variables. We did expect that financial pressure or stress to be higher for students, based on the national narrative towards student loans. Equally, we expected to see these factors as a cause of stress or pressure for students according to their gender or age. Finally, we expected to see specific factors unique to New Mexico to have an effect in the financial wellbeing of the students.
| Coefficient | Std. Error | t-ratio | p-value | ||
| const | 1.08211 | 0.273034 | 3.963 | <0.0001 | *** |
| Gender | 0.129559 | 0.0932669 | 1.389 | 0.1656 | |
| Age | 0.00113774 | 0.00396122 | 0.2872 | 0.7741 | |
| Race1 | 0.0740802 | 0.124299 | 0.5960 | 0.5515 | |
| Race2 | 0.119421 | 0.180404 | 0.6620 | 0.5084 | |
| Race3 | 0.163427 | 0.127093 | 1.286 | 0.1992 | |
| Race4 | 0.538278 | 0.207114 | 2.599 | 0.0097 | *** |
| Race5 | 0.315206 | 0.231286 | 1.363 | 0.1737 | |
| Race6 | 0.334187 | 0.332050 | 1.006 | 0.3148 | |
| Race7 | 0.199654 | 0.445172 | 0.4485 | 0.6540 | |
| Major | 0.00341951 | 0.0107785 | 0.3173 | 0.7512 | |
| Major1 | 0.0652558 | 0.115856 | 0.5633 | 0.5736 | |
| Transportation | 0.0968755 | 0.0992335 | 0.9762 | 0.3295 | |
| State of Residency | 0.184221 | 0.125972 | 1.462 | 0.1444 | |
| Self-Assessment | 0.122096 | 0.0288990 | 4.225 | <0.0001 | *** |
For the dependent variable of financial inclusion (Table 8), the results show the gender variable to be negative and statistically significant, suggesting that males have lower financial inclusion than females. The age coefficient was positive and statistically significant which implies that older participants are more prone to have better financial inclusion. Only race 6 coefficient was positive and significant, which suggests Asian students have a positive relation with financial inclusion. Finally, state of residence and the self-assessment coefficients were positive and significant. These results suggest State specific factors positively affecting financial inclusion, and higher levels of confidence certainly affecting the financial inclusion of the students, and their use of the available financial instruments.
The mentioned levels of inclusion (high index of awareness, but low usage) may be impacting the income earning opportunities for the population by having access to less costly and safer means of doing payments or transactions, also, by allowing them to have access to better savings and credit services, investing and insurance opportunities. The fact that the study suggests that females have a higher level of financial inclusion is an overall positive result, as it has often been argued that credit to female borrowers has additional direct impact on household welfare than credit to male borrowers as they care more about children and family (Beck, 2016).
| Coefficient | Std. Error | t-ratio | p-value | ||
| const | 0.667634 | 0.235058 | 2.840 | 0.0047 | *** |
| Gender | −0.240420 | 0.0895956 | −2.683 | 0.0076 | *** |
| Age | 0.0351871 | 0.00357676 | 9.838 | <0.0001 | *** |
| Race1 | 0.0264225 | 0.111131 | 0.2378 | 0.8122 | |
| Race2 | −0.207094 | 0.252199 | −0.8212 | 0.4120 | |
| Race3 | 0.145866 | 0.113611 | 1.284 | 0.1999 | |
| Race4 | 0.208314 | 0.244112 | 0.8534 | 0.3940 | |
| Race5 | −0.378854 | 0.479910 | −0.7894 | 0.4303 | |
| Race6 | 0.605917 | 0.268517 | 2.257 | 0.0246 | ** |
| Race7 | −0.0784089 | 0.168208 | −0.4661 | 0.6414 | |
| Major | 0.0138192 | 0.00982250 | 1.407 | 0.1602 | |
| Major1 | 0.127272 | 0.116623 | 1.091 | 0.2758 | |
| Transportation | 0.142988 | 0.0881705 | 1.622 | 0.1056 | |
| State of Residency | 0.384384 | 0.0970720 | 3.960 | <0.0001 | *** |
| Self-Assessment | 0.0859886 | 0.0225002 | 3.822 | 0.0002 | *** |
Conclusions
The economic system (government and businesses) assume that all individuals have a high level of knowledge to be able to participate in it, successfully. Therefore, there is a direct relationship between financial decisions and the local, regional, and national economic system. Consequently, it is important to assess and develop programs ensuring higher levels of financial knowledge, financial attitude, financial wellbeing, and financial inclusion. Universities are places that provide students with lifelong tools to be financially successful. Therefore, it is important to assess the mentioned factors at the university level, if society wants to see lower financial costs, efficient financial decisions and long-term economic benefits for the population. This study measures the indexes for each of the above-mentioned variables and statistically tests their relationship with selected socioeconomic variables.
The analysis of the survey and the calculation of the four indexes provides an overall mixed perspective of the student’s financial literacy profile. It was found that university students have considerable high financial knowledge. The financial knowledge index recorded was 5.39 out of 7, this is an overall score of 77%. The linear regression modelling explains how financial knowledge improves with age, suggesting that part of this skill can be obtained by trial-and-error processes. However, it is also true that the trial-and-error types of processes could result in high and costly errors, in terms of time and money lost in the learning process, or could even create a credit or debt problem that will impact the individual’s life. In agreement with other studies, the results found male students to have higher financial knowledge than females. Results also found that students majoring in business or related fields have higher financial knowledge than students majoring in other areas. This could be explained by the individual’s exposure to financial topics, compared to other majors. Students who identified as White were found to have higher financial knowledge, and owning a method of transportation was found to have a positive relationship with financial knowledge.
The financial attitude index was found to be high, with 3.56 out of 5 or an overall score of 71%. The index showed a positive and statistically significant relationships with age, race (1, 2, 3), major, major 1, and state of residency. Surprisingly, transportation had a negative and statistically significant relationship with financial attitude. After owning means of transportation, students seem to have an indifferent attitude toward money and overlook financial planning aspects, which could result in lower financial wellbeing. All four variables (knowledge, attitude, wellbeing, and inclusion) are important, but it is inferred from the literature review that by improving levels of financial attitude the overall financial health of the individuals will improve. Low levels of financial attitude may cause poor financial planning and/or lack of differentiation between wants and needs and have an overall negative impact in the individual’s financial future.
Financial wellbeing, financial measures, and financial decisions are linked to stress and psychological problems. We found that almost 70% of individuals in the study stated that they do not use financial management to make decisions (financial management does not control their lives), less than half indicated they have money left at the end of the month and just two thirds have enough money to cover their expenses every month. The financial wellbeing index was the lowest of them all, 2.25 out of 4 (for an overall score of 56%), suggesting that individuals are making poor financial choices that bring stress to their lives. Some of the statistics suggested opportunities for improvement in terms of financial attitude (planning and tracking expenses), which is closely related to improving financial wellbeing.
In the case of financial inclusion, the results show a sizable high index or 4.69 out of 7 (for an overall score of 67%). Opposite of what we expected, the gender variable in this area was negative and statistically significant, indicating a higher financial inclusion for females. Financial inclusion was found to improve with age. Only one of the seven included races (variable) was found to have a positive and statistically significant relationship with financial inclusion. The state of residence had a positive and significant relation with financial inclusion, suggesting that there are specific geographic factors, increasing financial inclusion for State residents, in relation with out of State students. When survey data is disaggregated by financial instruments, financial inclusion awareness was found to be high (97%), but overall financial inclusion usage was found to be low (67%), consequently creating lower financial wellbeing. Students can be aware of the financial tools available, but do not take advantage or use them savvily.
Self-assessment (confidence level) was the only variable found to be positive and statistically significant across the board. Self-assessment (confidence level) was found to be higher in males than females. According to the results, there seems to be a disconnection between indexes. Overall, we found elevated levels of financial knowledge and financial attitude, lower levels of financial inclusion, and very low levels of financial wellbeing in the student population. Improving financial wellbeing could improve the overall financial profile of the individual. Nonetheless, improvements in financial wellbeing along with considerable financial knowledge and attitude ought to help individuals in tracking their money, making ends meet, choose financial products beneficial to their goals, and improve short-term and long-term planning. Financial inclusion is proven to be accessible, yet the lack of financial wellbeing prevents individuals to make better usage of the existing financial instruments in the market.
Future studies could expand in finding the causes for a disconnection between financial wellbeing and the other indexes. Existing research has suggested the right moment to provide basic financial knowledge is at a young age, before the individuals initiate making important financial decisions. A longitudinal analysis of the population in high school and subsequently in university could provide more information about the development of financial knowledge, attitudes, wellbeing, and inclusion. Even with a longitudinal study of the students at the college level, could help explain the gaps found in this study. There is a need to expand the sample to compare with other universities of similar size and factors. Furthermore, the disaggregation of the survey questions into more specific groups could provide additional information toward the understanding of the dependent variables.
Findings of this study offer relevant insights for educational strategies, curricular development, and institutional policy when interpreted through established learning frameworks. Although students reported relatively high financial knowledge, the substantially lower levers of financial wellbeing and inconsistent engagement with financial services suggest that knowledge by itself is insufficient to foster sound financial behavior. This pattern aligns with constructivist and social-cognitive theories, which emphasize contextualized learning, experiential application, and the central role of self-efficacy. The study’s identification of confidence as an important factor impacting the four dimensions of financial literacy reinforces prior evidence that behavioral change depends not only on cognitive mastery but also on perceived competence. These results highlight a persistent gap between understanding and action, one that can be addressed through pedagogical strategies that incorporate authentic practice, structured reflection, and guided financial decision-making opportunities.
These insights underscore the need for universities, particularly those serving rural and diverse populations, to embed financial literacy more intentionally within the curricula and institutional policies. The observed weakness in financial wellbeing and inclusion call for applied and interdisciplinary approaches that extend beyond business and finance courses. At Western New Mexico University, the School of Business has begun implementing such measures by modernizing finance curricula, integrating behavioral and applied financial concepts, and developing a university-wide Financial Lab. This initiative aims to provide experiential learning environments, such as financial coaching and behavioral assessments, that supports data-informed interventions and promote students’ practical financial competence. Through these curricular revisions and institutional efforts, WNMU is translating the study’s findings into actionable strategies that strengthen financial wellbeing and advance the integration of financial literacy across higher education.
Furthermore, the contribution of this study to the existing literature becomes relevant when its theoretical implications are articulated more explicitly. The findings reinforce and extend prior work cited in the literature review by confirming gender-based differences in confidence, age-related improvements in financial knowledge, and the central role of financial attitudes in shaping behavior. However, the low levels of financial wellbeing observed in a population with comparatively high financial knowledge challenge the traditional assumption that knowledge alone predicts positive financial outcomes. This divergence aligns with emerging research emphasizing the multidimensional nature of financial literacy and the importance of psychological, social and contextual factors. By documenting this disconnect in a rural Hispanic Serving Institution, the study adds empirical nuance to the theory and suggest that future financial literacy models should incorporate confidence, stress and environmental constraints as core explanatory variables rather than secondary influences.
References
Beck, T. (2016, November 29). Financial inclusion - measuring progress and progress in measuring [Conference presentation]. The Fourth IMF Statistical Forum “Lifting the small boats: Statistics for inclusive growth”, Washington D. C. https://www.imf.org/external/np/seminars/eng/2016/statsforum/
Bhushan, P., & Medury, Y. (2014). An empirical analysis of inter linkages between financial attitudes, financial behaviour and financial knowledge of salaried individuals. Indian Journal of Commerce and Management Studies, 5(3), 58-64. https://www.ijcms.in/index.php/ijcms/article/view/380
Bumcrot, C., Lin, J., & Lusardi, A. (2013). The geography of financial literacy. Numeracy, 6(2). https://doi.org/10.5038/1936-4660.6.2.2
Chen, H., & Volpe, R. P. (2002). Gender differences in personal financial literacy among college students. Financial Services Review, 11, 289-307. https://www.semanticscholar.org/paper/Gender-Differences-in-Personal-Financial-Literacy-Chen-Volpe/e61889201313bf6909b688e52095a97ebf67b5c5
Davis, H., Hasler, A., & Lusardi, A. (2018). An analysis of financial literacy among Italian students. Global Financial Literacy Excellence Center. https://gflec.org/wp-content/uploads/2018/08/Financial-Literacy-among-Italian-Students_GFLEC_May2018_Final_wl.pdf
de Clercq, B. (2019). A comparative analysis of the OECD/INFE financial knowledge assessment using the Rasch model. Empirical Research in Vocational Education and Training, 11, 8. https://doi.org/10.1186/s40461-019-0083-1
di Salvatore, A., Franceschi, F., Neri, A., & Zanichelli, F. (2018). Measuring the financial literacy of the adult population: The experience of Banca d’Italia. Bank of Italy/Eurosystem. https://www.bancaditalia.it/pubblicazioni/qef/2018-0435/index.html
Dunn, L., & Mirzaie, I. (2023). Gender differences in consumer debt stress: Impacts on job performance, family life and health. Journal of Family and Economic Issues, 44, 550-567. https://doi.org/10.1007/s10834-022-09862-z
Firli, A., & Hidayati, N. (2021). The influence of financial knowledge, financial attitude , and personality towards financial management behavior on productive age population. Review of Integrative Business and Economics Research, 10(3), 43-55. https://buscompress.com/uploads/3/4/9/8/34980536/riber_10-s3_04_k21-018_43-55.pdf
Grable, J., & Lytton, R. (1998). Investor risk tolerance: Testing the efficacy demographics as differentiating and classifying factors. Journal of Financial Counseling and Planning, 9(1), 61-73. https://www.afcpe.org/news-and-publications/journal-of-financial-counseling-and-planning/volume-9-1/%EF%BB%BFinvestor-risk-tolerance-testing-the-efficacy-of-demographics-%EF%BB%BFas-differentiating-and-classifying-factors/
Hojman, D., Miranda, Á, & Ruiz-Tagle, J. (2016). Debt trajectories and mental health. Social Science & Medicine, 167, 54-62. https://doi.org/10.1016/j.socscimed.2016.08.027
Kaiser, T., Lusardi, A., Menkhoff, L., & Urban, C. (2022). Financial education affects financial knowledge and downstream behaviors. Journal of Financial Economics, 145(2), 255-272. https://doi.org/10.1016/j.jfineco.2021.09.022
Kasman, M., Heuberger, B., & Hammond, R. A. (2018). Recomendations for improving youth financial literacy education. The Brookings Institution. https://www.brookings.edu/wp-content/uploads/2018/10/ES_20181001_Financial-Literacy-Recommendations.pdf
Lusardi, A., Mitchell, O. S., & Curto, V. (2010). Financial literacy among the young. The Journal of Consumer Affairs, 44(2), 358-380. https://doi.org/10.1111/j.1745-6606.2010.01173.x
Lyons, A., Palmer, L., Jayaratne, K. S. U., & Scherpf, E. (2006). Are we making the grade? A national overview of financial education and program evaluation. The Journal of Consumer Affairs, 40(2), 208-235. https://doi.org/10.1111/j.1745-6606.2006.00056.x
Muir, K., Hamilton, M., Noone, J. H., Marjolin, A., Salignac, F., & Saunders, P. (2017). Exploring financial wellbeing in the Australian context. Centre for Social Impact & Social Policy Research Centre/University of New South Wales Sydney, for Financial Literacy Australia. https://assets.csi.edu.au/assets/research/Exploring-Financial-Wellbeing-in-the-Australian-Context-Report.pdf
Nam, S.-J. (2022). Effects of financial empowerment and self-confidence in financial empowerment on financial well-being. Current Psychology, 42, 28309-28319. https://doi.org/10.1007/s12144-022-03916-z
OECD [Organization for Economic Co-operation and Development] (2011). Measuring financial literacy: Core questionnaire in measuring financial literacy: Questionnaire and guidance notes for conducting an internationally comparative survey of financial literacy. https://www.oecd.org/finance/education/measuring-financial-literacy-core-questionnaire-and-guidance-notes.htm
OECD/INFE [Organization for Economic Co-operation and Development International Network on Financial Education] (2016). 2015 OECD/INFE toolkit for measuring financial literacy and financial inclusion. https://policycommons.net/artifacts/3794191/2015-oecdinfe-toolkit-for-measuring-financial-literacy-and/4600019/
Rai, K., Dua, S., & Yadav, M. (2019). Association of financial attitude, financial behaviour and financial knowledge towards financial literacy: A structural equation modeling approach. FIIB Business Review, 8(1), 51-60. https://doi.org/10.1177/2319714519826651
Sarma, M., & Pais, J. (2008). Financial inclusion and development: A cross country analysis [Conference presentation]. Annual Conference of the Human Development and Capability Association, New Delhi. https://www.icrier.org/pdf/Mandira%20Sarma-Paper.pdf
TIAA Institute, & GFLEC [The Teachers Insurance and Annuity Association of America Institute & Global Financial Literacy Excellence Center] (2022). Financial literacy among U.S. women [2022 P-FIN Index data brief]. https://gflec.org/wp-content/uploads/2022/06/TIAA-Institute-GFLEC_Financial-literacy-among-U.S.-women_Data-Brief_June-2022.pdf
van Praag, B. M. S., Frijters, P., & Ferrer-i-Carbonell, A. (2003). The anatomy of subjective well-being. Journal of Economic Behavior & Organization, 51(1), 29-49. https://doi.org/10.1016/S0167-2681(02)00140-3
Villagómez, F. A. (2016). Alfabetismo financiero en jóvenes preparatorianos en la Zona Metropolitana del Valle de México. El Trimestre Económico, 83(331), 677-706. https://doi.org/10.20430/ete.v83i331.215
Wagland, S. P., & Taylor, S. (2009). When it comes to financial literacy, is gender really an issue? The Australasian Accounting Business & Finance Journal, 3(1), 13-25. https://www.uowoajournals.org/aabfj/article/1414/galley/1384/download/
Yakoboski, P. J., Lusardi, A., & Hasler, A. (2018). The 2018 TIAA Institute-GFLEC Personal Finance Index: The state of financial literacy among U.S. adults. TIAA Institute/GFLEC. https://gflec.org/wp-content/uploads/2018/04/TIAA_GFLEC_Report_PFinIndex_April2018_fin.pdf
Yakoboski, P. J., Lusardi, A., & Hasler, A. (2023, April 20). Financial well-being and literacy in a high-inflation environment. The 2023 TIAA Institute-GFLEC Personal Finance Index. TIAA Institute. https://www.tiaa.org/public/institute/publication/2023/financial-well-being-and-literacy-in-a-high-inflation-environmen
Appendix 1
Methodology and questions (based on the OEDC-INFE methodologyto measure financial literacy and inclusion)
| Question | Correct answer (for score) | ||
| Financial Knowledge | P2 | Imagine you are given a gift of $1,000 in total, but you must wait 1 year to spend the money. Inflation during that year is 5%, in one year’s time will you be able to buy? | Less number of items than what you could buy today. (1) |
| P3 | You lend $25 to a friend one evening and he gives you $25 back the next week. How much interest has he paid on this loan? | Nothing/zero (1) | |
| P4 | Suppose you put $100 into a savings account with a guaranteed interest rate of 2% per year. You do not make any further payments into this account, and you do not withdraw any money. How much would be in the account at the end of the first (1) year once the interest payment is made? | Exactly $102 (1) | |
| P5 | Suppose you put $100 into a savings account with a guaranteed interest rate of 2% per year. You do not make any further payments into this account, and you do not withdraw any money. How much would be in the account at the end of five (5) years once the interest payment is made? | More than $110 (1) | |
| P6 | An investment with a high return is likely to be high risk. | True (1) | |
| P7 | High inflation means that the cost of living is increasing rapidly. | True (1) | |
| P8 | It is better to save money in two or more financial instruments or financial institutions. For example, saving account, checking account, or investments. | True (1) | |
| Financial Attitude | P9 | I tend to live for today and let tomorrow take care of itself. | True (score 1) I do not Know (score 3) False (score 5) |
| P10 | I find it more satisfying to spend money than to save it for the long-term. | Agree (score 1) Neutral (score 3) I do not Know (score 3) Disagree (score 5) | |
| P11 | Money is there to be spent. | Agree (score 1) Neutral (score 3) I do not Know (score 3) Disagree (score 5) | |
| Financial Wellbeing | P12 | Do you have money left to spend at the end of the month? | Always (score 4) Sometimes (score 2) Never (score 0) I do not know (score 0) |
| P13 | Does financial management control your decisions in life? | Always (score 4) Sometimes (score 2) Never (score 0) I do not know (score 0) | |
| P14 | Given your current financial situation, do you feel you have all you wish for? | Agree (score 4) Neutral (score 2) I do not Know (score 0) Disagree (score 0) | |
| P15 | Do you have enough money to cover your expenses every month? | Agree (score 4) Neutral (score 2) I do not Know (score 0) Disagree (score 0) | |
| P16 | In general, do you feel confident you have enough money to cover your expenses? | Agree (score 4) Neutral (score 2) I do not Know (score 0) Disagree (score 0) | |
| Financial Inclusion | P17 | Since February 2022, you: saved money by lending money; saved money by investing in real estate or other industries; saved money, informally, with friends or coworkers; saved money, informally, with family members; saved money, informally, with other groups; or saved money at home. | Yes, to any (score 1) |
| P18 | Do you have one of these options: a savings, checks, retirement account, investment fund, welfare account, Certificate of deposit account? | Yes, to any (score 1) | |
| P19 | Since March 2022 to date, have you asked for a loan? From a credit union organization; from a pawnshop; from friends or acquaintances; from family; or other. | Yes, to any (score 1) | |
| P20 | Do you have a credit card from a bank, co-branded card, a personal loan, a car loan, home loan, union loan or another kind of formal credit? | Yes, to any (score 1) | |
| P21 | Do you have car insurance, home insurance, life insurance, medical expenses insurance (without considering Medicare and social medical assistance)? | Yes, to any (score 1) | |
| P22 | Do you participate in a welfare program for single parent children? | Yes, to any (score 1) | |
| P23 | Do you have a 401K or other retirement program? | Yes, to any (score 1) | |
Notas de autor
Información adicional
redalyc-journal-id: 5216