ANALYSIS OF PHYSICAL INDICES IN EARTHQUAKE RESILIENCE OF BABOL NEIGHBORHOODS, IRAN
ANÁLISE DE ÍNDICES FÍSICOS NA RESILIÊNCIA EM TERREMOTOS NOS BAIRROS DE BABOL, IRÃ
ANÁLISIS DE ÍNDICES FÍSICOS EN LA RESILIENCIA EN TERREMOTOS EN LOS BARRIOS DE BABOL, IRÁN
 MORTEZA SHOJAEE morteza.sh407@gmail.com
MEHDI ZARE morteza.sh407@gmail.com
BAHRAM AKASHEH akashe@ut.ac.ir
ABBAS OSTAD TAGHIZADEH ostadtaghizadeh@gmail.com
AREZOO DOROSTIAN dorostian382@yahoo.com
MORTEZA SHOJAEE morteza.sh407@gmail.com
MEHDI ZARE morteza.sh407@gmail.com
BAHRAM AKASHEH akashe@ut.ac.ir
ABBAS OSTAD TAGHIZADEH ostadtaghizadeh@gmail.com
AREZOO DOROSTIAN dorostian382@yahoo.com
ANALYSIS OF PHYSICAL INDICES IN EARTHQUAKE RESILIENCE OF BABOL NEIGHBORHOODS, IRAN
GEOSABERES: Revista de Estudos Geoeducacionais, vol. 11, pp. 364-380, 2020
Universidade Federal do Ceará

This work is licensed under Creative Commons Attribution-NonCommercial 4.0 International.
Received: 14 January 2020
Accepted: 11 February 2020
Published: 21 May 2020
Abstract: In recent years, one of the most important goals of urban managers has been the planning for resilience to natural disasters, especially earthquakes. Babol, as the second most populous city of Mazandaran province in northern Iran, is exposed to earthquakes due to its proximity to two active faults, the Caspian Sea and northern Alborz. The purpose of this study was to evaluate the effective physical indicators in the resilience rate of 22 neighborhoods of Babol. The research method is descriptive-analytical and applied-developmental. Accordingly, 48 effective indicators in the physical dimension were extracted and evaluated for their suitability through KMO test in consultation with experts and professors in urban planning, crisis management and earthquake. Then, the selected indices were reduced to four factors by factor analysis, which accounted for 61.9% of the variance. Among the four factors, the first factor alone accounted for 24.8% of the variance, which is the most influential factor in the study, and the fourth factor with 10.3% of the variance has the least effect. Cluster analysis was used for homogeneous classification of the neighborhoods and Babol's 22 neighborhoods were classified into 8 homogeneous groups. The results of clustering method show that about 40.9% of neighborhoods are evaluated as very poor, poor and relatively poor and in undesirable conditions in general. Also, about 18.2% of the neighborhoods are in the medium level and about 40.2% of the neighborhoods are evaluated as good, very good, excellent and very excellent levels in terms of physical resilience.
Keywords: Physical resilience, Earthquake, Factor analysis, Cluster analysis, Babol.
Resumo: Nos últimos anos, um dos objetivos mais importantes dos gestores urbanos tem sido o planejamento da resiliência a desastres naturais, especialmente terremotos. Babol, como a segunda cidade mais populosa da província de Mazandaran, no norte do Irã, está exposta a terremotos devido à sua proximidade com duas falhas ativas, o Mar Cáspio e o norte de Alborz. O objetivo deste estudo foi avaliar os indicadores físicos efetivos na taxa de resiliência de 22 bairros de Babol. O método de pesquisa é descritivo-analítico e aplicado-desenvolvimentista. Nesse sentido, 48 indicadores efetivos na dimensão física foram extraídos e avaliados quanto à sua adequação por meio do teste KMO em consulta com especialistas e professores em planejamento urbano, gestão de crises e terremoto. Em seguida, os índices selecionados foram reduzidos para quatro fatores pela análise fatorial, responsável por 61,9% da variância. Entre os quatro fatores, o primeiro fator sozinho foi responsável por 24,8% da variância, que é o fator mais influente no estudo, e o quarto fator, com 10,3% da variância, tem o menor efeito. A análise de agrupamento foi usada para a classificação homogênea dos bairros e os 22 bairros de Babol foram classificados em 8 grupos homogêneos. Os resultados do método de agrupamento mostram que cerca de 40,9% dos bairros são avaliados como muito pobres, pobres e relativamente pobres e em condições indesejáveis em geral. Além disso, cerca de 18,2% dos bairros estão no nível médio e cerca de 40,2% dos bairros são avaliados como bons, muito bons, excelentes e excelentes em termos de resiliência física.
Palavras-chave: Resiliência física, Terremoto, Análise fatorial, Análise de agrupamento, Babol.
Resumen: En los últimos años, uno de los objetivos más importantes de los administradores urbanos ha sido la planificación de la resistencia a los desastres naturales, especialmente los terremotos. Babol, como la segunda ciudad más poblada de la provincia de Mazandaran en el norte de Irán, está expuesta a terremotos debido a su proximidad a dos fallas activas, el Mar Caspio y el norte de Alborz. El propósito de este estudio fue evaluar los indicadores físicos efectivos en la tasa de resiliencia de 22 vecindarios de Babol. El método de investigación es descriptivo-analítico y de desarrollo aplicado. En consecuencia, se extrajeron 48 indicadores efectivos en la dimensión física y se evaluó su idoneidad a través de la prueba KMO en consulta con expertos y profesores en planificación urbana, gestión de crisis y terremotos. Luego, los índices seleccionados se redujeron a cuatro factores mediante análisis factorial, que representaron el 61,9% de la varianza. Entre los cuatro factores, el primer factor solo representó el 24.8% de la varianza, que es el factor más influyente en el estudio, y el cuarto factor con el 10.3% de la varianza tiene el menor efecto. El análisis de conglomerados se utilizó para la clasificación homogénea de los barrios y los 22 barrios de Babol se clasificaron en 8 grupos homogéneos. Los resultados del método de agrupamiento muestran que aproximadamente el 40.9% de los barrios son evaluados como muy pobres, pobres y relativamente pobres y en condiciones indeseables en general. Además, aproximadamente el 18.2% de los vecindarios están en el nivel medio y aproximadamente el 40.2% de los vecindarios se evalúan como niveles buenos, muy buenos, excelentes y muy excelentes en términos de resistencia física.
Palabras clave: Resistencia física, Terremoto, Análisis factorial, Análisis de conglomerados, Babol.
INTRODUCTION
Natural disasters are a major challenge in achieving sustainable development of human societies. Understanding the ways to achieve sustainability has been incorporated into disaster planning and management through different patterns of vulnerability reduction and it has proper position in each country's national policies to provide the conditions for efficient and effective risk reduction at different levels of management (Davis & Izadkhah, 2006: 11). A crisis is an incident that is associated with widespread physical and financial damages or causes of such damages that requires urgent action. These kinds of natural disasters leading to critical situations in society are often potentially dangerous, devastating and fatal (Alexander, 2000). Currently, more than half of the world's population lives in urban areas, and many of them live in areas threatened by potential hazards and disasters because the location of human-made settlements and other facilities is affected by the environmental and tectonic factors (Rostaei, 2011: 28).
Today, there is a significant shift in attitudes towards natural hazards globally, with the prevailing focus shifting from reducing vulnerability to increasing resilience to disasters. According to this view, risk reduction programs should seek to create and enhance the characteristics of resilient communities and address the concept of resilience in the disaster management chain (Cutter et al, 2008: 3). The attitude towards resilience and its analysis plays a key role in understanding resilience and its causes on the one hand and affects its risk reduction policies and practices and how to deal with them. In fact, this approach is aimed at reducing the vulnerability of cities and enhancing citizens' ability to cope with the dangers of threats such as natural disasters (Mitchell, 2012: 3). In the last century, the enormous damages of natural and human hazards to the environment of cities have made the concept of resilience an important area of crisis management to reduce the impact of incidents (Rezaei et al, 2015: 609., Nazemi et al, 2019). Therefore, in dealing with crises in urban planning and design, paying attention to the principle of resilience as one of the factors in creating high quality and resilient urban space enables the space to offer citizens multiple options at any time to reduce the risk and impact of the crisis (Fallah et al, 2014: 1975., Yazdi et al, 2019). Following this trend, resilience debate in urban studies sought to reduce urban damages associated with the constraints and challenges posed by urban social and economic problems (Thilo, 2011: 18). Much attention is now being paid to the capacities of disaster-stricken communities to return to the past or recover. This has brought about changes in the culture of risk reduction in the workplace with a particular emphasis on resilience rather than vulnerability (Mayunga, 2007: 1). In recent decades, the growing population of Iran, and the migration from the villages have led to the rapid growth of cities. In such situations, where the sustainable development of the cities of the country has been possible, the problems of urbanization have emerged as a sensitive and important issue (Zangiabadi et al, 2013: 138). Considering the fact that Iran is located in the Alps-Himalayas earthquake belt, it is considered as one of the young and orogenic parts of the world and is one of the earthquake-prone countries (Mohammadi Ahadiyani et al, 2010: 123).
RESEARCH OBJECTIVES AND QUESTIONS
Due to the proximity of Babol city to the active and earthquake-prone of north Alborz and the Caspian faults, the seismicity of the city and the location of old and dense urban fabric in the central neighborhoods, the presence of unauthorized and inefficient housing with low passage widths in the margin of the city and the low quality of building materials in these neighborhoods have caused about 34% of Babol's neighborhoods to have poor physical earthquake resilience. Therefore, the main purpose of this study was to analyze the physical indices in resilience and classifying the 22 neighborhoods of Babol against earthquakes. According to the stated objectives, the main questions of this research are as follows.
1. What is the situation of Babol's 22 neighborhoods in terms of physical resilience?
2. What is the situation of each of the studied neighborhoods relative to each other?
RESEARCH METHOD
This study is an applied and its research method is descriptive-analytical. In this study, after reviewing the theoretical foundations related to the physical resilience, the required information has also been extracted from the municipality and the 2016 census in Babol with the library method and by studying articles, books and electronic resources. To evaluate the physical resilience of Babol, the main variables of the study included 48 physical indicators, which were evaluated by experts including university professors in urban planning, earthquake engineering and environment as well as experts in crisis management and tested for their suitability through KMO test.
Using SPSS and GIS software programs, the factor and cluster analyses were applied for data analysis. Initially, the factors selected by factor analysis were reduced to four factors, which account for 61.9% of the variance, and then among the four factors, the first factor alone accounted for 24.8% of the variance, which is the most effective factor in this study. The fourth factor with 10.3% of the variance has the least impact. Then, using the cluster analysis method, the 22 neighborhoods of Babol were classified into 8 homogeneous groups. According to this study, the status of neighborhoods in terms of indicators is classified into 8 distinct levels including, very poor, poor and relatively poor and in undesirable conditions in general and average, good, very good, excellent and very excellent levels in desirable resilience levels. Finally, the resilience of the 22 neighborhoods of Babol city was evaluated using GIS software.
SCOPE OF RESEARCH
Babol as the second most populous city of Mazandaran province is located at 36°5′35″N 52°30′E in the north of Iran. It is located between the Caspian Sea and the Alborz Mountains, 210 kilometers northeast of Tehran. Babol has an area of about 3258 hectares and its population is 250217 according to the 2016 census. The city is divided into 2 urban districts and 22 neighborhoods (Figure 1).
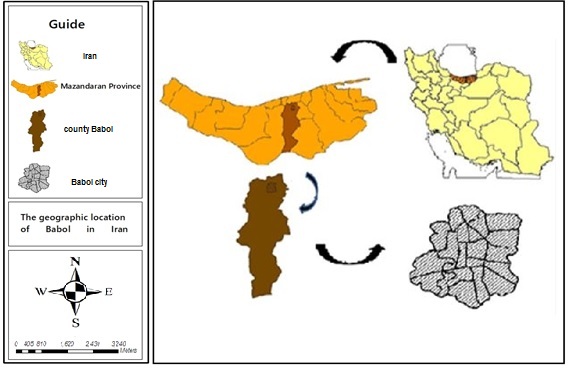
Figure 1- Location of the studied area
RESEARCH PRINCIPLES
Cities, as the most complex man-made structures, have always been exposed to natural and human hazards, and these unpredictable dangers have had serious impacts on urban areas (Eslamlou, 2016: 37). Urban development is directly related to the physical development of cities. (Ebrahimzade et al. 2014: 58) Therefore, safety against hazards and crises is one of the most basic principles for achieving optimal standards of urban comfort (Mohammadi, 2014: 53). Thus, planning to reduce earthquake crises has a relatively complex process (Allen, 2007: 607). In recent years, the expansion of urbanization has had adverse consequences on the social aspect of cities. Therefore, the dimensions of urban settlements are becoming more and more complex, and consequently, instability in urban ecosystems has emerged (Ziyari et al, 2012: 2). Evidence shows that earthquake threat is widespread worldwide in urban areas, and this threat is one of the most serious problems in the developing countries (Tucker, 1994: 10). According to the UN International Disaster Reduction Strategy, all hazards have two sources: natural hazards and technological (human-made) hazards or accidents caused by human intervention (Moe and Patharkuht 2006: 396). With the global warming process, the recurrence of natural disasters is a serious challenge for sustainable development of communities. Therefore, emergency decision-making (EDM) for natural disasters plays an important role in improving disaster (Zhou et al, 2017: 567). Earthquake has always been a threat to human life and is a major cause of damage to community infrastructure (Achour et al, 2011: 617).
Today, climate change is widely expected to alter the number, severity, and location of natural hazards that will affect the development gains of communities (Poterie, 2015: 128). For this reason, resilience especially in the face of climate change has become an important goal of cities (Merrow et al, 2016: 38).
There are two types of disaster management strategies, namely, forecasting and resiliency strategies, the first to address known problems and the second to tackle unknown problems (Normandin et al. al, 2011).
In the world's most disaster-stricken countries, the beginning of research to deal with natural disasters dates back to the early years of the 20th century. The United Nations also named the end of the twentieth century (1990-2000) an international decade for reducing the risks of natural disasters, and its experts sought to extend and exchange experiences between nations and research centers (Habibi and Javanmardi, 2011: 294). In recent years, most planning has been to counteract and reduce risks. In the meantime, resilience is a new concept that is mostly used in the face of unknowns and uncertainties (Farzad Behtash et al, 2013: 33). One of the challenges for achieving a well-defined and accepted definition of the scientific community is the fact that individuals, groups and communities may each have varying degrees of resilience that may be defined in different ways (McEntire et al, 2002: 272). That is because the dynamics and interactions between abrupt changes and resilience resourcing make it clear that resilience of complex systems is not merely resistance to change and preservation of existing structures, but, at present, resilience is the capacity of a social system in terms of absorbing disorders, reorganizing and maintaining the same function, structure, identity, and previous feedback (Folke, 2006: 256).
The word resilience is derived from the Latin root of Resilio meaning "return to the former" (Klein et al, 2003: 35) and is often used to refer to the past. Holing introduced the concept of resilience in the 1970s for the first time by publishing an article on the resilience and resilience of the ecological systems (Holing, 1973: 4). In other words, resilience refers to the capacity to withstand shocks and return to their original state of operation, or at least, sufficient resilience to prevent failure or even collapse of systems (Omand, 2005: 15). It seems that there is a consensus among researchers that resilience plays an important role in dealing with major and shocking disasters in a society (Kimhi, 2014: 3).
RESEARCH BACKGROUND
In disaster-stricken countries, research into natural disasters began in the early 20th century, For example: (Godschalk, 2003) with the publication of an article entitled Urban Risk Reduction to create resilient cities with a risk reduction policy, prioritized the development of resilient urban systems and increased collaboration between professional groups involved in urban buildings. Rose (2004) in a study defining and measuring economic resilience against earthquakes, concluded that imbalances in economic resilience depend on the behavior of individuals, markets, and macro-regional economies. She also presented major conceptual, operational, and policy-making advances in assessing individual and regional economic resilience to earthquakes.
Martinelli (2008) by publishing an article entitled Building Vulnerability Assessment and Providing Damage Scenarios for Italian Cities assessed the vulnerability of buildings by using vulnerability assessment models such as the Risk-UE model, and finally presented different scenarios estimated and modeled the damages caused by possible earthquakes. Berk et al (2012), in a study entitled Planning for Resilience with a Risk Reduction Approach and Adoption of Accident Law, provided a way in urban resilience studies that planners act to enhance the existing resilience components by adopting the law in the city.
Meerow et al (2016), Taghizadeh Farahmand (2018) and AL-Khafaji (2019) stated in a review of the definition of urban resilience that resilience has become an important goal of cities today especially in the face of climate change. This paper identifies six concepts of fundamental urban stress and finally proposes a new definition of resilience. Carreño et al (2017) in a study called Comprehensive Disaster Risk Assessment for a Urban Risk Management Program, provided a comprehensive approach to assess the physical, economic and social vulnerability of the earthquake in Manizales, Colombia and the results of this comprehensive action plan are recommended to update disaster risk management action plan for the city.
There have also been numerous studies by Iranian researchers in the context of physical resilience. Heydari et al (2014) with an article titled the factors affecting Rasht people's preparedness for disaster through factor analysis concluded that by strengthening two factors of promoting public rescue education and increasing government support, Rasht people preparedness to respond to natural disasters could be promoted. Nazmfar and Pashazade (2015) evaluated Ardabil city's resilience to natural hazards through factor analysis and statistical mean test. Findings show that the highest mean is related to physical dimension with the value of 3.57 and the lowest is institutional dimension with the value of 2.94.
Mohamadi and Ahadnejad (2015) and Saber Mahani (2019) in a research entitled Physical Resilience Assessment of Zanjan City against Earthquake using a multidimensional decision-making model to evaluate physical resilience in 25 urban areas of Zanjan and the results show that the north and northeast areas have high resilience. Sarvar and Kashani(2016) in an article entitled Physical Vulnerability Assessment of Ahar City against Earthquake Crisis, used15 indicators in three spectra of structural, planning and natural indices. The results show that about 30% of Ahar's urban built-up areas have moderate to high vulnerability to earthquake and do not provide a proper physical structure for earthquake crisis management. Shokri (2017) by publishing an article surveyed the resilience of Babol districts against environmental hazards through questionnaires in 4 dimensions, 16 indices and 31 sub-indices and through VIKOR multivariate decision-making model. They concluded that there is difference among 12 districts of Babol and about 50% of the districts in Babol have no and low resilience and only 25% of the districts are fully resilient in terms of indicators.
RESEARCH DATA AND RESULTS
Factor analysis method
Factor analysis is one of the multivariate methods the main purpose of which is to classify the variables into several factors and ultimately to better understand the phenomena and their correlation. In this study, first, factor analysis was used to investigate the status of physical indices in the Babol Neighborhoods (Table 1).
| 1 | % Residential context | 25 | Number of hazardous centers |
| 2 | Land use | 26 | Population densities less than 100 people per hectare (very low vulnerability) |
| 3 | Presence of faults | 27 | Population density of 100 to 200 people per hectare (low vulnerability) |
| 4 | Landslide zone | 28 | Population density of 200 to 300 people per hectare (moderate vulnerability) |
| 5 | Length of riparian zone | 29 | Population density of 300 to 400 people per hectare (high vulnerability) |
| 6 | % of Buildings under ten years | 30 | Population densities more than 400 people per hectare (very high vulnerability) |
| 7 | % old context | 31 | Residential area under 100m (very high vulnerability) |
| 8 | Access to public transport networks | 32 | Residential area of100 to 150 m (high vulnerability) |
| 9 | % Water network vulnerability | 33 | Residential area of 150 to 200 m (moderate vulnerability) |
| 10 | % Electricity network vulnerability | 34 | Residential area of 200 to 250 m (low vulnerability) |
| 11 | % Gas network vulnerability | 35 | Residential area of more than 250 m (very low vulnerability) |
| 12 | % Telephone network vulnerability | 36 | % Buildings with steel and concrete structure materials |
| 13 | % Mobile network vulnerability | 37 | % Brick & Iron Buildings |
| 14 | Average passage width | 38 | % Buildings with cement block material |
| 15 | Number of hospital beds | 39 | % Buildings with brick and wood materials |
| 16 | % openness of passages over 10 meters | 40 | % Buildings with clay materials |
| 17 | % of open space | 41 | Acceleration applied during an earthquake with 109 year return period |
| 18 | The number of firefighting vehicles | 42 | Acceleration applied during an earthquake with 475 year return period |
| 19 | % of Buildings with more than 5 floor | 43 | Acceleration applied during an earthquake with 950 year return period |
| 20 | Number of security centers | 44 | Acceleration applied during an earthquake with 2500 year return period |
| 21 | Number of Ambulances | 45 | % of buildings with very high importance |
| 22 | Backup bases | 46 | % of buildings with high importance |
| 23 | Military and law enforcement agencies | 47 | % of buildings with medium importance |
| 24 | KMO Sample adequacy test 0.699 Bartlett test Approximate chi-square 540.56 Degree of freedom (Df) 45 Significance level (Sig) 0.000 Surface water depth | 48 | % of buildings with low importance |
Prior to the implementation of factor analysis, the suitability of the data set for this analysis was assessed by BTS and KMO tests. The value of KMO obtained is 0.699, indicating that the selected indices are satisfactory for using factor analysis technique. The Bartlett's Test of Sphericity examines the assumption of data relevance, with a Bartlett value of 540.56, which is significant at the 1% level. Therefore, the data was desirable for factor analysis (Table 2).
| KMO Sample adequacy test | 0.699 | |
| Bartlett test | Approximate chi-square | 540.56 |
| Degree of freedom (Df) | 45 | |
| Significance level (Sig) | 0.000 | |
The results of factor analysis method show that four factors with eigenvalues higher than one are selected as the main factors. After factor rotation by varimax method, physical indices are classified into four factors. These four factors can explain approximately 61.9% of the variance of the variables. As stated above, all four factors have eigenvalues greater than one, but they are not all equally important. The most important factor is factor (1), which accounts for 24.789% of the variance. The second to fourth factors account for 16.244%, 10.564% and 10.304% of the variance, respectively. Because the eigenvalues of the next components are less than (1), these numbers are not significant and cannot be used in subsequent analyses. Table 4 lists the eigenvalues of these four main factors and the remaining factors (Table 3).
| Factors | Eigenvalues | Without Rotation of eigenvalues of the extracted factors | Rotation of eigenvalues of the extracted factors | ||||||
| Total | Variance | Cumulative(Percent) | Total | Variance | Cumulative(Percent) | Total | Variance | Cumulative(Percent) | |
| 1 | 12.409 | 26.977 | 26.977 | 12.409 | 26.977 | 26.977 | 11.403 | 24.789 | 26.589 |
| 2 | 7.319 | 15.910 | 42.887 | 7.319 | 15.910 | 42.877 | 7.472 | 16.244 | 41.034 |
| 3 | 5.205 | 11.314 | 54.201 | 5.205 | 11.314 | 54.201 | 4.860 | 10.564 | 51.598 |
| 4 | 4.559 | 9.912 | 64.113 | 4.559 | 9.912 | 64.113 | 4.740 | 10.304 | 61.902 |
Factor 1: As shown in Table 4, the eigenvalue of this factor is 11.403, which alone accounts for 24.789% of the variance and has the highest effect among the four factors. According to Table 5, 15 indices were loaded in the first factor covering 31.25% of all indices. In this factor, the three indices, percentage of gas network vulnerability,
percentage of open space in the neighborhood, as well as landslide zone had the highest load, respectively (Table 4).
| Variance | Row | Indicators of each neighborhood | The amount of factor load | |
| 1 | 12.224 | 1 | Landslide zone | 0.819 |
| 2 | % Electricity network vulnerability | 0.532 | ||
| 3 | % Gas network vulnerability | 0.877 | ||
| 4 | No of hospital beds | 0.506 | ||
| 5 | % of open space | 0.876 | ||
| 6 | Number of security centers | 0.563 | ||
| 7 | Number of hazardous cente | 0.425 | ||
| 8 | Low vulnerability in terms of population density (Between 100 and 200 people per hectare) | 0.616 | ||
| 9 | Average vulnerability in terms of population density between 200 and 300 people per hectare)) | 0.362 | ||
| 10 | Very high vulnerability in terms of population density More than people per hectare)) | 0.511 | ||
| 11 | Very high vulnerability of buildings under 100m | 0.474 | ||
| 12 | % Buildings with steel and concrete structure materials | 0.314 | ||
| 13 | Acceleration applied during an earthquake with 109 year return period | 0.651 | ||
| 14 | Acceleration applied during an earthquake with 950 year return period | 0.452 | ||
| 15 | % of buildings with very high importance | 0.656 |
Factor 2: The eigenvalue of this factor is 7.472, which accounts for 16.244% of the variance. According to Table 6, 13 indices were loaded for the second factor, accounting for 27% of all physical indices. In this factor, the presence of backup base and crisis management and the percentage of buildings with clay materials have the highest amount of operational load (Table 5).
| Variance | Row | Indicators of each neighborhood | The amount of factor load | |
| 2 | 9.856 | 1 | Land use | 0.487 |
| 2 | % of Buildings under ten years | 0.406 | ||
| 3 | % Telephone network vulnerability | 0.456 | ||
| 4 | % Mobile network vulnerability | 0.539 | ||
| 5 | Number of Ambulances | 0.461 | ||
| 6 | Backup and crisis management base | 0.681 | ||
| 7 | Very low vulnerability in terms of population density (less than 100 people per hectare) | 0.524 | ||
| 8 | High vulnerability of buildings with 100-150m area | 0.395 | ||
| 9 | Very low vulnerability of buildings over 300m | 0.511 | ||
| 10 | Percentage of buildings with clay materials | 0.631 | ||
| 11 | Acceleration applied during an earthquake with 475 year return period | 0.451 | ||
| 12 | Acceleration applied during an earthquake with 2500 year return period | 0.554 | ||
| 13 | % of buildings with high importance | 0.513 |
Factor 3: According to Table 4, the eigenvalue obtained in this factor is 4.860, accounting for 10.564% of the variance. Ten indices are loaded on the third factor covering 20.8% of the total studied indices. In this factor, the three indicators of military and law enforcement centers, the percentage of buildings over 5 floors, and the (high) population density vulnerability are the most common factors (Table 6).
| Variance | Row | Indicators of each neighborhood | The amount of factor load | |
| 3 | 9.439 | 1 | Length of riparian zone | 0.461 |
| 2 | Average passage width | 0.470 | ||
| 3 | % openness of passages over 10 meters | 0.511 | ||
| 4 | % of buildings over 5 floors | 0.567 | ||
| 5 | military and law enforcement centers | 0.635 | ||
| 6 | High vulnerability in terms of population density (between 300 and 400 people per hectare) | 0.547 | ||
| 7 | % Buildings with brick and wood materials | 0.406 | ||
| 8 | %Buildings with cement block material | 0.343 | ||
| 9 | % of buildings with average importance | 0.336 | ||
| 10 | % of buildings with low importance | 0.421 |
Factor 4: The eigenvalue of this factor is 4.740, which comprises 10.304% of the variance. In this factor, 10 indices were loaded, accounting for 20.8% of all physical indices in this study. In the fourth factor, the three indices of access to public transport networks, percentage of water network vulnerability and surface water depth have the highest factor load. (Table 7).
| Variance | Row | Indicators of each neighborhood | The amount of factor load | |
| 4 | 9.008 | 1 | % Residential context | 0.423 |
| 2 | The existence of fault or fault zone | 0.382 | ||
| 3 | % old context | 0.341 | ||
| 4 | access to public transport networks | 0.610 | ||
| 5 | percentage of water network vulnerability | 0.542 | ||
| 6 | The number of firefighting vehicles | 0.471 | ||
| 7 | Depth of surface water | 0.511 | ||
| 8 | Moderate vulnerability of buildings between 150 and 200 meters | 0.390 | ||
| 9 | Low vulnerability of buildings between 200 and 300 meters | 0.372 | ||
| 10 | % of buildings with brick and iron materials | 0.337 |
Cluster Analysis Method
In this method, the neighborhoods with most similarity in terms of factor scores are classified in the same cluster. The neighborhoods are then subdivided into levels with the least intra-group and highest inter-group differences. Therefore, cluster analysis as one of the most commonly used methods for classifying villages, districts and cities is used to classify Babol city neighborhoods in terms of physical indices. This method allows the researcher to classify the studied subjects in different ways based on the homogeneity between them and then to interpret and explain the results (Table 8).
| Status | % | Number of neighborhoods | % of neighborhoods | Population | Population % | ||
| 4, 12, 18 | Quiet poor | Undesirable | 40.9 | 3 | 13.6 | 19506 | 7.7 |
| 17, 13, 1 | Poor | 3 | 13.6 | 26855 | 10.7 | ||
| 15, 9, 5 | Relatively poor | 3 | 13.6 | 39284 | 15.6 | ||
| 14, 7, 2, 3 | Moderate | Average | 18.2 | 4 | 18.2 | 48366 | 19.3 |
| 6, 19 | Good | Desirable | 40.9 | 2 | 9 | 27211 | 10.8 |
| 16, 10 | Very good | 2 | 9 | 23761 | 9.4 | ||
| 8, 22, 12 | Excellent | 3 | 13.6 | 35954 | 14.3 | ||
| 20, 11 | Very excellent | 2 | 9 | 30640 | 12.2 | ||
| Total | 100 | 22 | 100 | 250217 | 100 | ||
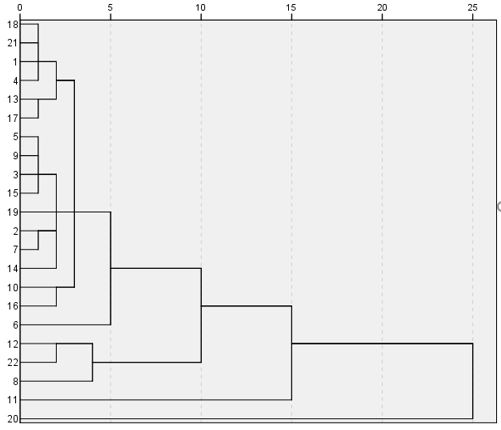
Graph 1- Clustering the 22 neighborhoods of Babol city by dendrogram in terms of degree of enjoyment
As can be seen in Fig. 1 and Table 9, in this classification, neighborhoods within one level are very similar but differ from those located on another level. It is also noted that neighborhoods 4, 18 and 21, which comprise about 7.7% of the total population of Babol, are in very poor condition. These neighborhoods were located almost in the central part of the city. Most of their context is old, have low passageways and their average lifespan is more than 50 years. In addition, due to the low open space and high water level, these three neighborhoods are in very poor physical condition.
The study shows that the three neighborhoods 1, 13 and 17 comprise about 10.7% of the total population of Babol. Neighborhood 1 is in the north of the city and neighborhood 13 in the south and neighborhood 17 in the west, all of which have marginal and often old context with undesirable materials. Most of its residents are middle-income and low-income and have poor access to security and health services. These three neighborhoods are generally in poor physical resilience.
Moreover, according to Table 9, the three neighborhoods 5, 9 and 15, which comprise about 15.6% of the city's population, are not in good physical condition. Neighborhood 5 is located in old context, neighborhood 9 is on the eastern margin and neighborhood 15 is in the southwest of the city. These neighborhoods have inadequate land use distribution. For example, it is observed in the field observations that these neighborhoods do not include parks and open spaces and have limited access to relief and health facilities. Therefore, in terms of physical dimension, these neighborhoods are in relatively poor resilience. Genrally, the 9 neighborhoods, which comprise about 40.9% of the neighborhoods and about 34% of the total population of Babol, have poor physical resilience.
Surveys show that the four neighborhoods, 2, 3, 7 and 14 have moderate physical resilience, accounting for 19.3% of the total population of Babol. These neighborhoods are mainly located in the northeast of the city and have relatively open spaces, with adequate electricity and gas networks and relatively low population density. Generally, they have moderate physical resilience.
Besides, neighborhoods 6 and 19, which comprise about 10.8% of the city's population, are in good physical condition. In recent years, most of the buildings in neighborhood 6 have been renovated and access to desirable communications networks has been provided. Moreover, most of the buildings in neighborhood19 have good material quality and access to open spaces with desirable passageways is desirable. Generally, these two neighborhoods have proper physical resilience.
The results show that two neighborhoods 10 and 16 with a population of about 9.4% of the total population of the city are in very good condition. In these neighborhoods, population density is low, there is high distance to hazardous installations and they enjoy favorable construction quality that made the two neighborhoods have very good physical resilience.
The results of this study also show that the three neighborhoods of 8, 12 and 22, which comprise 14.3% of the population of Babol, are in excellent condition. Field findings and observations show that most of the buildings in these localities are concrete. Moreover, most of the area in these neighborhoods is less than 300 meters and population density is less than 200 people per hectare. These features have made these neighborhoods have excellent physical resilience.
Finally, the two neighborhoods 11 and 20, with 12.2% of the city's population, are in very excellent condition. Statistics show that most of the buildings in these neighborhoods have metal skeletons and plots of less than 100 meters and a population density of less than 100 people per hectare. Buildings are less than 10 years old and the access to open spaces is less than 50 meters. The proximity to medical and relief centers has also put the two neighborhoods in very excellent physical condition. Totally, nine neighborhoods, which comprise about 46.7% of the total population of the city, are in desirable resilience (Figure 3).
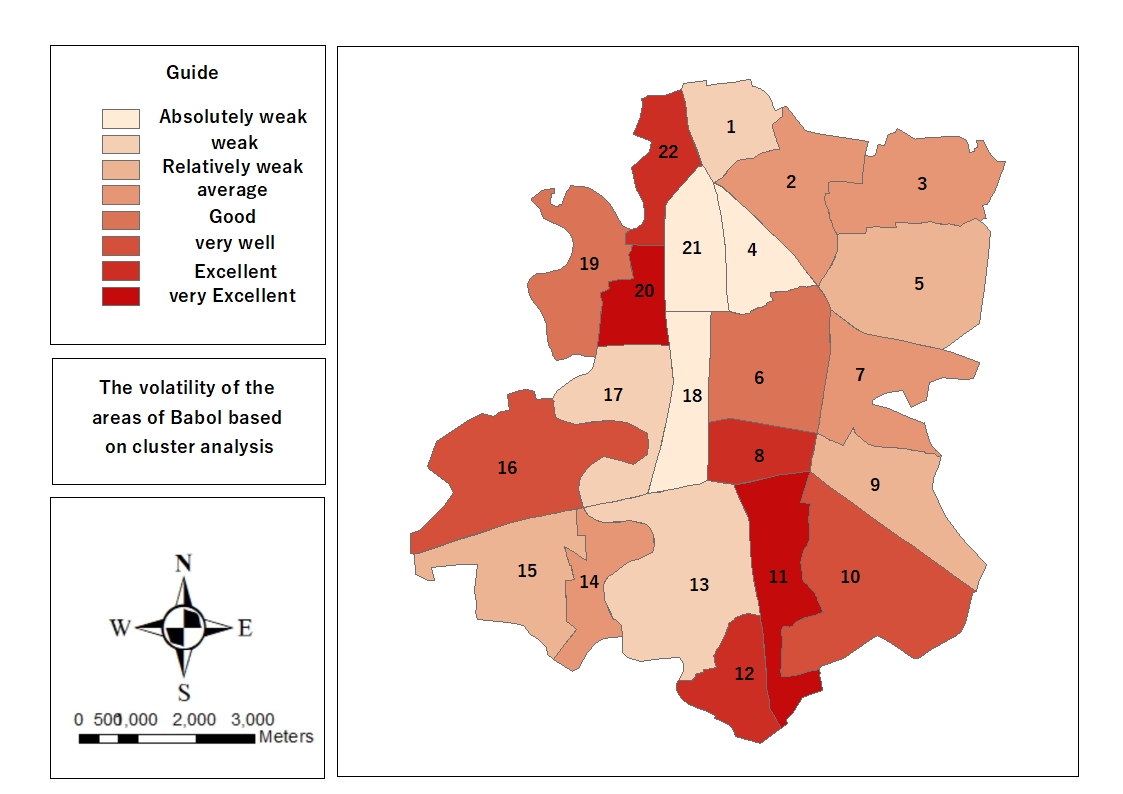
Figure 2 - Physical resilience status of Babol neighborhoods against earthquakes in terms of cluster analysis
CONCLUSION AND RECOMMENDATIONS
In this study, it attempts have been made to evaluate 48 effective indicators on physical resilience of Babol city in earthquake disaster using factor analysis and cluster analysis methods. The selected indices were reduced to four factors with factor analysis that accounted for 61.9% of the variance. Among the four factors, the first factor alone accounted for 24.8% of the variance, which is the most influential factor in the study, and the fourth factor with 10.3% of the variance has the least effect. Cluster analysis was used to classify neighborhoods homogeneously and Babol's 22 neighborhoods were classified into 8 homogeneous groups. The results of the clustering method show that about 40.9% of the neighborhoods were evaluated in three levels of quiet poor, poor and relatively poor and undesirable condition as a whole. Moreover, about 18.2% of the neighborhoods are in the moderate level and about 40.2% of the neighborhoods are classified as good, very good, excellent and very excellent levels and had desirable physical dimension.
The results of this study show that 34% of Babol’s population, with about 85,600 people, lives in nine neighborhoods with poor physical resilience. Three neighborhoods 4, 18 and 21 are located in the central districts and are characterized with features such as low-passage width, old context andhigh water level. Also, six neighborhoods in the south and west of Babol have non-native and immigrant residents. Indicators such as dense context with poor materials, lack of access to open spaces, high population density, and being away from health and relief centers have resulted in about 40% of Babol's neighborhoods having poor physical resilience.
Besides, four neighborhoods with a population of 48300, comprising 19.3% of the population of Babol, are in moderate resilience. Most of these neighborhoods are in the northeast of Babol. The characteristics of these neighborhoods are the average age of the buildings, the relative population density of 200 to 300 people per hectare, the relative availability of open spaces, the proper land use and the somewhat suitable building materials that comprise approximately 18% of all neighborhoods.
The study shows that 9 neighborhoods with a population of 116850 make up about 46.7% of the population of Babol. Since most of the buildings in these neighborhoods are renovated, most of the desirable building materials, including steel, iron and brick, have been used. There are also indicators such as access to open spaces and treatment centers, low building density, and distance from hazardous zones. Consideration of physical infrastructure has made these neighborhoods desirable in terms of physical resilience. Based on surveys on the vulnerability of physical indices of neighborhoods as well as field observations and studies of documents available in the municipality, the age of buildings in the old context including 6, 8, 18 and 5 neighborhoods is high and it is necessary to upgrade quality of buildings as well as the worn-out water, electricity and telephone networks for any planning because these sites are most vulnerable to earthquakes based on the studied indicators.
The results also show that neighborhoods in the east and southeast have unauthorized context with the majority of low-income and middle-income settlers. Improvement of services such as the establishment of desirable health centers, the development of parks and outdoor areas, the enhancement of relief and security centers are important priorities. This study shows that neighborhoods in the north and northwest of Babol including neighborhoods 19, 20 and 22 are in desirable physical conditions due to construction principles and attention to open spaces, low population density, low age of buildings and high quality of materials.
Finally, the framework presented in this study can be used because it has the capability to measure and evaluate physical resilience in other cities. The following factors are suggested to enhance physical resilience in the studied neighborhoods.
1. Reinforcing critical buildings located in neighborhoods with poor resilience especially neighborhoods 4, 8 and 21 as well as restoring the old contexts using high quality materials, enhancing proper use and proper access to relief centers, emergency and fire department.
2. Establishing several relief and treatment centers in neighborhoods 9 and 14 for easy access to the east and west margins of these centers.
3. Due to the high resilience of neighborhoods in the northwest, it is suggested the Urban areas to these neighborhoods be developed to avoid overcrowding of other vulnerable neighborhoods.
4. Creating areas for emergency landing and air rescue, especially in downtown neighborhoods (6, 8 and 18) to accelerate rescue operations
5. Separating the routes of critical arteries crossing the neighborhoods to reduce the potential hazards during an earthquake
6. Strict application of the laws to retrofit old buildings and increase the safety factor of new constructions
7. Expanding and strengthening scientific and research studies to identify and reduce the risks of natural disasters with earthquake priority
8. Detailed study of the vulnerability of neighborhoods during an earthquake and preparing neighborhood vulnerability maps
9. Creating and locating safe havens and shelters in the event of an earthquake
10. Supporting NGOs and enhancing public participation in preparing them for earthquake crisis and actively participating in national and international networks and sharing experiences to enhance urban resilience
REFERENCES
ACHOUR, N., MIYAJIMA, M., KITARA. M., PRICE, A. Earthquake - Induced structural and Nonstructural Damage in Hospitals. 2011. Earthquake spectra. 27(3) : 617-634.
ALEXANDER, DAVID. Principles of Emergency and management. Oxford: University Press, 2000.
AL-KHAFAJI, WADHAH MAHMOOD SHAKIR., AL-DABBAGH, HAYDER ABDUL ZAHRA A geophysical correlation between near-surface radioactivity and subsurface faults detected by gravity method for a region located in the western desert of Iraq. 2019. Iranian Journal of Earth Sciences, 11(2) pp 95-103.
ALLEN, R. M. Earthquake Hazard Mitigation: New Directions and opportunities, university of California Berkeley, Berekeley, CA, USA: 607-647, 2007.
CARREÑO, M. L. et al. Holistic Disaster Risk Evaluation for the Urban Risk Management Plan of Manizales, Colombia. Int J Disaster Risk Sci 8, 258–269 (2017). https://doi.org/10.1007/s13753-017-0136-7
CUTTER,S. L. et al. A Place-based model for understanding Community resilience to natural disasters. 2008. Global Environmental Change . 18 : 598-606.
DAVIS, I.; Y. IZADKHAH. Building resilient urban Communities. 2006. OHE . 31(1):11-21 .
ESLAMLOU. M; MIRMOGHTADEE. M. Evaluation of urban Resiliency in physico structural Dimension of Karaj Metropolis. 2016. Space ontology International Journal, 6(1) : 37-46.
FALLAH, M., MOHAMMAD NAVAEI, A. The Role of Designing Flexible and Resilient Urban Spaces in Crisis Management, 2014. Fifth International Conference on Comprehensive Management of Natural Critics (INDM-2014)
FARZAD BEHTASH, M. R.; KINEJAD, M. A.; PIRBABAIE, M. T.; ASGARI, A. Evaluating and Analyzing the Resilience Dimensions and Components of Tabriz Metropolitan Area. 2013. Fine Arts Journal 18 (3): 33-42.
FOLKE, C. Resilience: the emergence of a perspective for social ecological systems analyses. 2006. Global Environmental Change. 16(3):253-267.
GODSCHALK, D. Urban Hazard mitigation: creating Resilient cities. 2003. Natural Hzazard Reviw: 136-143.
HABIBI, K.; JAVANMARDI, K., , Analysis of urban context instability and zoning of earthquake vulnerability using GIS & AHP (Case Study: Part of Central Core of Sanandaj). 2011. ArmanShahr Journal of Architecture and Urban Development. 11: 293-305.
HOLING, C. S. Resilience and stability of Ecological systems. 1973. Annual Review of Ecology and systematics. 1(4): 1-23.
MARTINELLI A., CIFANI G. Bulding Vulnerability Assessment and Damage scenarios incelano (Italy) using a Quick Survey Data - based methodology. 2008. Soil Dynamics and Earthquake Engineering, 28: 875-889.
MAYUNGA, J. S. Understanding and applying the concept of community disaster resilience: A capital based approach. A draft working paper prepared for the summer academy for social vulnerability and resilience. 2007. Building, 22, July, Munich, Germany. 1: 1-16.
McENTIRE, D. A. et al. A comparison of disaster paradigms: the search for a holistic policy guide. 2002. Public Administration Review, 62(3):267-281.
MEEROW, S.; NEWLLE, J.; STULTS. M. Defining urban resilience: a review. 2016. Landscape and Urban planning. 147: 38-49.
MITCHELL, T., HARRIS, K. Resilience: a risk management approach. 2012. Overseas Development Institute. 1-7.
MOE, T. L; PATHRANAKUL, P. An Integrated Approach to Natural Disaster Prevention and Management, Emerald Group Publishing Limited of natural hazards. 2006. Geographical Review. 15 (3): 396-413.
MOHAMMADI AHMADIAN, J.; SAHRAIAN, Z.; KHOSRAVI, F. The Role of Factors Affecting Physical Vulnerability of Jahrom City to Earthquake. 2010. Journal of Geographical Sciences Applied Research, 17: 121-143.
MOHAMMADI DEHCHESHMEH, M. Karaj Urban Permeability Assessment of Hazards. 2014. Journal of space planning and development 18 (3): 53-77.
NAZEMFAR, H.; PASHAZADEH, A. Evaluation of Urban Resilience against Natural Hazards, Case Study: Ardabil City. 2015. Journal of Space Geography, 8: 101-116.
NAZEMI, E.; ARIAN, M.A.; JAFARIAN, A.; POURKERMANI, M.; YAZDI, A. Studying The Genesis Of Igneous Rocks In Zarin-Kamar Region (Shahrood, Northeastern Iran) By Rare Earth Elements. 2019. Revista Gênero e Direito, 8(4), 446-466. DOI: https://doi.org/10.22478/ufpb.2179-7137.2019v8n4.48442.
NORMANDIN, J. M.; THERRIEN, M. C.; TANGUAY, G. A. City strength in times of turbulence: strategic resilience indicators. Urban Affairs Association 41st Conference, New Orleans, 2011.
OMAND, D. Developing national resilience. 2005. The RUSI Journal. 150(4):14-18.
POTERIE. A.; BAUDOIN, M. From Yokohama to Sendai: Approaches to participation in International Disaster Risk Reduction. 2015. Frameworks lnt j Disaster Risksci. 6: 128-139.
REZAEI, M.; RAFIIYAN M.; HOSSEINI, SM. Measurement and Evaluation of Physical Resilience of Urban Communities against Earthquake (Case Study: Tehran Neighborhoods. 2015. Journal of Human Geographical Research, 94: 609-623.
ROSE; A. Defining and measuring economic resilence to disasters. 2004. Disaster Prevention and Management. 13: 307-314.
ROSTAEI, S. H. Hazard zonation of Tabriz Fault for Different Urban Land Uses. 2010. Geography and Development Quarterly 9 (21): 19-21.
SABER MAHANI, S.; KHALILI, M. Thermal anomalies detection before earthquake using three filters (Fourier, Wavelet and Logarithmic Differential Filter), A Case study of two earthquakes in Iran. 2019. Iranian Journal of Earth Sciences. 11(1) 38-46.
SARVAR, H.; KASHANI, A. S. L. A. Assessment of Physical Vulnerability of Ahar City Against Earthquake Crisis. 2016. Journal of Environmental Management Quarterly 9 (34): 87-108.
SHOKRI, P. Spatial Analysis of Resilience of Babol Regions to Environmental Hazards. 2017. Journal of Physical Development Planning, 2 (2): 27-44.
TAGHIZADEH FARAHMAND, F.; AFSARI, N. Variation of Lithosphere-Asthenosphere boundary beneath Iran by using S Receiver function. 2018. Iranian Journal of Earth Sciences, 10(1) p. 11-19.
THILO, L. Urban Resilience and Vew. Institutional Theory: a happy couple for urban and Regional Studies. 2011. German Annual of spatial Research and policy, p. 15-24.
TUCKER, B. E. Some Remark Concerning Worldwide Earthquake Hazard and Earthquke Hazard mitigation. 1994. Issues in urban Earthquake Risk, p. 1-10.
YAZDI, A. et al. Magmatic interactions as recorded in plagioclase phenocrysts of quaternary volcanics in SE Bam (SE Iran). 2019. Iranian Journal of Earth Sciences, 11(3): 215-224.
ZANGI, A. et al. Assessment of vulnerability of earthquake crisis central part of Iranian metropolitan cities using IHWP model (Case study: Isfahan District 3) 2013. Journal of Space Geography, 8: 137-156.
ZIYARI, K. et al. Prioritizing immunization of the old context of Karaj metropolitan area using multi-criteria evaluation model. 2012. Journal of Human Geography Research, 79: 1-14.
ZHOU L, et al. Emergency decision making for natural disasters: An overview. 2017. International Journal of Disaster Risk Reduction. 27 567-576.