Artículos
Automatic segmentation of epidural hematomas using a computational technique based on intelligent operators: a clinical utility
Segmentación automática de hematomas epidurales usando una técnica computacional, basada en operadores inteligentes: utilidad clínica
Automatic segmentation of epidural hematomas using a computational technique based on intelligent operators: a clinical utility
Archivos Venezolanos de Farmacología y Terapéutica, vol. 37, no. 4, pp. 320-325, 2018
Sociedad Venezolana de Farmacología Clínica y Terapéutica

This work is licensed under Creative Commons Attribution-NonCommercial-NoDerivs 4.0 International.
Abstract:
This paper proposes a non-linear computational technique for the segmentation of epidural hematomas (EDH), present in 7 multilayer computed tomography brain imaging databases. This technique consists of 3 stages developed in the three-dimensional domain. They are: pre-processing, segmentation and quantification of the volume occupied by each of the segmented EDHs. The pre-processing stage is divided into two phases. The first one, called the definition of a volume of interest (VOI), a band thresholding algorithm is used which allows, fundamentally, to isolate the EDH considered from the rest of the surrounding anatomical structures. In the second phase, filtering, a bank of computational algorithms is applied to reduce the impact of the artifacts and attenuate the noise present in the images. The algorithms that make up this phase are: the morphological erosion filter (MEF) and the median filter (MF). On the other hand, during the segmentation stage a clustering algorithm, called Region Growing (RG), is implemented and it is applied to the pre-processed images. The RG requires for its initialization a seed voxel whose coordinates are obtained automatically through the training and validation of intelligent operators based on support vector machines (SVM). Due to the high sensitivity of the RG to the location of the seed, the SVMs are implemented as highly selective binary classifiers. On the other hand, in order to compensate for the effect of the MEF the EDH, which has been preliminarily segmented, is submitted to the application of a morphological dilation filter of binary type (MDF). To make value judgments about the performance of the proposed technique, the EDH dilated segmentations, obtained automatically, and the EDH segmentations, generated manually by a neurosurgeon, are compared using the Dice coefficient (Dc). The combination of parameters linked to the highest Dc value, allows to establish the optimal parameters of each of the computational algorithms that make up the proposed nonlinear technique. The obtained results allow to report a Dc superior to 0.90 which indicates a good correlation between the manual segmentations and those produced by the computational technique developed. Finally, as an immediate clinical application, considering the automatic segmentations, the volume of each hematoma is calculated considering both the voxel size of each database and the number of voxels that make up the segmented hematomas.
Keywords: Brain Tomography, Epidural Hematomas, Nonlinear Computational Technique, Smart Operators, Segmentation.
Resumen:
Mediante este trabajo se propone una técnica computacional no lineal para la segmentación de hematomas epidurales (EDH), presente en 7 bases de datos de imágenes cerebrales de tomografía computarizada multicapa. Esta técnica consta de 3 etapas desarrolladas en el dominio tridimensional. Ellas son: pre-procesamiento, segmentación y cuantificación del volumen que ocupa cada uno de los EDH segmentados. La etapa de pre-procesamiento se divide en dos fases. En la primera, denominada definición de un volumen de interés (VOI), se emplea un algoritmo de umbralización por bandas el cual permite, fundamentalmente, aislar el EDH considerado del resto de estructuras anatómicas circundantes. En la segunda fase, identificada como filtrado, se aplica un banco de algoritmos computacionales para disminuir el impacto de los artefactos y atenuar el ruido presente en las imágenes. Los algoritmos que conforman esta fase son: el filtro de erosión morfológica (MEF) y el filtro de mediana (MF). Por otra parte, durante la etapa de segmentación se implementa un algoritmo de agrupamiento, denominado crecimiento de regiones (RG), el cual es aplicado a las imágenes pre-procesadas. El RG requiere para su inicialización un vóxel semilla cuyas coordenadas se obtienen, automáticamente, mediante el entrenamiento y validación de operadores inteligentes basados en máquinas de soporte vectorial de mínimos cuadrados (LSSVM). Debido a la alta sensibilidad que tiene el RG a la localización de la semilla las LSSVM se implementan como clasificadores binarios altamente selectivos. Por otra parte, a fin de compensar el efecto del MEF el EDH, segmentado preliminarmente, es sometido a la aplicación de un filtro de dilatación morfológica de tipo binaria (MDF). Para emitir juicios de valor acerca del desempeño de la técnica propuesta, mediante el coeficiente de Dice (Dc) se comparan las segmentaciones dilatadas del EDH, obtenidas automáticamente, con las segmentaciones del EDH generadas, por un neurocirujano, de manera manual. La combinación de parámetros vinculadas con el Dc más elevado, permite establecer los parámetros óptimos de cada una de los algoritmos computacionales que conforman la técnica no lineal propuesta. Los resultados obtenidos permiten reportar un Dc superior a 0.90 lo cual indica una buena correlación entre las segmentaciones manuales y las producidas por la técnica computacional desarrollada. Finalmente, como una aplicación clínica inmediata, las segmentaciones automáticas permite el cálculo del volumen de cada hematoma considerando tanto el tamaño del vóxel de cada base de datos como el número de vóxeles que conforman los hematomas segmentados. Este volumen es extremadamente importante puesto que es el parámetro que indica si el paciente debe ser sometido o no a una intervención quirúrgica a efectos de abordar los referidos hematomas.
Palabras clave: Tomografía cerebral, Hematomas epidurales, Técnica computacional no lineal, Operadores inteligentes, Segmentación.
Introduction
The segmentation of anatomical structures of the human brain, present in images acquired by any imaging modality, constitutes the starting point for the diagnosis of a high number of diseases or pathologies that affect the brain, among these are intracranial hematomas which can be classified in various ways1,2. On the other hand, digital neural images are accompanied by various imperfections such as noise and artifacts3,4,5. These imperfections become real challenges, when computational strategies are implemented to generate the morphology (normal or abnormal) of the mentioned structures.
Additionally, when reviewing the state of the art regarding the segmentation of EDH, the works described below were found. The work described by Liao et al.6 shows an automatic computational technique for the segmentation of cerebral hematomas, considering the modality of multiscale computer tomography (MSCT). The aforementioned technique consists of: a) Application of a filtering stage, based on the maximum filter (MaxF) and the mean filter (MF). b) Use of multiresolution Gaussian pyramids (MRGP) generated from the filtered images. c) Implementation of multiresolution level sets (MRLS) to obtain the EDH segmentations. They report an average Dice coefficient7 of 0.9140 for the segmented EDHs.
Recently, Kamnitsas et al.8, reported an automatic technique based on convolutional neural networks, that apply deep learning, for the segmentation of space-occupying lesions that include EDHs present in multimodality medical images. They report a Dice Coefficient (Dc) greater than 0.90 in the segmentation of this type of injury.
On the other hand, the present work presents a non-linear computational technique (NLCT) for the segmentation of epidural hematomas, present in 7 databases conformed by three-dimensional brain images of MSCT. The aforementioned technique considers the stages of pre-processing, segmentation, post-processing and quantification of EDH, via volume occupied by the hematoma in the skull.
Materials and methods
A. Database: The databases (DB) used were supplied by the Central Hospital of San Cristóbal-Táchira-Venezuela. They were acquired through the MSCT modality and are constituted by three-dimensional images (3D), corresponding to the anatomical structures present in the head of 7 male patients.
B. Proposed computational technique for the automatic segmentation of epidural hematomas
In figure 1, a schematic diagram synthesizes the methods that make up the proposed technique, in the present investigation, to segment the aforementioned hematomas.
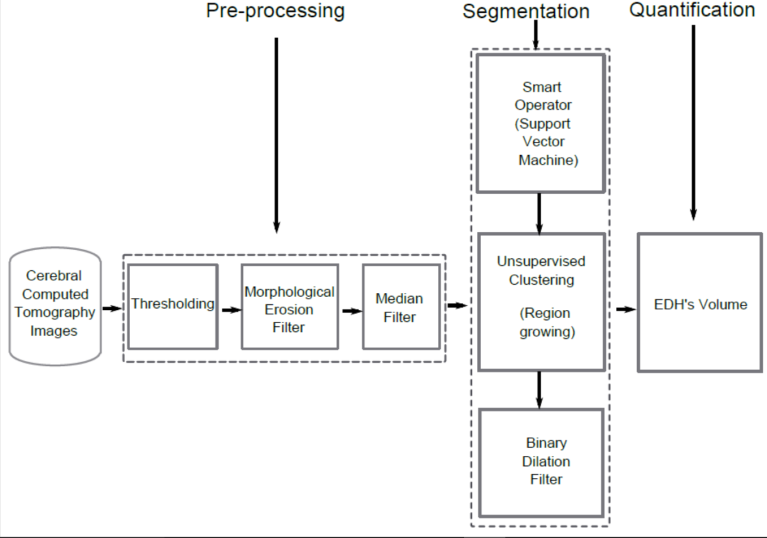
Figure 1.
Block diagram of the NLCT proposed for epidural hematomas segmentation.
C. Pre-processing stage:
Defining a volume of interest (VOI) which contains each hematoma to be considered: In figure 1, the phase which establishes a volume of interest corresponds to the block called Thresholding. Thresholding algorithms are, generally, simple structures and allow for efficient classification of the elements of an image considering one or more thresholds.. In the present work simple thresholding was used, allowing for discrimination between the anatomical structure of interest and the rest of the structures present in an image9,10.
Filtering phase: In the block diagram, presented in figure 1, this phase corresponds to the morphological erosion and median filters. A brief explanation of both filters follows.
- Morphological Erosion Filter (MEF):
Mathematical morphology11,12 is implemented in practice, through various morphological filters whose basic operators are erosion and dilation13. These operators are non-linear spatial filters that can be applied to binary, grayscale or color images. In particular, the erosion (⊖) of a two-dimensional image (I), composed of gray levels, using a two-dimensional structuring element (SE), as shown in Equation 114,15.

Where min is the minimum gray level contained in SE, (s, t) and defines the size of the SE and (x, y) represents the position of the pixel under study.
Median Filter (MF):
The median filter (MF) is also non-linear and normally, it is used to minimize the impulsive type noise present in the gray levels of the voxels neighboring the voxel object of study16. This type of filter is characterized by the conservation of the edges of the objects present in the image and it has the advantage that the final value, of the voxel, is a real value present in the image and not an average. In addition, the median filter is less sensitive to extreme values. One of the main drawbacks is that the computation time increases, substantially, as the size of the neighborhood increases17.
D. Segmentation stage
Computer intelligence operators: Support vector machines (SVM).
Support vector machines (SVM) are paradigms that undergo training and detection processes, and are based on both the Vapnik-Chervonenkis learning theory and the minimization principle that considers structural risk18. SVMs can be considered as classification and functional approach tools19,20.
A variant of the SVM, called the least squares support vector machine (LSSVM), can be obtained using robust statistics, Fisher discriminant analysis and replacing the inequation system that governs the SVM, by an equivalent system of linear equations, which can be solved more efficiently21,22,23.
In this work, the location of the seed voxel, to initialize the segmentation technique called Region Growing16 (RG), is calculated using LSSVM. For the purposes of this work, a radial base function (RBF) is considered in the LSSVM as the decision surface and, therefore, a formulation is obtained that depends on the hyperparameters identified as: a) Parameter for the error penalty (γ). b) To control the selectivity (σ2) of the LSSVM.
To automatically identify the coordinates of the seed voxel, the following procedure was implemented:
i) A size reduction technique is applied, based on bicubic interpolation, optimal reduction factor, is matched with that obtained in [3]. This allows to generate sub-sampled images of 64x64 pixels from filtered images of 512x512.
ii) A neurosurgeon selects, on the sub-sampled image, a reference point (P1) given by the centroid of the layer containing the maximum blood pool occupied by the EDH. For this point, the manual coordinates that unambiguously establish their spatial location in each considered image are identified.
iii) A LSSVM is implemented to recognize and detect point P1. For this, the processes of:
Training. Training circle circular neighborhoods of 10 pixels are selected, manually traced by a neurosurgeon, containing both point P1 (markers) and regions not containing P1 (no markers) are selected as a training set.
Then, each neighborhood is vectorized and, considering its gray levels, the attributes are calculated: mean, variance, standard deviation and median. Thus, both markers and non-markers are described by vectors (Va) of statistical attributes, given by: Va = [mean, variance, standard deviation and median]. Additionally, the LSSVM is trained considering the vectors Va as a training pattern and intoning the values of the parameters that control its performance, γ and σ2.
The training set is constructed with a ratio of 1:10, which means that 10 non-markers are included for each marker. During training, a classifier with a decision boundary is generated to detect LSSVM entry patterns as markers or non-markers. Subsequently, due to the presence of false positives and negatives, a process is applied that allows incorporating into the training set the patterns that the LSSVM initially classifies inappropriately.
In this sense, we considered a toolbox called LS-SVMLAB and the Matlab15 application to implement an LSSVM classifier based on a radial base gaussian kernel with parameters σ2 and γ.
Validation. The trained LSSVMs are used to detect P1, in images not used during training. To do this, a trained LSSVM looks for this reference point, in the axial view, from the first to the last image that makes up each of the 7 databases considered.
Finally, as a synthesis, figure 2 illustrates the process followed to locate the seed voxel in the databases considered.
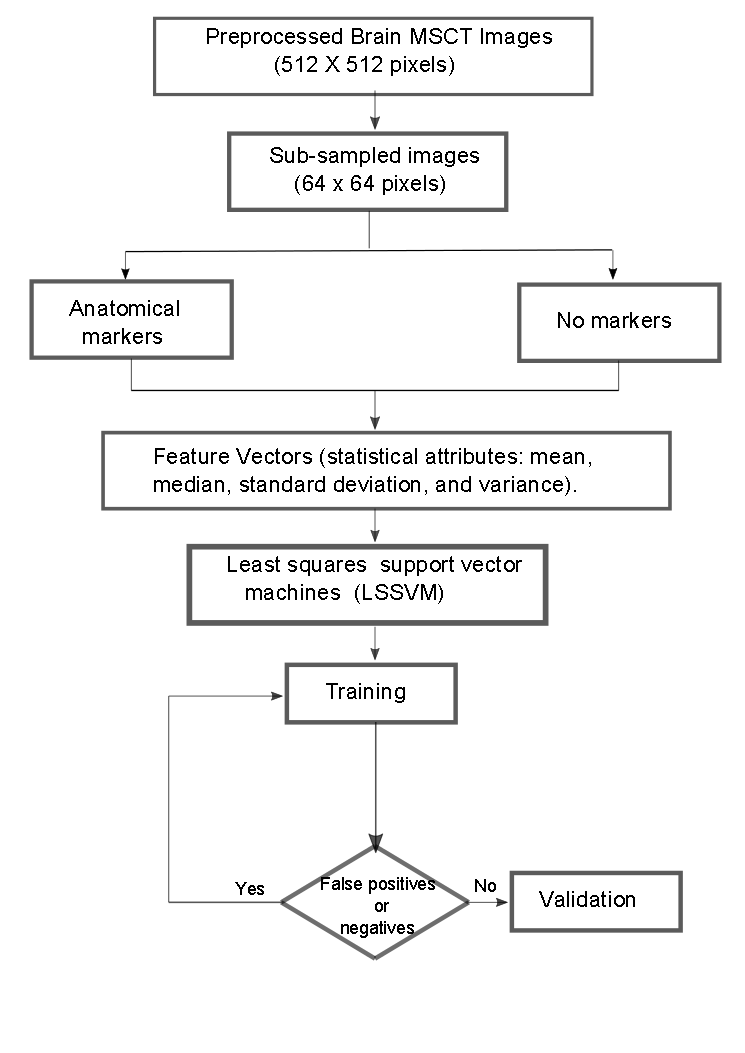
Figure 2.
Synthetic diagram that illustrates the operation of the LSSVM for the detection of seed voxel coordinates
Unsupervised clustering: Region Growing (RG).
Region Growing is an unsupervised grouping technique, which performs an iterative process that tries to characterize each of the classes, according to the similarity between the voxels that integrate each of them and thus perform the segmentation16. The RG requires a "seed" point which can be selected, manually or automatically, to extract all the pixels connected to said seed16. To apply the RG, to the pre-processed images, the following considerations were made: a) The initial neighborhood, which is constructed from the seed, is assigned a cubic shape whose side depends on an arbitrary scalar r. The r parameter requires an intonation process. b) As a pre-defined criterion, modeling is chosen through Equation 2.
|I(x) − µ| < mσ (2)
Where I(x) is the intensity of the seed voxel, μ and σ the arithmetic mean and the standard deviation of the gray levels of the initial neighborhood and m a parameter that requires intonation.
Binary dilation filter
In order to compensate the effect produced by the morphological erosion filter, the application of a morphological dilation filter (MDF) is considered, taking into account the binary image obtained by RG. The effect of morphological dilation is to enlarge the regions of the maximum intensity image. In particular, the dilation (⊕) of a two-dimensional binary image (Ib), using a bidimensional structuring element (B), is defined as the result of operating the Ib with the values of the SE under the logical operation OR14. For the purposes of this work, a cubic structuring element was considered and the size of said SE is left as a parameter to control the performance of the dilatation process.
Tuning parameters: Obtaining optimal parameters
The adequate performance of the proposed technique requires obtaining optimal parameters for each of the algorithms that comprise it. To do this, Database 1 (DB1) was used as a reference, the parameters associated with the technique are modified which you wish to intone by systematically going through the values belonging to certain ranges, as described below.
The erosion, median and expansion filters have as parameter the size of the observation window. In order to reduce the number of possible combinations, an isotropic approach was considered to establish the range of values, which control the size of the aforementioned window, which is given by the odd combinations, given by the following ordered lists: (1,1,1), (3,3,3), (5,5,5), (7,7,7) and (9,9,9).
The parameters of the LSSVM, σ2 and γ, are toned assuming that the cost function is convex and developing tests based on the following steps:
In order to tone the parameter γ, the value of σ2 is arbitrarily set and values are systematically assigned to the parameter γ. The value of σ2 is initially set at 2,5. Now, γ is varied considering the range [0,100] and a step size of 0.25. An analogous process is applied to tone the parameter σ2, that is, it is assigned to γ the optimal value obtained in the previous step and a step size of 0.25 is considered to assign to σ the range of values contained in the interval [0.50].
During the intonation of the parameters of the RG, each one of the automatic segmentations of the EDH corresponding to the DB1 described, are compared with the manual segmentations of the EDH generated by a neurosurgeon, considering the Dc. The optimal values for the parameters of the RG (r and m), are matched to that experiment that generates the highest value for the Dc
The Dc is a metric that allows to compare segmentations of the same 2D or 3D image, obtained by different methodologies. In the medical context, usually, the Dc is considered to establish how similar are, spatially, manual segmentation (RD) and automatic segmentation (RP) that generates the morphology of any anatomical structure. Additionally, the Dc is maximum when a perfect overlap between RD and RP is reached but it is minimal when RD and RP do not overlap at all. In addition, the expected values for the Dc are real numbers between 0 and 1. The mathematical model that defines the Dc is given by Equation 3.
On the other hand, table 1 presents the information related to the parameters obtained after applying the tuning stage.
| MEF (Size) | MF (Size) | RG (r,m) | MDF (Size) |
| (3,3,3) | (5,5,5) | (10,6)* | (5,5,5) |
Obtaining the volumes related to manual segmentations: The volume of the hematomas, present in the original images, can be estimated manually by applying the following protocol, applicable only to epidural or intraparenchymal hematomas:
It is assumed that the hematoma, candidate to be characterized, has an ellipsoidal shape. The volume of the hematoma is estimated, considering the axial layers, dividing by 2 the multiplication of the lengths A, B and C; where A and B are the lengths of the major and minor axis of the hematoma, respectively. Such lengths are measured in the image with the "pool" of blood, linked to the hematoma, of greater area. The length C is obtained by multiplying the number of layers, in which the hematoma is present, by the thickness (E) of each layer.
Obtaining the volumes related to the automatic segmentations: The proposed technique generates the automatic segmentations of the EDH present in each of the 7 databases described. From such segmentations, the volume of the hematoma, candidate to be characterized, is calculated by multiplying the voxel dimensions by the number of voxels that make up the automatically segmented EDH.
Clinical utility of the volumes occupied by the hematomas: The main clinical utility of the characterization of the hematomas by obtaining the volume lies in the decision making that is made to establish the behavior to be followed to address the presence of the hematomas in a patient24,25.
Results
Quantitative results: Regarding the trained LSSVM, the values of 2.50 and 0.25, respectively, were obtained as optimal parameters for γ and σ2. The maximum value of the Dc obtained for the segmentation of the EDH is comparable with that reported in references6,8, as shown in table 2.
| Authors | Technique | Modality | Dc Average |
| Liao et al. (2010)6 | (MaxF + PF + MRGP + MRLS) | MSCT | 0.9140 |
| Kamnitsas et al(2017)8 | Convolutional neural networks | MSCT | 0.9037 |
| Vera et al.* | NLCT | MSCT | 0.9003 |
Qualitative results: Figure 3, shows a 2-D view of both the original image and the processed versions after applying the NLCT technique
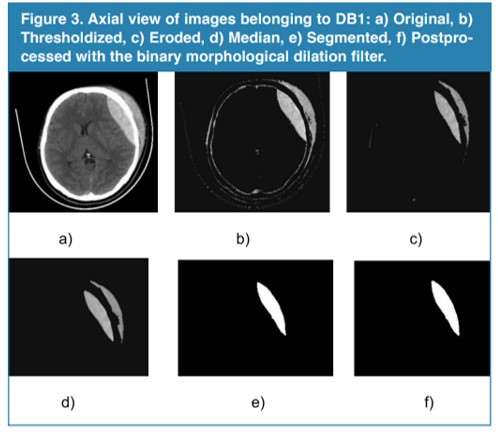
Figure 3
Axial view of images belonging to DB1: a) Original, b) Thresholdized, c) Eroded, d) Median, e) Segmented, f) Postprocessed with the binary morphological dilation filter.
Additionally, table 3 shows the values for the volume calculated considering the automatic segmentations of the EDHs.
| Database | Volume (cm3) |
| DB1 | 9.546 |
| DB2 | 56.220 |
| DB3 | 56.893 |
| DB4 | 30.689 |
| DB5 | 47.022 |
| DB6 | 65.041 |
| DB7 | 23.485 |
It is important to note that one of the main clinical utilities of these numeric values, for the volumes, is that they define (in a high percentage) the behavior that is to be followed regarding the patient. Additionally, if only volume is considered, hematomas that exceed the threshold of 30 cm3 are susceptible to surgery. In this case, the patients represented by the databases from 2 to 6, according to the calculated volume should be taken to the operating room.
Conclusions
We have presented a non-linear computational technique whose intonation allows a precise segmentation of cerebral epidural hematomas, present in computed tomography images, since the Dc obtained is comparable with that reported in the literature.
The use of intelligent operators, represented by the least squares support vector machines, allowed for the automatic identification of the coordinates corresponding to the seed voxels that play a crucial role in the adequate initialization of the unsupervised grouping algorithm based on growth of regions.
The segmentations generated, automatically, by the proposed computational technique allows for the calculation of the volume of each hematoma considered. This volume is vital when deciding if a patient is surgically treated or not to address the hematoma that affects their health status.
References
1. Stippler M. Craniocerebral trauma. In: Daroff RB, Jankovic J, Mazziotta JC, Pomeroy SL, eds. Bradley's Neurology in Clinical Practice. 7th ed. Philadelphia, PA: Elsevier; 2016: chap 62.
2. Mezzadri J., Goland J., y Sokolvsky M. Introducción a la Neurocirugía. Capítulo: Patología vascular II. Ediciones Journal. Segunda edición. 2011.
3. Vera M. Segmentación de estructuras cardiacas en imágenes de tomografía computarizada multi-corte. Ph.D. dissertation, Universidad de los Andes, Mérida-Venezuela, 2014.
4. Maiera A, Wigstrm L, Hofmann H, Hornegger J, Zhu L, Strobel N, Fahrig R. Three-dimensional anisotropic adaptive filtering of projection data for noise reduction in cone beam CT. Medical Physics. 2011;38(11):5896–909.
5. Kroft L, De Roos A, Geleijns J. Artifacts in ECG–synchronized MDCT coronary angiography. American Journal of Roentgenology.2007;189(3):581–91.
6. Liao C., Xiao F., Wong J., Chiang I. Computer-aided diagnosis of intracranial hematoma with brain deformation on computed tomography. Computerized Medical Imaging and Graphics 34 (2010) 563–571.
7. Dice, L. Measures of the amount of ecologic association between species. Ecology, vol. 26, n. 3, pp. 297-302. 1945.
8. Kamnitsas K., Lediga C. , Newcombeb V., Simpsonb J. , Kaneb A. , Menonb D., Rueckerta D., Glockera B. Efficient Multi-Scale 3D CNN with fully connected CRF for Accurate Brain Lesion Segmentation. Medical Image Analysis, Vol 23, pp.1603-1659, 2017.
9. Sezgin M., Sankur B. Survey over image thresholding techniques and quantitative performance evaluation. Journal of Electronic Imaging, vol. 13, pp. 146–165, 2004.
10. Pham D., Xu C., Prince J.Current methods in medical image segmentation, Annual Review of Biomedical Engineering. vol. 2, pp. 315–337, 2000.
11. Serra J. Image Analysis Using Mathematical Morphology. London, England: Academic Press, 1982.
12. W. Pratt, Digital Image Processing. USA: John Wiley & Sons Inc, 2007.
13. Mukhopadhyay S., Chanda B. A multiscale morphological approach to local contrast enhancement. Signal Processing, vol. 80, no. 4, pp. 685–696, 2000.
14. Yu Z., Wei G., Zhen C., Jing T., Ling L. Medical images edge detection based on mathematical morphology. En Proceedings of the IEEE Engineering in Medicine and Biology 27th Annual Conference, Shanghai–China, September 2005, pp. 6492–6495.
15. Chen T., Wu Q., Rahmani R., Hughes J. A pseudo top-hat mathematical morphological approach to edge detection in dark regions. Pattern Recognition. 2002; 35(1):199–210.
16. Passarielo G., Mora F. Imágenes Médicas, Adquisición, Análisis, Procesamiento e Interpretación. Venezuela: Equinoccio Universidad Simón Bolívar. 1995.
17. Fischer M., Paredes J., Arce G. Weighted median image sharpeners for the world wide web. IEEE Transactions on Image Processing. 2002;11(7):717-27.
18. V. Vapnik, Statistical Learning Theory. New York: John Wiley & Sons, 1998.
19. E. Osuna, R. Freund, y F. Girosi, “Training support vector machines: an application to face detection.” en Conference on Computer Vision and Pattern Recognition (CVPR ’97), San Juan, Puerto Rico, 1997, pp. 130–136.
20. A. Smola, “Learning with kernels,” Tesis de Doctorado, Technische Universitt Berlin,Germany, 1998.
21. B. Scholkopf y A. Smola, Learning with Kernels: Support Vector Machines, Regularization,Optimization, and Beyond. Cambridge, MA, USA: The MIT Press, 2002.
22. J. Suykens, T. V. Gestel, y J. D. Brabanter, Least Squares Support Vector Machines.UK: World Scientific Publishing Co., 2002.
23. M. Oren, C. Papageorgiou, P. Sinha, E. Osuna, y T. Poggio, “Pedestrian detection using wavelet templates,” en CVPR ’97: Conference on Computer Vision and Pattern Recognition (CVPR ’97). Washington, DC, USA: IEEE Computer Society, 1997, pp. 193–200.
24. Hu T., Yan L., Yan Peng., Wang X., Yue G. Assessment of the ABC/2 Method of Epidural Hematoma Volume Measurement as Compared to Computer-Assisted Planimetric Analysis. Biological Research for Nursing. 2016, 18(1) 5-11.
25. Freeman, W., Barrett, K., Bestic, J.,Meschia, J., Broderick, D., Brott, T. Computer-assisted volumetric analysis compared with ABC/2 method for assessing warfarinrelated intracranial hemorrhage volumes. 2008, Neurocritical Care, 9, 307–312.
Author notes
m.avera@unisimonbolivar.edu.co